Located in:
- II. Strategic Elements
The Unified or Combined State Plan must include a Strategic Planning Elements section that analyzes the State’s current economic environment and identifies the State’s overall vision for its workforce development system. The required elements in this section allow the State to develop data-driven goals for preparing an educated and skilled workforce and to identify successful strategies for aligning workforce development programs to support economic growth. Unless otherwise noted, all Strategic Planning Elements apply to Combined State Plan partner programs included in the plan as well as to core programs.
- a. Economic, Workforce, and Workforce Development Activities Analysis
The Unified or Combined State Plan must include an analysis of the economic conditions, economic development strategies, and labor market in which the State’s workforce system and programs will operate.
- a. Economic, Workforce, and Workforce Development Activities Analysis
II. a. 1. B. Workforce Analysis
The Unified or Combined State Plan must include an analysis of the current workforce, including individuals with barriers to employment, as defined in section 3 of WIOA4. This population must include individuals with disabilities among other groups5 in the State and across regions identified by the State. This includes—
[4] Individuals with barriers to employment include displaced homemakers; low-income individuals; Indians, Alaska Natives, and Native Hawaiians; individuals with disabilities, including youth who are individuals with disabilities; older individuals; ex-offenders; homeless individuals, or homeless children and youths; youth who are in or have aged out of the foster care system; individuals who are English language learners, individuals who have low levels of literacy, and individuals facing substantial cultural barriers; farmworkers (as defined at section 167(i) of WIOA and Training and Employment Guidance Letter No. 35-14); individuals within 2 years of exhausting lifetime eligibility under the Temporary Assistance for Needy Families program; single parents (including single pregnant women); and long-term unemployed individuals.
[5] Veterans, unemployed workers, and youth, and others that the State may identify.
i. Employment and Unemployment
Provide an analysis of current employment and unemployment data, including labor force participation rates, and trends in the State.
ii. Labor Market Trends
Provide an analysis of key labor market trends, including across existing industries and occupations.
iii. Education and Skill Levels of the Workforce
Provide an analysis of the educational and skill levels of the workforce.
iv. Skill Gaps
Describe apparent ‘skill gaps’.
Current Narrative:
Population
This section analyzes the demographics of Arkansas during 2010-30. Specifically, the study focuses on age and race populations at the state level, and urban-rural populations at the metropolitan, micropolitan and non-metropolitan level. Estimates (2010-18) are based on available data from the US Census Bureau and projections (2019-30) from the Institute for Economic Advancement at UALR and the Center for Disease Control and Prevention (CDC) Online Database.
Age Distribution
An analysis of Arkansas’ population distribution by gender and age group for 2010, 2018 and 2030 revealed that between 2010-18 the number of people 65+ grew substantially while the younger population (under-20) reduced. In fact, the 65+ group increased its share of the total population from 14.4% in 2010 to 17.0% in 2018, a growth of about 90,000 people. During the same period, the under 20 age group went down from 27.3% to 26.0%, a net decrease of about 14,000. Based on the population projections, by 2030, 26.7% of the state population will be under age 20 while 20.3% will be age 65 or older resulting in the older population continuing to increase its share of the total population.
Racial and Ethnic Composition
This subsection describes the projected racial and ethnic composition of the state population from 2013-2060. Four major ethno-racial groups are identified: whites, blacks, Hispanics, and other races. Hispanics are not a racial group but rather an ethnic group, which means that whites, blacks and other races are found in this group. In this study, the whites, blacks and other races groups exclude Hispanics. The ethno-racial composition of the total population (all ages) and the younger population (under age 20) are examined.
Whites constitute the current and projected predominant population group in Arkansas. The under 20 age group is more diverse than the total population with whites constituting 63.7% of the under 20 population in 2018 as compared to 72.2% of the total population (all ages).
The white population group is expected to experience a decrease in its share of the total population from 72.2% in 2018 to a projected 68.1% in 2030, a decrease of about 4.1 percentage points. The trend is also expected for the under age 20 population, with the share of the white group decreasing from 63.7% in 2018 to a projected 59.0% in 2030, a decrease of 4.7 percentage points.
The remaining three groups (blacks, Hispanics, and other races), all are expected to show an increase in their share of total population. However, the Hispanics are anticipated to experience the largest percentage growth going from 7.7% in 2018 to 10.1% in 2030. This is also true for the under age 20 population with the Hispanic group growing from 11.6% in 2018 to 14.5% in 2030.
Urban-Rural
There are two different definitions that categorize urban and rural areas in the country, one developed by the US Census Bureau and the other by the Office of Management and Budget (OMB). The US Census Bureau defines urban and rural areas based strictly on population size and density and they do not necessarily follow municipal boundaries. The OMB follows a regional-economic concept to define counties or county-equivalent units as metropolitan, micropolitan or neither. A metropolitan area (MSA) consists of one or more counties with a core urban population of 50,000+ and a micropolitan area has a core urban population of at least 10,000 but less than 50,000. Metropolitan areas are categorized as urban while counties that are not part of a metropolitan area are considered rural.
This subsection follows the OMB definition of urban and rural to classify the state counties into three major groups: metropolitan, micropolitan, and other rural. The majority of the state population is urban. In 2010, about 60% of all Arkansans lived in metropolitan areas while about 40% lived in rural areas (micropolitan and other rural). Population estimates from 2010-18 show that metropolitan areas are growing steadily but modestly. On the other hand, the populations of the micropolitan and other rural areas keep shrinking. In 2018, the share of all Arkansans living in urban areas grew to 62.5% while population in rural areas (micropolitan and other rural) decreased to 37.5%.
Metropolitan Areas
Out of eight metropolitan areas, Little Rock-North Little Rock-Conway, Fayetteville-Springdale-Rogers, Fort Smith, and Jonesboro are the most populated. In 2010, these four areas alone hosted close to half (49.6%) of the state population and in 2018, their share passed the halfway mark with 52.8% of all Arkansans living in these metropolitan areas.
In 2018, 21.1% of the state population lived in Pulaski, Faulkner and Saline counties in the LR-NLR-Conway metropolitan area. In the same year, within the Fayetteville-Springdale-Rogers area, Benton and Washington counties were the most populated sharing 16.9% of the total population. Between 2010 and 2018, most of the gains in the state urban population came from population growth in Benton and Washington. During this period, these two counties alone increased their share of total population by 2.3 percentage points.
In general terms, the population in a geographic region can vary over time due to changes in several factors: number of births, deaths, and migration. For instance, in 2011, 52.6% of the population change (from the previous year) in the LR-NLR-Conway MSA was due to migration into the area. Out of this, domestic migration accounted for 40.3% while international migration contributed 12.3%. On the other hand, in 2016, 18.9% of the population change was due to domestic migration out of the region (hence a negative percentage) while 32.7% was due to international migration into the area.
The overall migration patterns for these two metro areas are different. During this period, the Fayetteville-Springdale-Rogers area experienced consistently positive international and domestic migration accounting jointly for about 60% or more of their annual population change. On the other hand, domestic migration in the LR-NLR-Conway area has been decreasing over the years and at times has even been negative. Since 2014, annual international migration in this area has accounted for a larger share of population change compared to their domestic counterpart.
Industry
This section describes projected labor demand trends by industry sector for the state and Local Workforce Development Areas (WDA) for the decade of 2016-26. The analysis is based on the long-term (2016-26) State and Local WDA industry projections published by the Arkansas Division of Workforce Services and the national long-term industry projections published by the Bureau of Labor Statistics. The industries analyzed include all the 2-digit industry sectors defined by the North American Industry Classification System (NAICS), except for two – the self-employed and government sectors.
According to our data, labor demand in the state is expected to increase by 123,795 jobs between 2016-26. This increase will mainly come from growth in the top five industry sectors: Health care and Social Assistance, Manufacturing, Retail Trade, Educational Services, and Accommodation and Food Services, which jointly are anticipated to add 79,686 jobs.
There are differences in the state and national job distribution patterns. The sectors in Arkansas that employ significantly more people compared to their counterparts in the nation are: (1) Manufacturing, (2) Transportation and Warehousing, (3) Management of Companies and Enterprises, and (4) Agriculture, Forestry, Fishing and Hunting. On the other hand, the industry sectors that employ significantly less people than at the national level are: (1) Professional, Scientific and Technical Services, (2) Finance and Insurance, (3) Administrative and Support and Waste Management and Remediation Services, and (4) Information.
To facilitate the analysis, the industry sectors at the state level are divided into three groups based on the number of jobs: Large (employing 100,000 or more), Medium (employing between 35,000-100,000) and Small (employing less than 35,000).
Even though the percentage distribution of jobs among the industry sectors in the state are different from the nation, the job distribution numbers among the three groups mentioned above are about the same. For instance, the large group (comprising the top five industry sectors) accounts for 60.3% of all jobs in Arkansas and 56% of all jobs in the country. The medium group (next eight industry sectors) accounts for 33.4 % of jobs in Arkansas and about 36.8% of jobs in the country and finally, the small group (consisting of the bottom six sectors) accounts for 6.4% of the state jobs and 7.4% of the nation’s jobs.
All industry sectors are expected to show growth except for two – Information and Mining. For the large industry sectors, Health Care and Social Assistance is projected to show the fastest growth (20.7% increase and 37,651 additional jobs). Similarly, for the medium-sized industry sectors, Management of Companies and Enterprises is expected to grow the fastest (22.9% and 8,029 jobs) and likewise, among the small-sized sectors Real Estate and Rental and Leasing are expected to grow by 10.5% and 1,400 jobs.
Industry Sectors at the Local WDA Level
Arkansas is divided into ten local Workforce Development Areas. We analyzed these ten areas along with their projected percent and numeric change in total employment for all sectors between 2016-2026. The Northwest WDA is expected to grow at the fastest rate (14.2%) and also add the most number of jobs (37,546). The North Central WDA is next with a growth rate of 13.8%adding 9,158 jobs. The other WDAs that are expected to experience more than 10% growth were Central WDA, West Central WDA, and Northwest WDA. As expected, those WDAs located in the Mississippi Delta Region, the Eastern WDA and Southeast WDA experience the least percentage growth.
The majority of the jobs across all industry sectors are located in three local Workforce Development Areas – Northwest, Little Rock and Central. The three areas together account for about 51.2 % of all WDA jobs with the Northwest taking the largest share. Apart from jobs in Health Care and Social Assistance, the majority of the jobs in the large industry sectors are located in the Northwest. The Little Rock Area accounts for the largest number of jobs in Health Care and Social Assistance. Among the medium-sized industry sectors, most of the jobs in Transportation and Warehousing and Management of Companies and Enterprises are located in the Northwest.
We determined the estimated projected percentage change in the number of jobs for each of the industry sectors at the WDA level between 2016 and 2026. In the large industry sectors, the Health Care and Social Assistance sector is expected to grow significantly across all local WDAs, while Manufacturing shows modest growth or decline in all areas except for North Central and Northeast where it shows a relatively strong growth. Among the medium-sized sectors, Management of Companies and Enterprises is expected to experience the fastest growth among all industry sectors across all WDAs with the exception of West Central. Among the small-sized industrial sectors, Information shows an across the board decline with the exception of the Central WDA, which shows a significant growth. The Mining sector also shows a modest growth or decline in all WDAs except for the Northeast.
Labor Force and Unemployment Rate
This section describes the State labor force and unemployment rate estimates for the period between January 2008 – September 2019 published by the Division of Workforce Services. We have included Table 8 from this report below. Stated simply, the labor force includes all civilians 16 years and older who are employed or unemployed.
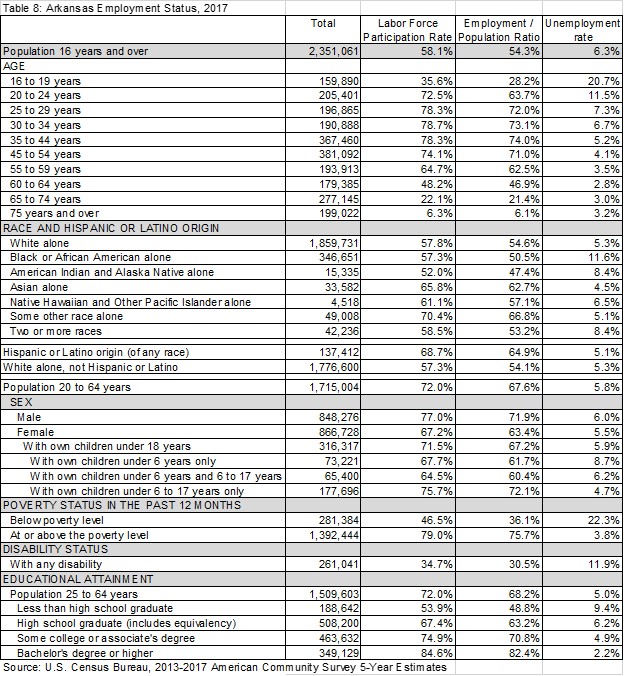
Table 8 (above) takes a detailed look at the labor force data for the year 2017 calculated by the U.S. Census Bureau (based on the 2013-2017 American Community Survey). The table includes labor force participation rates, employment-to-population ratios and unemployment rates for various demographics. The highest unemployment rates are found among the younger population, Blacks or African Americans, persons with disabilities, and those with less than a high school diploma.
We reviewed our historical data (January 2008 – September 2019) for the State labor force and the number of employed. As a consequence of the Great Recession of 2008, both the labor force and the number of unemployed decreased from 2008 till 2010. They made a modest recovery from 2010-2012 and then shows a sharp decline again until 2014. From that point onward the labor force and number of unemployed have experience a steady increase. However, since 2014 the number of employed has increased at a faster rate than the labor force. In fact, the number of employed in September 2019 has surpassed the pre-recession level while the labor force is just approaching its pre-recession level. As a result, the unemployment rate has been steadily decreasing from its highest in May 2011 (8.5%) to its lowest at 3.4% in August 2019.
Nonfarm Industry Employment Estimates
Trends in the employment estimates from 2008-2018 for the Large, Medium, and Small nonfarm Industry Sectors are analyzed in this section. The Large, Medium, and Small Industry Sectors are defined in the above section on Industry Employment Projections. The Agriculture, Forestry, Fishing and Hunting sector is excluded from this analysis while Utilities is incorporated into the Transportation and Warehousing sector.
Among the large sectors, Health Care and Social Assistance has been consistently increasing in the past decade while Manufacturing showed a sharp decline from 2008-2013 and since then shown a modest growth in employment. In terms of percentage change, Health Care and Social Assistance experienced the fastest growth at 20.7%.
In the medium-sized sectors, all industries showed a modest growth from 2010 onward with Administrative and Waste Services experiencing the greatest numeric change with 14,700 jobs added while Management of Companies and Enterprises experienced the greatest percentage change at 34.2%. Other notable changes were the numeric increases 8,900 jobs in both Finance and Insurance as well as Management of Companies and Enterprises. Finally, other notable percentage changes were Administrative and Waste Services at 27.9% and Finance and Insurance at 23.4%.
For the small-sized sectors, all industries show either a decline or a slight increase in employment. The Mining and Logging sector showed the largest percentage decline at 43.9% (a loss of 4,700 jobs) followed by Information at 35.6% (6,200 jobs lost).
Based upon the NAICS Industry Titles, an analysis of the nonfarm employment estimates for all industry sectors between 2008 and 2018 showed an overall increase of 59,400 jobs (4.9%). Mining and Logging experience a decrease of 43.9%, followed by Information with a 35.6% decrease. No other category experienced a decrease of at least 30%. On a positive note, Management of Companies and Enterprise saw the largest increase of 34.2% followed closely by Social Assistance with an increase of 33.3% and Ambulatory Health Care Services with an increase of 29.6%. There was no other category with an increase of more than 25%.
Arkansas Department of Commerce Research Team Inputs
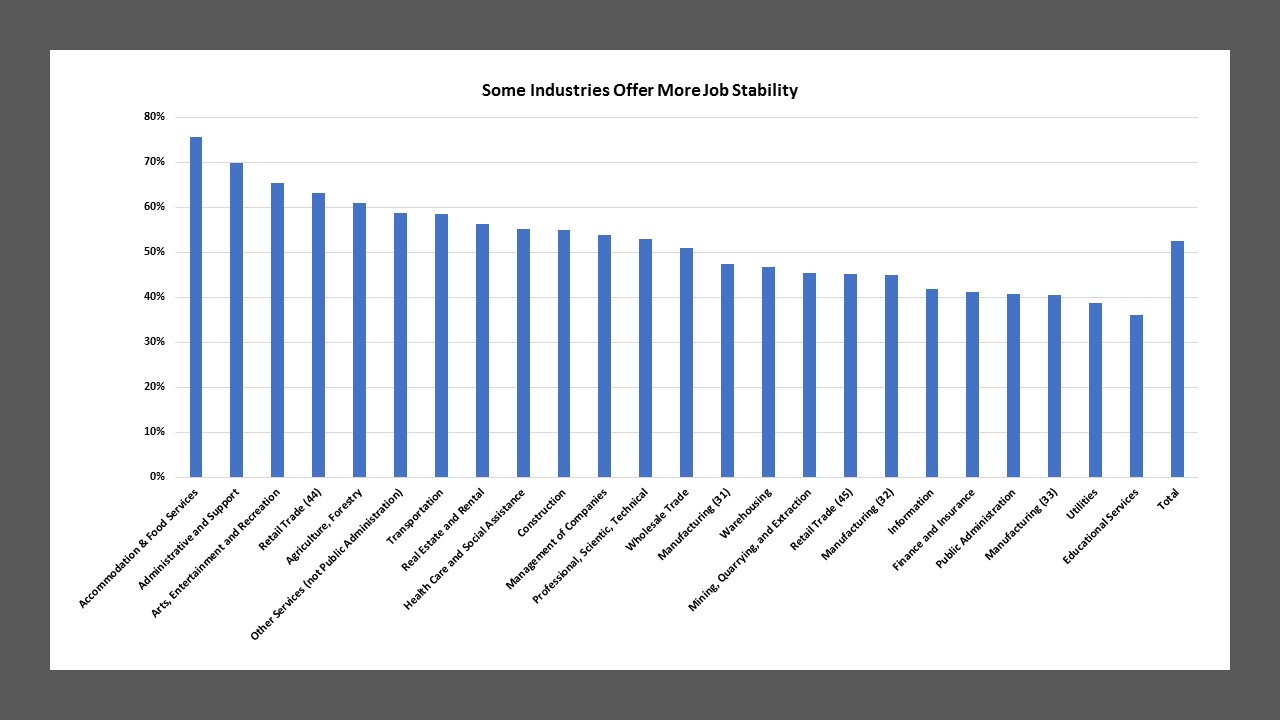
Important stylized facts about labor markets involve patterns of turnover, job stability, and length of tenure. Many hires lead to jobs of short duration, lasting less than a year. Such transient hires tend to comprise a small share of the total stock of jobs at any given time, however. We analyzed the share of stable jobs existing at the end of 2018 that began in 2016 or later, by industry. Across all industries, about half of jobs had appeared, or the most recent hire into the job had taken place, three years prior or less. But the ratio varied greatly by industry, from 76% in accommodation and food services, to under 40% in utilities and education.
Long-term jobs tend to pay better. In most industries—utilities is an intriguing exception—the long-term workers earn substantially more than the recent hires. In most industries, long-term employees earn about 30-100% more than new hires. While obvious explanations for this include firm-specific on-the-job training and rewards for organizational loyalty, it could also reflect the skill and/or effort levels of transient versus permanent workers. Either way, it suggests the value of placing people in long-term, stable jobs. The Chart below shows the share of stable jobs existing at the end of 2018 that began in 2016 or later, by industry. Across all industries, about half of jobs had appeared, or the most recent hire into the job had taken place, three years prior or less. But the ratio varied greatly by industry, from 76% in accommodation and food services, to under 40% in utilities and education.
Industries Employing College-Educated Workers, by Gender and Region
College-educated workers are found in all industries, but they are more concentrated in some industries relative to the workforce as a whole. These patterns of industry concentration vary somewhat by region as well. One striking pattern is that women with a Bachelor’s degree or more tend to be concentrated in the health and education industries, especially outside metropolitan centers. The share of college-educated working women who are in health or education exceeded 60% in the North Central Workforce Area, and was nearly 60% in the Eastern and Southeast Workforce Areas. It was lowest in the Northwest Workforce Area, at just over 40%. The chart below displays the percentage of labor force with Bachelor's level of attainment of men and women, by local workforce area.
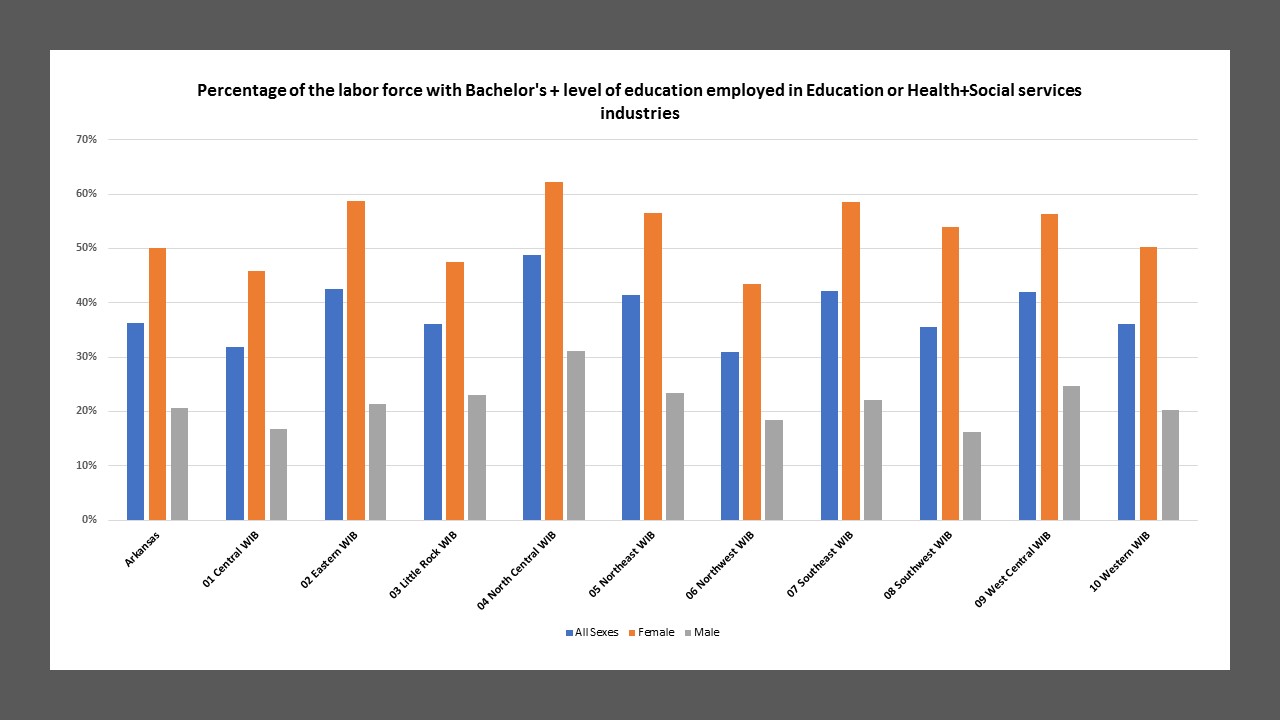
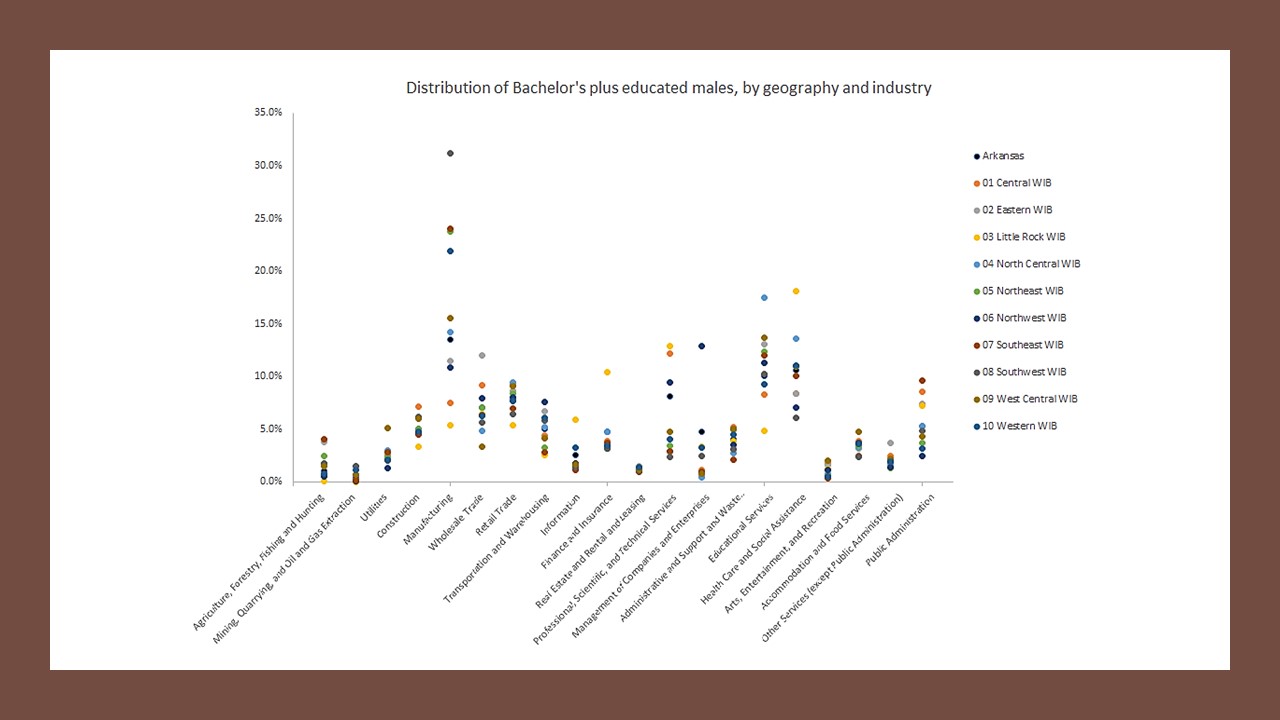
The share of college-educated men working in health and education was everywhere much lower than the share of college-educated working women. It was highest in the North Central Workforce Area, at just over 30%, and under 20% in the Northwest, Southwest, and Central Workforce Areas.
If college-educated men don’t work in health and education, where do they work? Our data shows that the answers vary a lot by region. Manufacturing, for example, employs 31% of college-educated working men in the Southwest Workforce Area, and 24% in the Northeast Workforce Area, but only 11% in the Northwest Workforce Area, 8% in the Central Workforce Area and 5% in the Little Rock Workforce Area. By contrast, professional, scientific and technical services employs 13% of college-educated working men in the Little Rock Workforce Area, 12% in the Central Workforce Area, and 10% in the Northwest Workforce Area, but under 5% in most Workforce Areas and under 3% in some.
Looking for Growing Occupations with Good Wages
Occupational categories differ in prevailing pay rates and job growth. In recent years, there have been job losses for office and administrative support occupations in most regions of the state. Most regions have also seen a decline in legal occupations (except NW Arkansas) and in life, physical, and social science occupations. By contrast, there has been strong growth in food preparation and serving related occupations, though with considerable regional variation. However, food service is a poorly paid occupation, earning less than $10/hour median wages throughout the state.
Educational Awards by Level, Region, and Field of Study
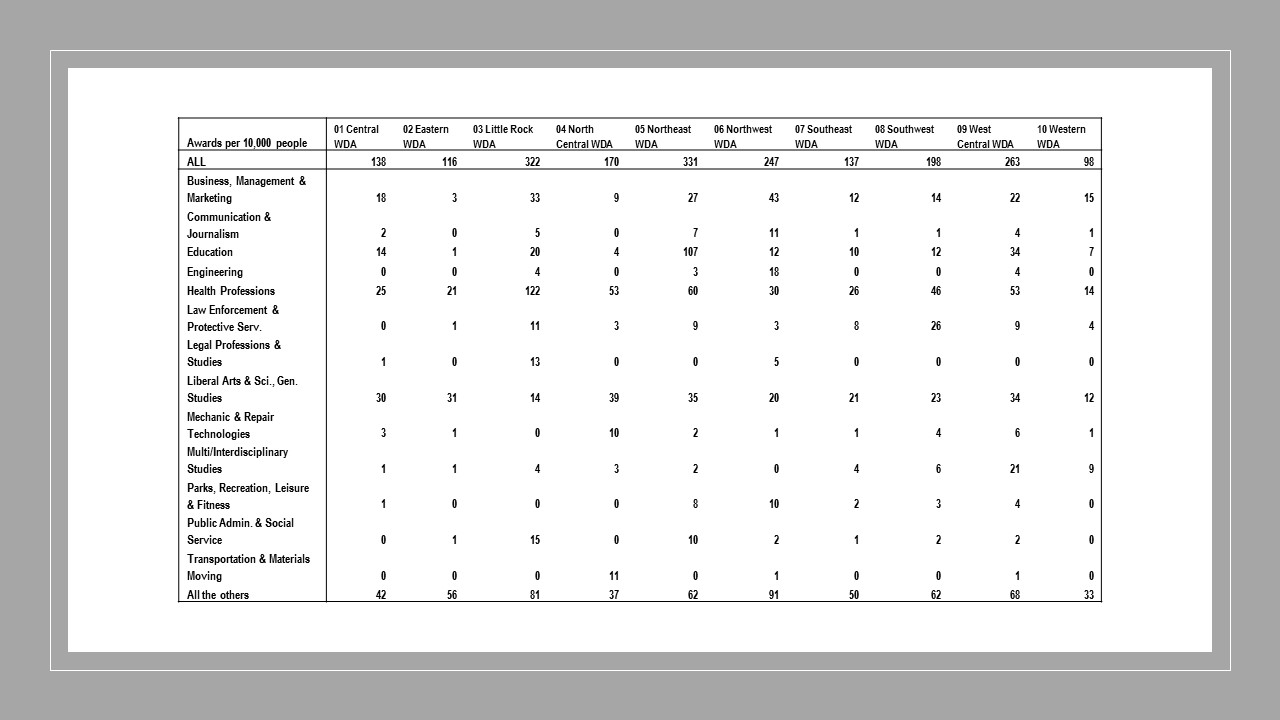
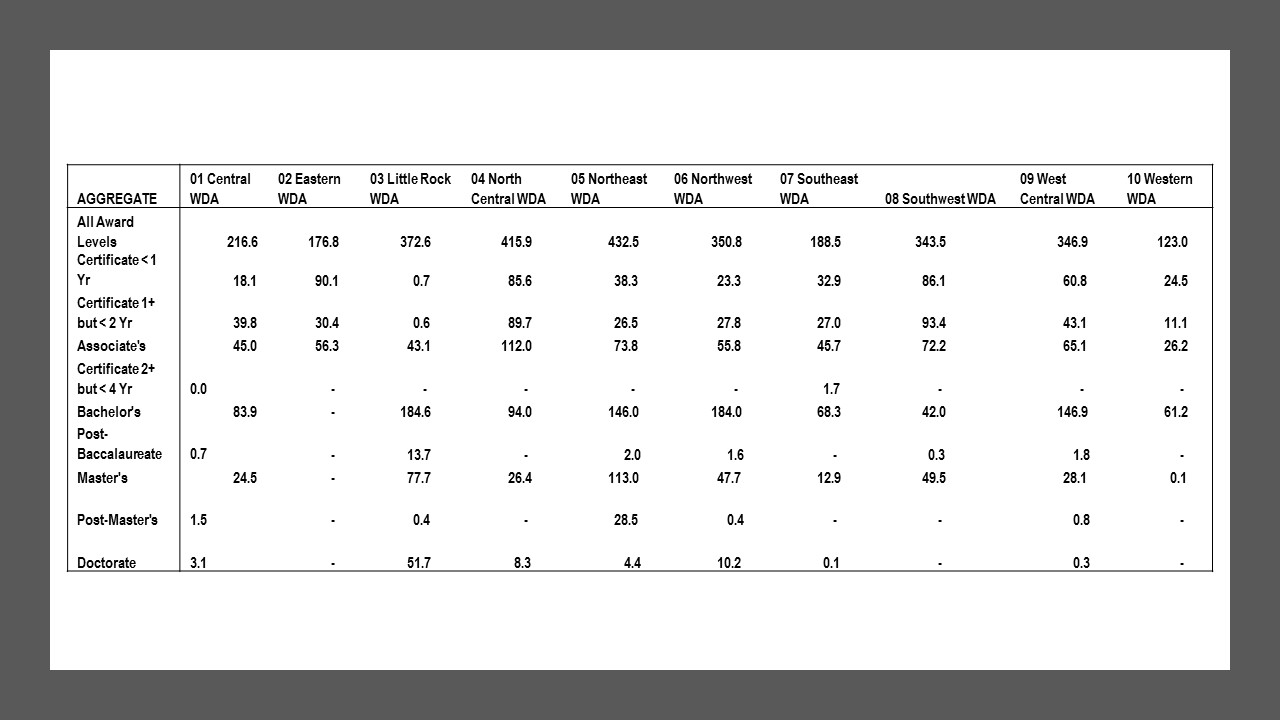
In the chart below, we analyzed how many educational awards, altogether and at various levels, were awarded in each of the WDAs (Workforce Development Areas) of the state. Substantial interregional differences are visible. First, of course, regions with major Bachelor’s degree granting institutions stand out for awarding more Bachelor’s degrees per capita. Thus, Northwest WDA, home of UA-Fayetteville, awards 184 Bachelor’s degrees per 10,000 people, and Northeast WDA, home of ASU-Jonesboro, awards 146, but Southeast only 68, Southwest only 42 and Eastern WDA none. Little Rock WDA (UALR) and Central WDA (UCA) are the other Bachelor’s degree hubs. There seems to be a pattern whereby regions that award fewer Bachelor’s degrees tend to award more certificates, which should make sense if all populations have some demand for postsecondary education and certificate programs and Bachelor’s degree programs are substitutes.
The chart below also classifies awards by field of study (but not level) in order to shed light on regional differences in choice of field. The total numbers of awards differ because the data source, ARC’s Economic Security Report, does not include private institutions. In some cases, the concentration of graduates from particular fields of study in particular regions fits with known distributions of economic activity across the state. The fact that business and management awards per capita is highest in Northwest WIB area makes sense in light of the concentration of corporate headquarters in that part of the state. Likewise, the concentration of health professions degrees in Little Rock WIB area reflects Little Rock’s role as a hospital and health care hub with a large catchment area. It is less clear why education awards are concentrated in Northeast WIB area, or transportation awards in North Central WIB area.