
Located in:
- II. Strategic Elements
The Unified or Combined State Plan must include a Strategic Planning Elements section that analyzes the State’s current economic environment and identifies the State’s overall vision for its workforce development system. The required elements in this section allow the State to develop data-driven goals for preparing an educated and skilled workforce and to identify successful strategies for aligning workforce development programs to support economic growth. Unless otherwise noted, all Strategic Planning Elements apply to Combined State Plan partner programs included in the plan as well as to core programs.
- a. Economic, Workforce, and Workforce Development Activities Analysis
The Unified or Combined State Plan must include an analysis of the economic conditions, economic development strategies, and labor market in which the State’s workforce system and programs will operate.
- a. Economic, Workforce, and Workforce Development Activities Analysis
II. a. 1. B. Workforce Analysis
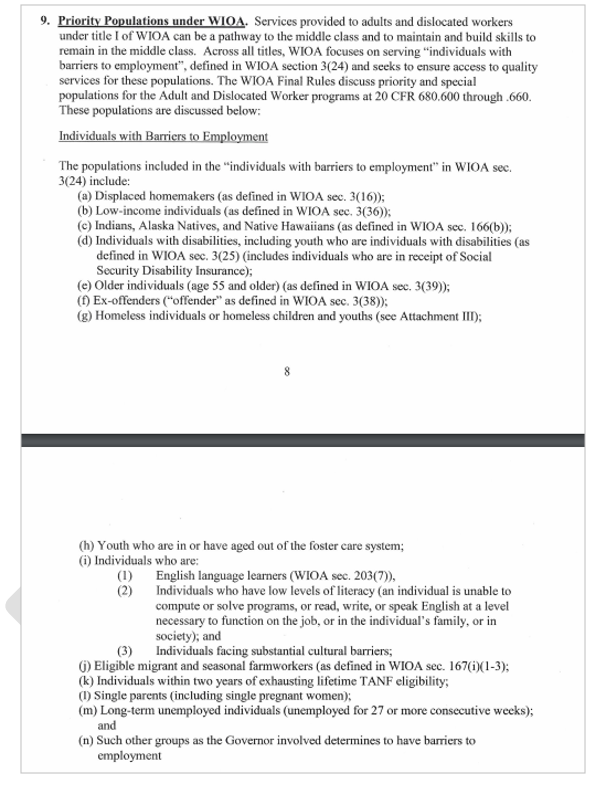
The Unified or Combined State Plan must include an analysis of the current workforce, including individuals with barriers to employment, as defined in section 3 of WIOA4. This population must include individuals with disabilities among other groups5 in the State and across regions identified by the State. This includes—
[4] Individuals with barriers to employment include displaced homemakers; low-income individuals; Indians, Alaska Natives, and Native Hawaiians; individuals with disabilities, including youth who are individuals with disabilities; older individuals; ex-offenders; homeless individuals, or homeless children and youths; youth who are in or have aged out of the foster care system; individuals who are English language learners, individuals who have low levels of literacy, and individuals facing substantial cultural barriers; farmworkers (as defined at section 167(i) of WIOA and Training and Employment Guidance Letter No. 35-14); individuals within 2 years of exhausting lifetime eligibility under the Temporary Assistance for Needy Families program; single parents (including single pregnant women); and long-term unemployed individuals.
[5] Veterans, unemployed workers, and youth, and others that the State may identify.
i. Employment and Unemployment
Provide an analysis of current employment and unemployment data, including labor force participation rates, and trends in the State.
ii. Labor Market Trends
Provide an analysis of key labor market trends, including across existing industries and occupations.
iii. Education and Skill Levels of the Workforce
Provide an analysis of the educational and skill levels of the workforce.
iv. Skill Gaps
Describe apparent ‘skill gaps’.
Current Narrative:
B. Workforce Analysis
Illinois’ population in the 25-54 age group declined by almost 240,000 (-1.9%) between 2011 and 2018, according to the U.S. Census Bureau’s American Community Survey (ACS) 5-year estimates. Much smaller declines occurred in the 15-19 year-old population and the 20-24 year-old age group as well. During that same period, the population in the 55-64 age group increased by over 214,000 (+1.7%). As the overall population gets older, the available labor force in Illinois will likely continue to decline.
A chronic threat to maintaining a robust workforce is population loss due to changing demographics or outmigration. As with most Midwestern states, Illinois’ overall population and its share of the national population have been trending downward for years. The Illinois Congressional delegation has been reduced with every decennial census since 1970 because our population growth did not keep pace with other states, or our population dropped outright.
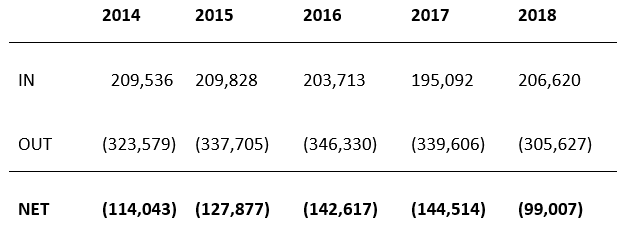
Using data from the US Census Bureau’s annual American Community Survey, migration out has exceeded migration in each year since 2014.7 Over this time frame the migration has ranged from a net loss of 144,514 in 2017 to a net loss of 99,007 in 2018.
Migration Table 1
Migration Chart 1

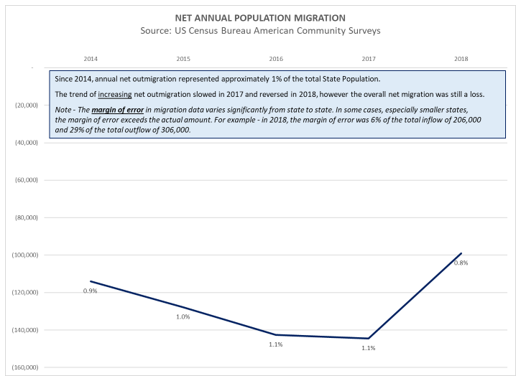
The annual net loss represents approximately one percent of the state’s total population. While 2017 is the recent low point, the rate trend of accelerating losses lessened that year and the trend actually reversed in 2018 as shown in the chart below. This chart also provides the percent of the total state population the annual net loss represents.
Migration Chart 2
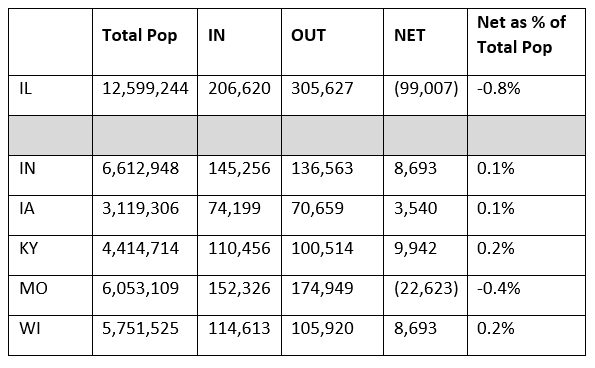
Illinois has a total population nearly double of each of the next most populous border states, Indiana and Missouri. Of these states, all but Illinois and Missouri experienced net migration-related growth in 2018.
Migration Table 2
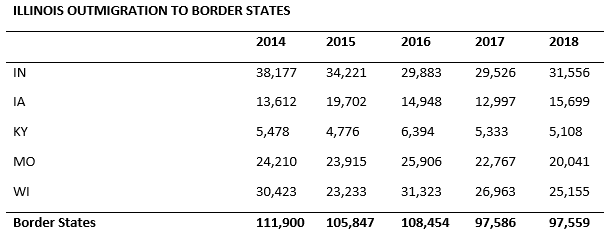
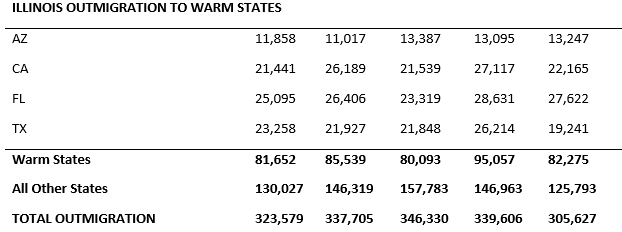
Focusing on outmigration, an analysis of where the 305,600 Illinois residents that left the state migrated in 2018 reveals the following insights:
Migration Table 3
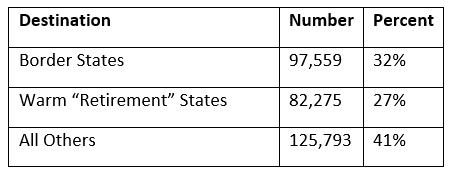
- Nearly one-third went to a border state
- Slightly less than this amount went to a warm-weather state
- The most popular border state destination was Indiana, with 31,600 migrations
- The most popular destination state overall was Florida, with 27,600 migrations
Migration Tables 4 & 5
When compared to all states (and the District of Columbia) in 2018, Illinois is in the top five states for the number of people leaving, trailing only California, Florida, Texas, and New York. However, when we examine the outmigration number as a percent of the total population, Illinois drops to nearly the bottom third of the pack, ranking 33rd in the nation. So, while outmigration is larger than we would like, the significance of the outmigration number is lessened when viewed in the context of total population and how Illinois compares to the rest of the nation.
Furthermore, as detailed in the response report to the Governor’s EO 3 report, the last few decades have seen slow and steady depopulation of the less urbanized areas of states across the Midwest as economic forces have reduced job prospects in these regions. From 1990 to 2017, the Northwest, West Central, South and Southeast regions of Illinois lost more than 3% of their population at a time when the overall state population grew by more than 12%. Of equal concern is the aging population of these regions, which rank highest in their share of population age 65 or older, and rank among the lowest in their share of population below age 19. Finally, the percent of residents in these regions who are college graduates lags the state, indicating a “brain-drain” of the most educated members of these communities.
i. Employment and Unemployment
Table 10 provides population and employment information for working-age individuals in the State of Illinois, broken down by census categories of race and ethnicity.

Overall, unemployment rates are highest (and labor force participation rates are lowest) for African-Americans. Looking deeper into this issue, unemployment rates for the 16-19 age group are much higher than the overall rate, and are especially high for African-Americans, Hispanics and those in the “other” race category. Part of this discrepancy among racial/ethnic groups may be related to living in areas where few appropriate job matches are available. Unemployment rates are lowest among Caucasians for the 20-24, 55-64, 65-69 and 70+ age groups, while Asians have the lowest rates for the 16-19 and 25-54 groupings.
While unemployment rates for youth (ages 16-19) are high, the rates for older workers (65+) have remained relatively low. This is likely a result of many older individuals leaving the labor force after separation from work (voluntarily or involuntarily). Other targeted populations include veterans, single-parent families (headed by either a male or female) and persons with disabilities. The unemployment rate for all veterans is below the rate for the entire population. However, the rate for veterans in the 18-34 age groups is still higher than the overall state average. Nevertheless, this gap has closed as fewer veterans are being discharged in recent years, resulting in fewer making the transition from the military to civilian employment. Unemployment rates for single-parent families remain higher for heads of households of both genders, but significantly higher for females compared to males. Rates for individuals with disabilities are higher than any other group except for youth. Attachment C (https://www.illinoisworknet.com/WIOA/Resources/Documents/Attachment%20C%20-%20Labor%20Force,%20Employment%20and%20Unemployment%202020.pdf) provides additional demographic details regarding the Illinois labor force, employment and unemployment during this period.
ii. Labor Market Trends
Key Labor Market Trends
The evolving workforce is a constant challenge to workforce and education systems. We must provide education and training to meet the demands of businesses but also be able to adjust our priorities and service delivery strategies to anticipate medium- and long-term labor market trends. By 2020, on average, 65% of all jobs will require postsecondary education. However, Illinois is above the national trend with 70% of our jobs requiring postsecondary education.
Futurists and prognosticators are not united in their predictions, but there generally seems to be consensus on the following:
- Near-Term
- Generation Gap
- Baby boomers, Gen X, Millennials, and now Gen Z occupy the same workspace. That’s four distinct generations with different views, expectations, and priorities. Companies will have to adopt new methods for just about everything — from recruitment and benefits to training and advancement; which means workforce development must also adopt new methods.
- Ongoing Skill Gap Issues
- Some executive surveys indicate nearly 80% of companies perceive the existence of a significant skill gap.
- Meanwhile, surveys of workers indicate that the opportunity to continue learning and growing is becoming more important to employees.
- Current Employee Retention & Engagement Statistics
- 40% of employers plan to fill current and future openings with full-time workers, and 47% plan to hire part-time workers going into 2019 (CareerBuilder)
- 50% of HR managers have current openings for which they can’t find qualified candidates (CareerBuilder)
- 36% of workers and nearly half of Millennials would consider quitting a job that didn’t provide learning opportunities (Docebo)
- 70% of staff members would be at least somewhat likely to leave their current organizations and take a job with one that is known for investing in employee development and learning (The Harris Poll)
- Among employees who left their previous job, 34% said finding a new job with more career development opportunities spurred them on (The Harris Poll)
- Career development ranked 2nd to compensation as the reason employees left their organizations (The Harris Poll)
- When Millennials jump ship, it’s most often because they feel underutilized and stagnant at work (O.C. Tanner)
- Current Employee Retention & Engagement Statistics
- Generation Gap
- Longer-Term
- Continuous upskilling and digital dexterity will outweigh tenure and experience.
The most highly valued work will still be cognitive in nature. Employees will have to apply creativity, critical thinking and constant digital upskilling to solve complex problems. Going forward, workers will need to change their skills at an accelerating pace. - Smart machines will be our co-workers. Artificial Intelligence (AI) will permeate the work landscape. Smart machines are getting smarter and more ubiquitous, not only completing tasks previously reserved for humans, but also what was thought to be impossible for machines.
- The use of automated kiosks is becoming more prevalent. We now check-in at the airport, doctor’s office and cell phone stores while handling our own check out at the big box retailers. A recent kiosk census report indicates there will be record growth for the interactive kiosk industry ‘as consumers continue to embrace self-service technology and businesses rush to reap the benefits of improved customer engagement.' The most promising technologies include touchscreens, integration with mobile devices, and remote machine management. This transition to increasingly using kiosks and working with collaborative robots, or “cobots”, means continued demand for skilled manufacturing and technician workers such as fabricators, tool & die and mold building.
- The federal Government Accountability Office (GAO) projects that the top three occupational groups to decline due to the adoption of advanced technologies between 2016 and 2026 will be Production (40 occupations), Office and Administrative Support (30 occupations), and Transportation and Material Moving (10 occupations).
- With data analytics and AI-enabled tools striving to create decision-making as prejudice-free as possible, a mature conversation on diversity appears to be a quickly evolving trend. More companies today are coming forward to recognize the need for proper diversity education and not just sensitization. With that, the dialogue has shifted from having a laundry list for diversity and inclusion (DI) initiatives to more meaningful and actionable plans that could actually make a difference.
- Talent Mobility
- Employees are now choosing among jobs based on the level of work flexibility offered. As an increasingly important parameter for job- decisions, talent mobility will drive the quality of employee engagement, as well as the overall quality of the workforce. “This is a trend that shows no signs of stopping. Thirty-eight percent of hiring managers predict that their employees will work predominantly remotely in the next ten years,” says Zoe Harte, Senior Vice President, Human Resources and Talent Innovation, at Upwork.
- Illinois is part of a National Governors’ Association on-demand workgroup exploring and working to define the on-demand world (e.g.: platform workers, day-laborers, self-employed and independent contractors), and determine their needs and gaps of these workers, such as lack of worker protections and access to training. As part of this initiative, Illinois is currently working to define this population in Illinois and to develop innovative methods for them to access training to move into more sustaining work.
- Two potential growth sectors that are just now emerging in Illinois are in Information Technology and Agriculture:
- There is an uptick in cyber-security training, which, although small, may continue to grow as increasing numbers of security breaches occur across many sectors.
- With the legalization of industrial hemp production and the legalization of cannabis, we could see growth in the agricultural sector and the need for workers in both the agricultural side and the dispensary side. Both areas require short-term training at the entry level.
- Continuous upskilling and digital dexterity will outweigh tenure and experience.
Gov. Pritzker’s Action Agenda to EO 3 recognizes this challenge and weaves throughout the Unified State Plan Illinois’ priority for revitalizing economic growth in the rapidly changing labor market and creating economic opportunity in communities across the state emphasizing disenfranchised populations. As education and workforce professionals, these trends will impact the services provided to these vulnerable populations. It will be incumbent upon them to create innovative solutions that will address barriers to employment and look at different educational models, such as shortening the time from credential attainment to employment. State approaches in Illinois will support these efforts by creating cross-cutting goals through common definitions, such as the career pathways dictionary framework and the service integration policy. These not only focus on the breakdown of silos but place importance on the use of current labor market information to provide career services to job seeker and employer customers.
Trends Across Key Industry Sectors & Occupations
Between 2008 and 2018, employment shifts occurred among U.S. industry sectors, featuring a reduction in goods-producing industries in favor of service-producing industries. This shift continued a long-term trend, with manufacturing employment declining due to strong productivity gains in high value-added industries and offshoring of low value-added production to lower-cost economies. But not all service-producing sectors saw equal employment growth during this ten-year span.
Among goods-producing industries in the U.S., mining and logging was the only sector in which employment held its own between 2008 and 2018. Maintaining this level of employment is primarily due to the oil production sector, which includes “fracking”. The share of construction employment has continued to decline in part because the housing industry has not yet completely recovered from the last recession. Manufacturing employment has decreased as a share of total employment in 2018 relative to 2008 because of the continuing structural shifts in the economy.
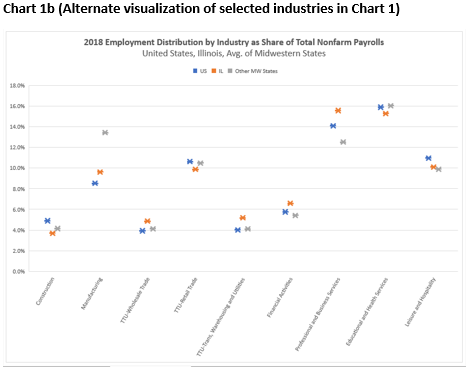
Table 11 shows the industry employment distribution of the U.S. and the Midwestern states. Aside from Kentucky, every state in the region has a smaller proportional share than the U.S. for mining and logging. This industry is relatively small in the remaining states. The construction industry shows that the U.S. has a higher proportional share of employment than all Midwestern states, except Iowa, which equals the nation at 4.9 percent. This is due in part to greater population growth in the nation relative to Midwestern states. The share for construction did increase over the last ten years for Iowa, Michigan, and Minnesota.
Manufacturing is still an important component of the Midwestern economy, even though the long-term trends of increased productivity and offshoring to low-cost economies have led to the loss of many manufacturing jobs. Midwest manufacturing employment accounts for more than a quarter of national manufacturing employment. A decrease was seen in the employment share for the U.S. (-1.3 percent) and all of the Midwestern states, except Michigan between 2008 and 2018. Illinois manufacturing employment declined 1.4 percent over the 10-year period. All of the Midwestern states had a higher share of manufacturing employment than the U.S. (8.5 percent) in 2018.
The share of employment in Transportation, Warehousing and Utilities increased to 5.2% in Illinois, 1.2 points higher than the United States and 1.9 points higher than the average of the other Midwestern states. In the region only Kentucky, at 5.9%, has a higher share of its workforce in this sector than Illinois.
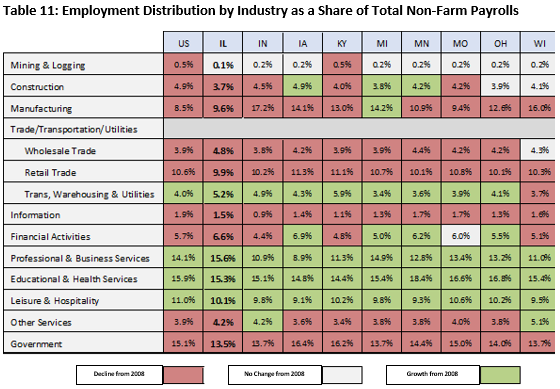
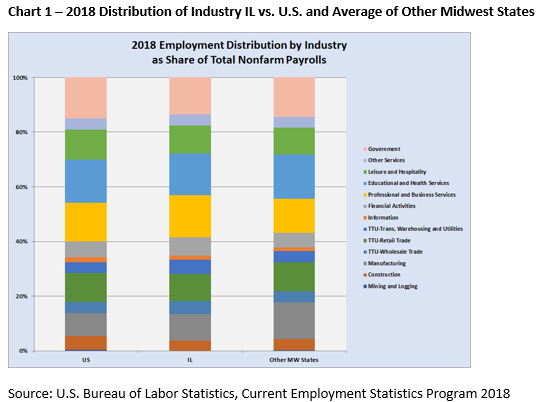
Charts 1 and 1b, based on Table 11, provide a graphic representation of this analysis.
Charts 2-4 show how the industry distribution has changed over the last decade, with data shown for 2008, 2013 and 2018.
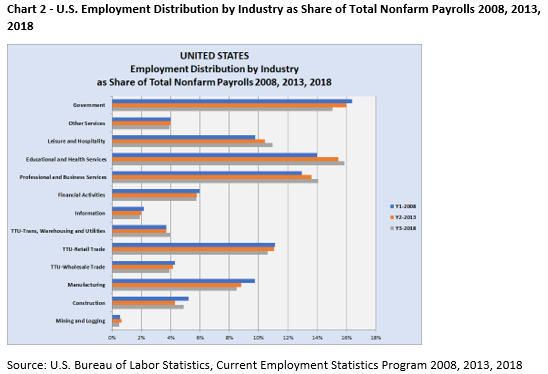
In the United States, the employment distribution changed between 2008 and 2018 with increases in Educational & Health Services, Leisure & Hospitality, and Professional & Business Services, and declines in Government and Manufacturing.
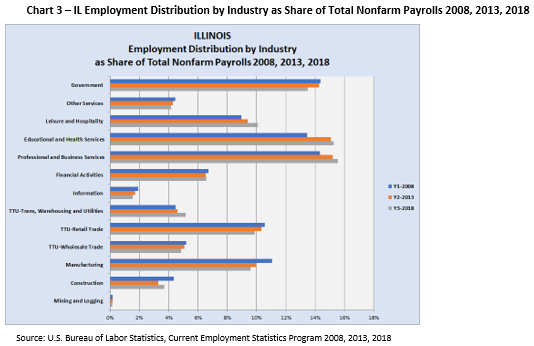
In Illinois, the employment distribution changed between 2008 and 2018 with increases in Educational & Health Services, Professional & Business Services, and Leisure & Hospitality and declines in Manufacturing and Government.
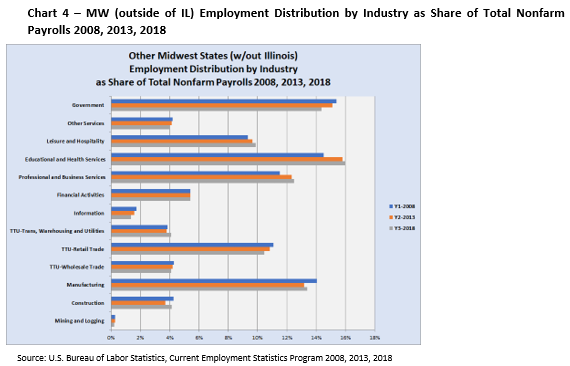
In other Midwest states, the employment distribution changed between 2008 and 2018 with increases in Educational & Health Services and Professional & Business Services, and a decline in Government.
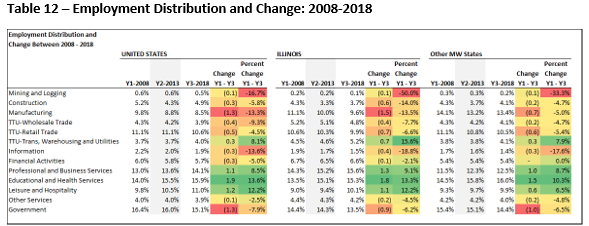
Table 12 adds data from 2008 and 2013 to Table 9 to give a side-by-side view of employment distribution at three different points in time, 2008, 2013 and 2018, at the national and state levels, and in the other Midwest states, to show how the employment distribution has changed over time and how these shifts in Illinois differ from the US and other Midwest states.
The Change Y1 – Y3 columns indicate the change in the sector’s share of the total between 2008 and 2018. A positive number indicates the share of total employment increased and a negative number indicates the sector’s share of total employment declined.
In most cases the trends align at all three geographic levels except for the following significant outliers:
- Illinois increase greater than US and Midwest:
- TTU-Transport/Warehouse/Utilities - the share increase in Illinois changed at just over double the rate of the US and Midwest
- Illinois decrease greater than US and Midwest:
- Construction - Despite construction employment growth in Illinois, the share of jobs in construction as a percent of the total fell in Illinois more so than in the US and Midwest states.
- Manufacturing - the share decrease in Illinois was in line with the US; but the 1.5-point drop in Illinois represents a -13.5% change while the 0.7-point drop in the other Midwest states represents a decrease of just -5.0%.
This means that over the past ten years, when compared to changes in the US and Midwest, in Illinois the share of employment in Transportation, Warehousing and Utilities increasedmore, while the share of employment in Manufacturing and Mining & Logging decreasedmore in Illinois.
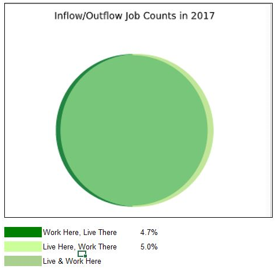
Commuting Workers
The US Census Bureau, not the DOL Bureau of Labor Statistics, is the keeper of data on where people live and work. This data is sourced through census data and tax data housed at the Internal Revenue Service. The most recent worker inflow / outflow data available is for 2017, and it indicates Illinois is near equilibrium for cross-border workers. Of approximately 6 million workers, 4.7 percent work here but live elsewhere, while 5.0 percent live here but work elsewhere. Almost the same numbers of people commute into Illinois for work as go to their jobs in other states. So, the overall net impact of cross-border workers is minimal.
Inflow/Outflow Chart 1
A deeper analysis of worker inflow and outflow data indicates the vast majority of cross-state employment involves workers aged 30 - 54, earning more than $40,000 annual wages working in non-goods producing, services industries. Generally, the inflow and outflow by worker type follows a similar pattern - the items with the largest inflow also have the largest outflow. However, there are types with a bit of wider margin, notably workers under age 29 and workers earning less than $15,000 per year and workers in the Other Services industry class have greater outflow than inflow.
Inflow/Outflow Table 1

iii. Education and Skill Levels of the Workforce
Occupational skill requirements are increasing across the workforce due to a number of factors, including the increasing pace of technological change and the increasingly global nature of the economy. As detailed in the previous section, (“Labor Market Trends”) expectations are that creativity and critical thinking will join digital dexterity at the very apex of skill needs across the labor force. Technology-fueled economic forces, such as automation, Artificial Intelligence and deep data analytics will continue to supplant human muscle and (increasingly) human intelligence.
As a recently released McKinsey Global Institute report puts it, “Millions of jobs (nationally) with a high share of automatable tasks could be phased out in the decade ahead. Others will be created, more than making up for those losses in many scenarios— although they may be different occupations located in different places”8 (emphasis ours). Add to this the increasing desire (and need) for talent mobility, both geographically and occupationally, and the pressures upon a state like Illinois to educate, train and fully employ its workforce is more critical than ever.
In its most recent set of occupational employment projections, the BLS shows the increasing need for advanced education and training to qualify for occupations with the highest growth rates.
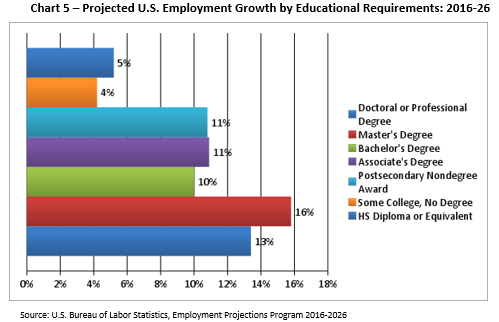
Growth is highest for entry-level jobs requiring education or training credentials beyond high school. Moreover, the education and skill requirements of occupations are directly related to the earning power of those occupations, as evidenced by Illinois’ data from the 2018 American Community Survey.
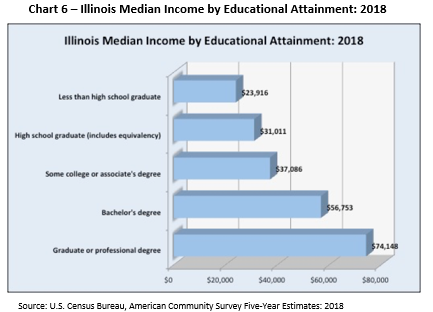
These data sets highlight the importance and the value of educational achievement and degree attainment. For Illinois to compete in this globalized, technology-charged economy, we must train our workforce to meet the challenges of these increasing education and skill requirements. Since the turn of the century, Illinois has made progress in increasing the overall educational attainment of its population. However, the number of individuals with low literacy skills has remained a significant concern as we seek to meet the demand for an educated and skilled workforce.

The percentage of Illinois’ population (age 25+) with some type of post-secondary degree increased from 32% in 2000 to over 42% in 2018. However, this number is still too low. Illinois has committed to ensuring that 60% of the state’s population has a high-quality degree or credential by 2025, an initiative referred to as “60 by 2025.” As these data show, the state is clearly moving towards that goal, but there is still a long way to go in the next decade. Illinois’ continued economic and income growth is dependent on reaching the “60 by 2025” goal.
Chart 8 and Table 13, which follow, show data regarding the incidences of various target population cohorts in Illinois. Target populations, as described in TEGL 19-16, are as follows in the capture excerpt below.
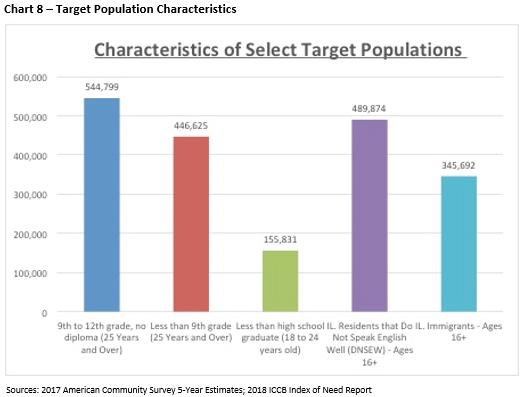
In Illinois, approximately 700,000 people have some high school education but do not have a diploma, and nearly 450,000 people have less than a 9th-grade education. These individuals could benefit from a variety of workforce and adult education programs, especially bridge programs that incorporate English, reading and math skills contextualized for a targeted industry.
Table 13 provides information on the sub-populations that may have barriers to employment and are targeted to be served by one or more of the WIOA core programs. These data, where available, will be provided at the regional level for utilization in developing, aligning and integrating service delivery strategies as well as resources in each region. Data were sourced from a variety of national collections and Illinois-specific administrative data systems.
Table 13 – Target Population Characteristics
| Total Civilian Noninstitutionalized Population 2018 Estimate (U.S. Census Quick Facts) | 12,741,080 |
| Low-Income Indicators: Adults (Age 16+) in Poverty 2017 (ICCB Index of Need table 6) | 1,130,946 |
| Public Aid Recipients 2017 (ICCB Index of Need table 3) | 3,010,986 |
| Adult Public Aid Recipients 2017 (ICCB Index of Need table 3) | 1,660,857 |
| TANF Recipients Monthly Average 2017 (IDHS online) | 63,860 |
| SNAP Recipients Monthly Average 2018 (IDHS online) | 1,797,882 |
| Estimated Individuals with a Disability 2017 (American Community Survey table S1810) | 1,388,827 |
| Adults with Disabilities (age 18-75+) 2017 (American Community Survey table S1810) | 1,290,787 |
| DHS Division of Rehabilitation Services‐Vocational Rehabilitation Program Data Summary FY2019: | |
|---|---|
| Number Served (Age 25+) | 17,851 |
| Number Served Youth (Age <25) | 28,819 |
| Number in Plan Status (Age 25+) | 5,270 |
| Number in Plan Status Youth (Age <25) | 15,681 |
| Successful Employment (Age 25+) | 2,472 |
| Successful Employment Youth (Age <25) | 2,647 |
| IDHS Prioritization of Urgency of Needs for Services (PUNS) Reports ‐ Summary by Diagnosis Code as of August 2019 (Active counts of residents with disabilities in potential need of DHS-funded services) (DHS online): | |
| Autism | 5,834 |
| Childhood Disintegrative Disorder | 58 |
| Pervasive Developmental Disorder | 251 |
| Cerebral Palsy | 611 |
| Mild Intellectual Disability | 3,520 |
| Moderate ID | 2,724 |
| Severe ID | 821 |
| Profound ID | 333 |
| Unspecified Intellectual Disability | 8,761 |
| Epilepsy | 1,145 |
| Other Diagnosis Codes | 507 |
| Adult Parolee Population, June 30, 2017 (DOC online) Youth in Aftercare Population, April 2019 (DJJ online) | 25,974 843 |
| Population in Households in which English is not the Primary Language Spoken 2017 (ICCB Index of Need table 5) | 2,796,360 |
| Average Annual Unemployed 2018 (Current Population Survey) | 321,909 |
| Estimated: Unemployed 27+ Weeks 2018 (Current Population Survey) | 69,854 |
| Older Individuals (Age 55+) 2017 (American Fact Finder) | 3,483,291 |
| Homeless Individuals 2018 Estimate (U.S. Interagency Council on Homelessness) Unaccompanied Young Adults (Age 18-24) | 10,643 684 |
| Single Parents 2017 (American Community Survey table B09002) | 777,109 |
| Migrant and Seasonal Farm Workers - 2019 Domestic & WIOA-Eligible (IDES) | 613 |
| Veterans – Estimate 2017 (American Community Survey table S2101) Total Age 18-34 Age 35-54 Age 55 and over | 614,725 48,120 134,292 432,313 |
| Total in Foster Care 2019 (DCFS web): | 14,564 |
| Department/Private/Fictive Foster Care | 5,821 |
| Relative Foster Care | 8,933 |
| Institutional/Group Care | 1,337 |
| Exiting Foster Care (Age 18+) | 896 |
iv. Skill Gaps
Gov. Pritzker’s Action Agenda to Executive Order 3 describes skills gap as arguably Illinois’ most serious barrier to economic prosperity. Building a pool of job seekers and workers with the right skills at the right time is essential if Illinois businesses and workers are to compete in the global economy today and in the future. All three of the action areas that frame his workforce development agenda recognize the importance of investing in skill development that supports regional cluster strategies, prepares Illinois workers for careers in high-demand industries and shortens the time required to connect skilled workers with available employment opportunities.
Table 14 identifies the top 10 occupations with the greatest number of projected annual openings grouped by educational attainment requirements, along with average entry-level and mid-career level Illinois wages.
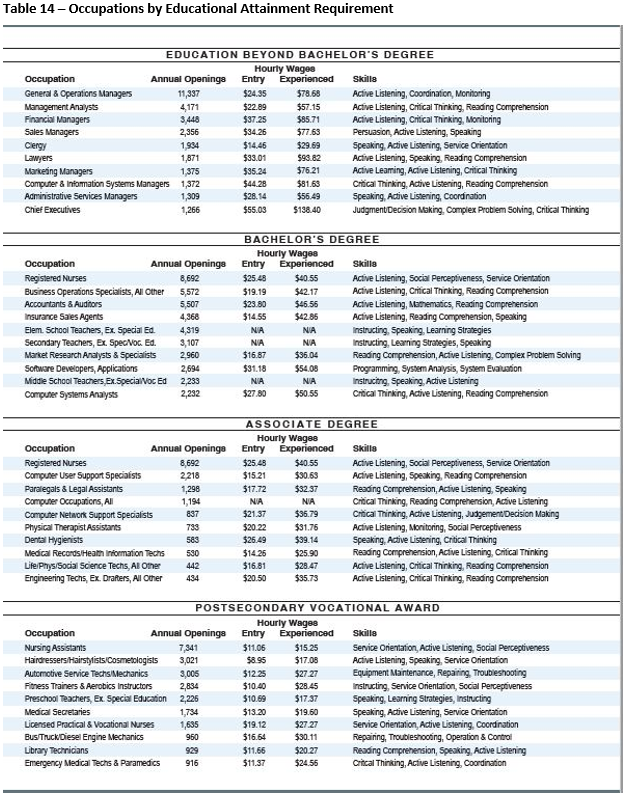
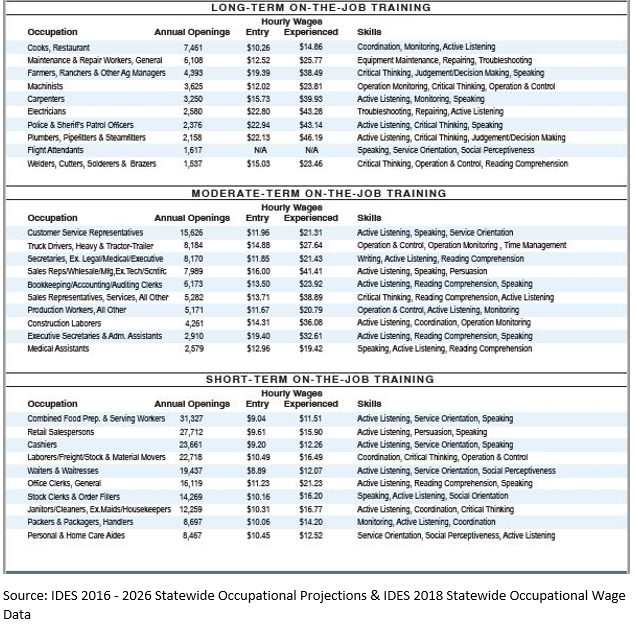
Using the list of occupations in Table 14, an analysis of academic year 2017 (the most recent available) program of study completers in Illinois indicates a clear trend - the higher the required level of education the more likely the occupations on the list have more completers in programs tracked by the Illinois Board of Higher Education (IBHE) and the Illinois Community College Board (ICCB). Conversely, the shortfall gap between projected annual openings and the number of completers widens as the level of required credential decreases. This is partially due to some training programs at those levels not reporting data to IBHE or ICCB, some training is primarily via apprenticeships, and some are truly done on-the-job, largely foregoing formal classroom training.
The following charts indicate the Gap Ratio for each of the occupations in Table 14 for which there is completer data provided by ICCB and IBHE. The Gap Ratio is a proxy measure that indicates potential oversupply or undersupply of workers for a given occupation. Readers are cautioned to consider:
1) annual completers are not the entire available supply of workers. For example, trade
apprenticeships are not captured by IBHE and ICCB unless the trainee is enrolled in a
post-secondary institution, nor are skilled unemployed workers; and
2) the crosswalk between codes in
the Classification of Instructional
Programs (CIP) and Standard
Occupational Classification (SOC)
data sets is not exact.
A Gap Ratio value of 1.0 indicates the number of completers equals the number of projected annual openings. A value less than 1.0 indicates a potential undersupply and values more than 1.0 indicate a potential oversupply.
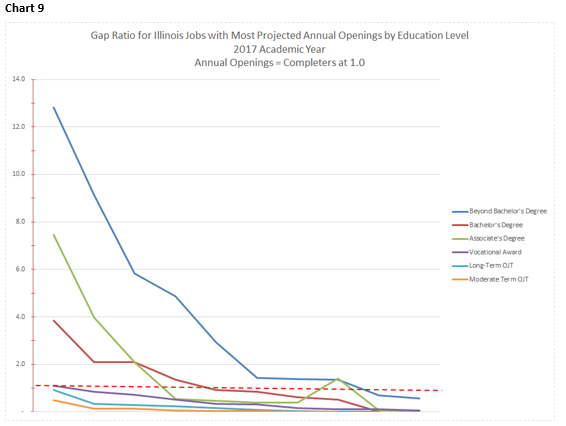
Chart 9 highlights that the top occupations for each level of education tend to have a greater shortage of completers as the required education level decreases. Note that at the lowest two levels, long-term and moderate-term OJT, none of the top occupations reach 1.0. – the point where the number of completers equals the number of annual openings. This is driven to a large extent by fewer training programs available (which limits the number of graduates) due to the hands-on training traditionally used for many of the occupations.
Eight of the top ten occupations have a surplus of completers, with five occupations having three or more times the number of projected openings.

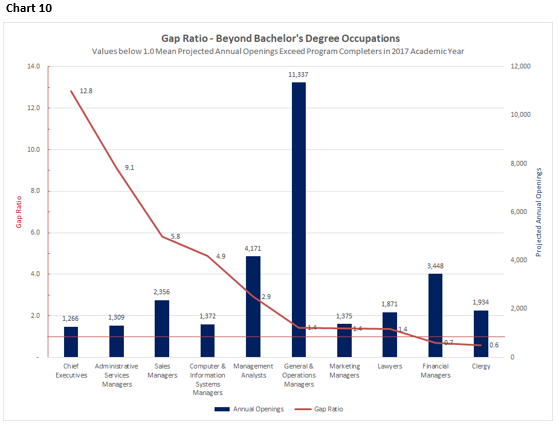
The data for occupations requiring a bachelor’s degree yields some interesting observations.
- There is a generally accepted consensus that we have a national and statewide teacher shortage. However, for secondary education teachers, that cannot be attributed to a lack of people graduating from education programs. The most likely explanation is that many graduates from secondary education programs do not seek employment as teachers and elect to either continue their education or enter a non-education related career pathway. If secondary, middle school and elementary teachers are combined, the gap ratio for all three occupations is 1.7.
- The programs of study and demand for registered nurses cut across educational levels (bachelor’s and associate’s degrees) which counts the same jobs and completers across different educational levels and points out a limitation of the data. Similar to the secondary education gap ratio, the raw data indicate a sufficient number of program completers to meet the demand for registered nurses. Regional shortages are likely driven by program completers not entering the job market due to pursuing additional education or by entering employment in another state.
- The apparent shortage for Insurance Sales Agents is mainly attributable to there being very few programs of study specific to this occupation. While many insurance agents have a bachelor’s degree, all agents have licensing requirements, and educational institutions typically do not offer education or training related to licensure testing. The data indicates there were 35 graduates of insurance sales education or training statewide in the 2018 academic year.
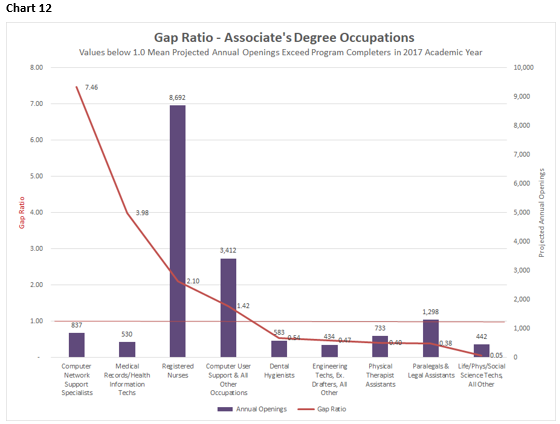
For the Associate’s Degree chart, note that the projected openings for registered nurses is the same as that shown in the Bachelor’s Degree chart. This is due to the programs tied to nursing being co-mingled. Other than this anomaly, the chart indicates the number of completers for Computer Network Support Specialists and Medical Records/Health Information Technologists is in excess of the annual openings.
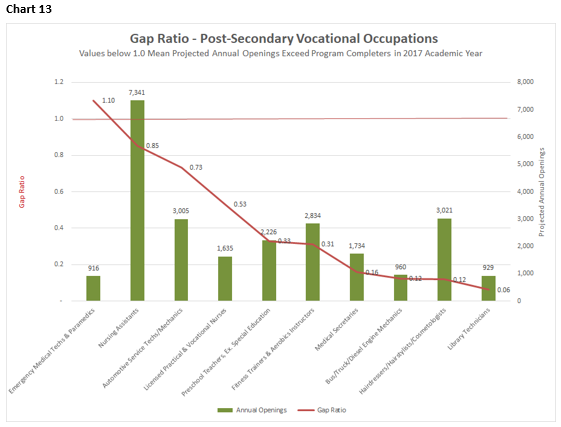
Caveats to consider for Post-Secondary Vocational Occupations include:
- The number of completers for the top ten occupations in terms of projected openings is less than the demand. While completers do not make up the entire supply pool, the occupations with gap ratios of 0.5 or less are very likely to be experiencing a significant shortfall of skilled workers.
- There is a very high attrition / turnover rate for Nursing Assistants, which elevates the number of annual openings for this occupation. Note the gap ratio indicates there are a significant number of completers. This is partially due to nursing assistant training being a prerequisite for registered nurse education. In some regions of Illinois, the high number of applicants for nursing assistant training creates a barrier for access to registered nursing training. Registered Nursing schools and employers should jointly consider a combination of strategies to simultaneously manage: 1) ensuring adequate access to training for individuals in the registered nurse pathway while also, 2) not creating a larger shortfall of nursing assistants who are in high demand and hospitals and long-term care facilities. Strategies to meet the projected demand for this occupation must include a thorough understanding of the root causes to develop effective measures to reduce the attrition rate.
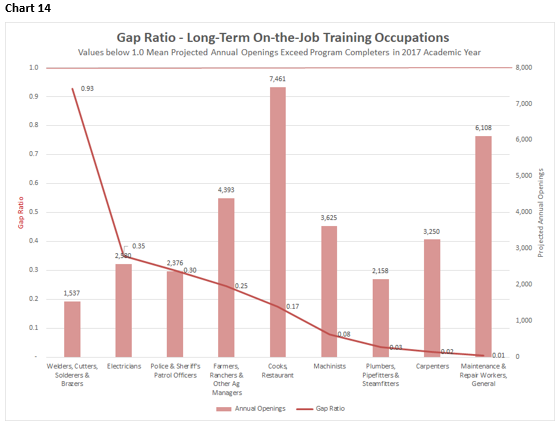
As mentioned previously, there are education and training programs available in addition to those reporting through the IBHE and the ICCB, thus the supply shown on the long-term OJT chart is likely understated.
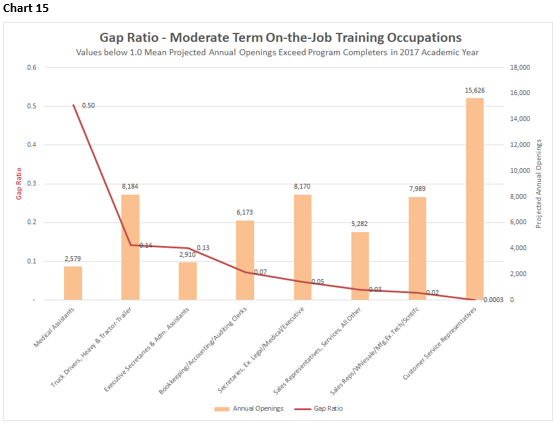
Again, there are education and training programs available in addition to those reporting through the IBHE and the ICCB, thus the supply shown on the moderate-term OJT chart is also likely understated.
7The reader is cautioned the margin of error for this data set varies widely and can be significant. For example, in 2018, the margin of error for inflow was 6% and 29% or 87,200 for the estimated outflow of 305,600. The reader is cautioned to use this data for providing overarching context and not become fixated on the exact numbers.