



Located in:
- II. Strategic Elements
The Unified or Combined State Plan must include a Strategic Planning Elements section that analyzes the State’s current economic environment and identifies the State’s overall vision for its workforce development system. The required elements in this section allow the State to develop data-driven goals for preparing an educated and skilled workforce and to identify successful strategies for aligning workforce development programs to support economic growth. Unless otherwise noted, all Strategic Planning Elements apply to Combined State Plan partner programs included in the plan as well as to core programs. Where requirements identify the term “populations”, these must include individuals with barriers to employment as defined at WIOA Section 3. This includes displaced homemakers; low-income individuals; Indians, Alaska Natives, and Native Hawaiians; individuals with disabilities, including youth who are individuals with disabilities; older individuals; ex-offenders; homeless individuals, or homeless children and youths; youth who are in or have aged out of the foster care system; individuals who are English language learners, individuals who have low levels of literacy, and individuals facing substantial cultural barriers; farmworkers (as defined at section 167(i) of WIOA and Training and Employment Guidance Letter No. 35-14); individuals within 2 years of exhausting lifetime eligibility under the Temporary Assistance for Needy Families program; single parents (including single pregnant women); and long-term unemployed individuals. Additional populations include veterans, unemployed workers, and youth, and others that the State may identify.
- a. Economic, Workforce, and Workforce Development Activities Analysis
The Unified or Combined State Plan must include an analysis of the economic conditions, economic development strategies, and labor market in which the State’s workforce system and programs will operate.
- a. Economic, Workforce, and Workforce Development Activities Analysis
II. a. 1. A. Economic Analysis
The Unified or Combined State Plan must include an analysis of the economic conditions and trends in the State, including sub-State regions and any specific economic areas identified by the State. This must include—
i. Existing Demand Industry Sectors and Occupations
Provide an analysis of the industries and occupations for which there is existing demand.
ii. Emerging Demand Industry Sectors and Occupations
Provide an analysis of the industries and occupations for which demand is emerging.
iii. Employers’ Employment Needs
With regard to the industry sectors and occupations identified in (A)(i) and (ii), provide an assessment of the employment needs of employers, including a description of the knowledge, skills, and abilities required, including credentials and licenses.
Current Narrative:
Florida’s economic and workforce analysis describes labor market information for Florida’s economic, industry, and occupational profiles as they pertain to employment and workforce development.
Part A: Economic Analysis provides an overview of Florida’s economy, including existing demand industry sectors and occupations, emerging demand industry sectors, and occupations and employers’ needs.
Part B: Workforce Analysis is a detailed analysis of Florida’s workforce, including data on employment and unemployment, labor market trends, education, and skill levels of the workforce and a comparison of economic and workforce analytical conclusions. This section includes existing demand and projected trends in industries and occupations.
Industry is the type of activity conducted at a person’s place of work. Occupation is the kind of work a person does. Each worker is part of an industry and an occupation. It is important to consider that occupations often cut across industries. For example, maids and housekeepers can be found in accommodation and food service industries, healthcare and social assistance, and administrative and support services, among other industries.
A. Economic Analysis
(i) Existing Demand Industry Sectors and Occupations. Provide an analysis of the industries and occupations for which there is existing demand.
Nonagricultural Employment by Industry
As of July 2023, the industry supersectors employing the most workers were primarily service-providing industries. Trade, Transportation, and Utilities had the largest share of employment (1,984,300 jobs), followed by Professional and Business Services (1,644,800 jobs), Education and Health services (1,486,500 jobs), and Leisure and Hospitality (1,306,200 jobs). Education and Health Services (+6.4%) and Leisure and Hospitality (+4.2%) were the fastest-growing major industries over the year.
In July 2023, Florida had the third-fastest year-over-year growth rate (+3.2%) in total nonagricultural employment among all 50 states, trailing only Nevada (+3.8%) and Texas (+3.3%).
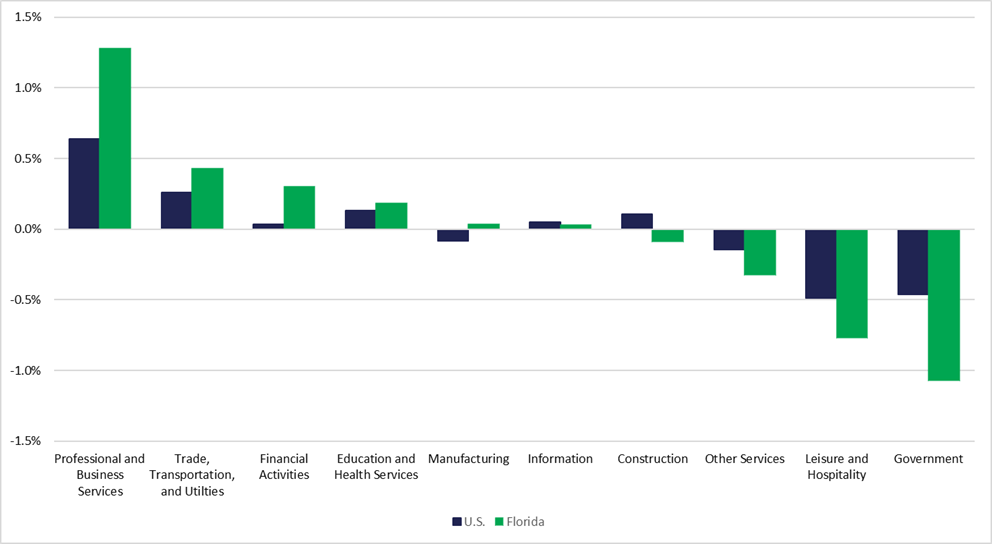
From February 2020 to July 2023, Florida’s employment, as a share of total nonagricultural employment, has been shifting more toward Professional and Business Services (+1.3%); Trade, Transportation, and Utilities (+0.4%); and Financial Activities (+0.3%). Employment has been shifting away from Government (-1.1%); Leisure and Hospitality (-0.8%); and Other Services (-0.3%).
Figure 2.01
Change in Industry Composition – Total Nonagricultural Employment, Seasonally Adjusted – Florida and United States; February 2020 – July 2023
Source: Florida Department of Commerce, Bureau of Workforce Statistics and Economic Research (WSER), Current Employment Statistics, November 2023.
The industry supersectors projected to add the most jobs by 2030 are Education and Health Services (+243,380; +12.72%), Professional and Business Services (+193,910; +12.86%), and Leisure and Hospitality (+138,434; +11.05%).
Figure 2.02
Florida Projected Employment Growth by Industry Supersector

Source: Florida Department of Commerce, Bureau of Workforce Statistics and Economic Research, Occupational and Industry Employment Projections 2022-2030.
Industry Detail
The Industry Detail section shows employment in the major industry sectors over time. The analyses depict impacts of recessions on each industry and current trends. Recessions are indicated by gray bars in the graphs below. The calculations in this section are all seasonally adjusted.
Construction
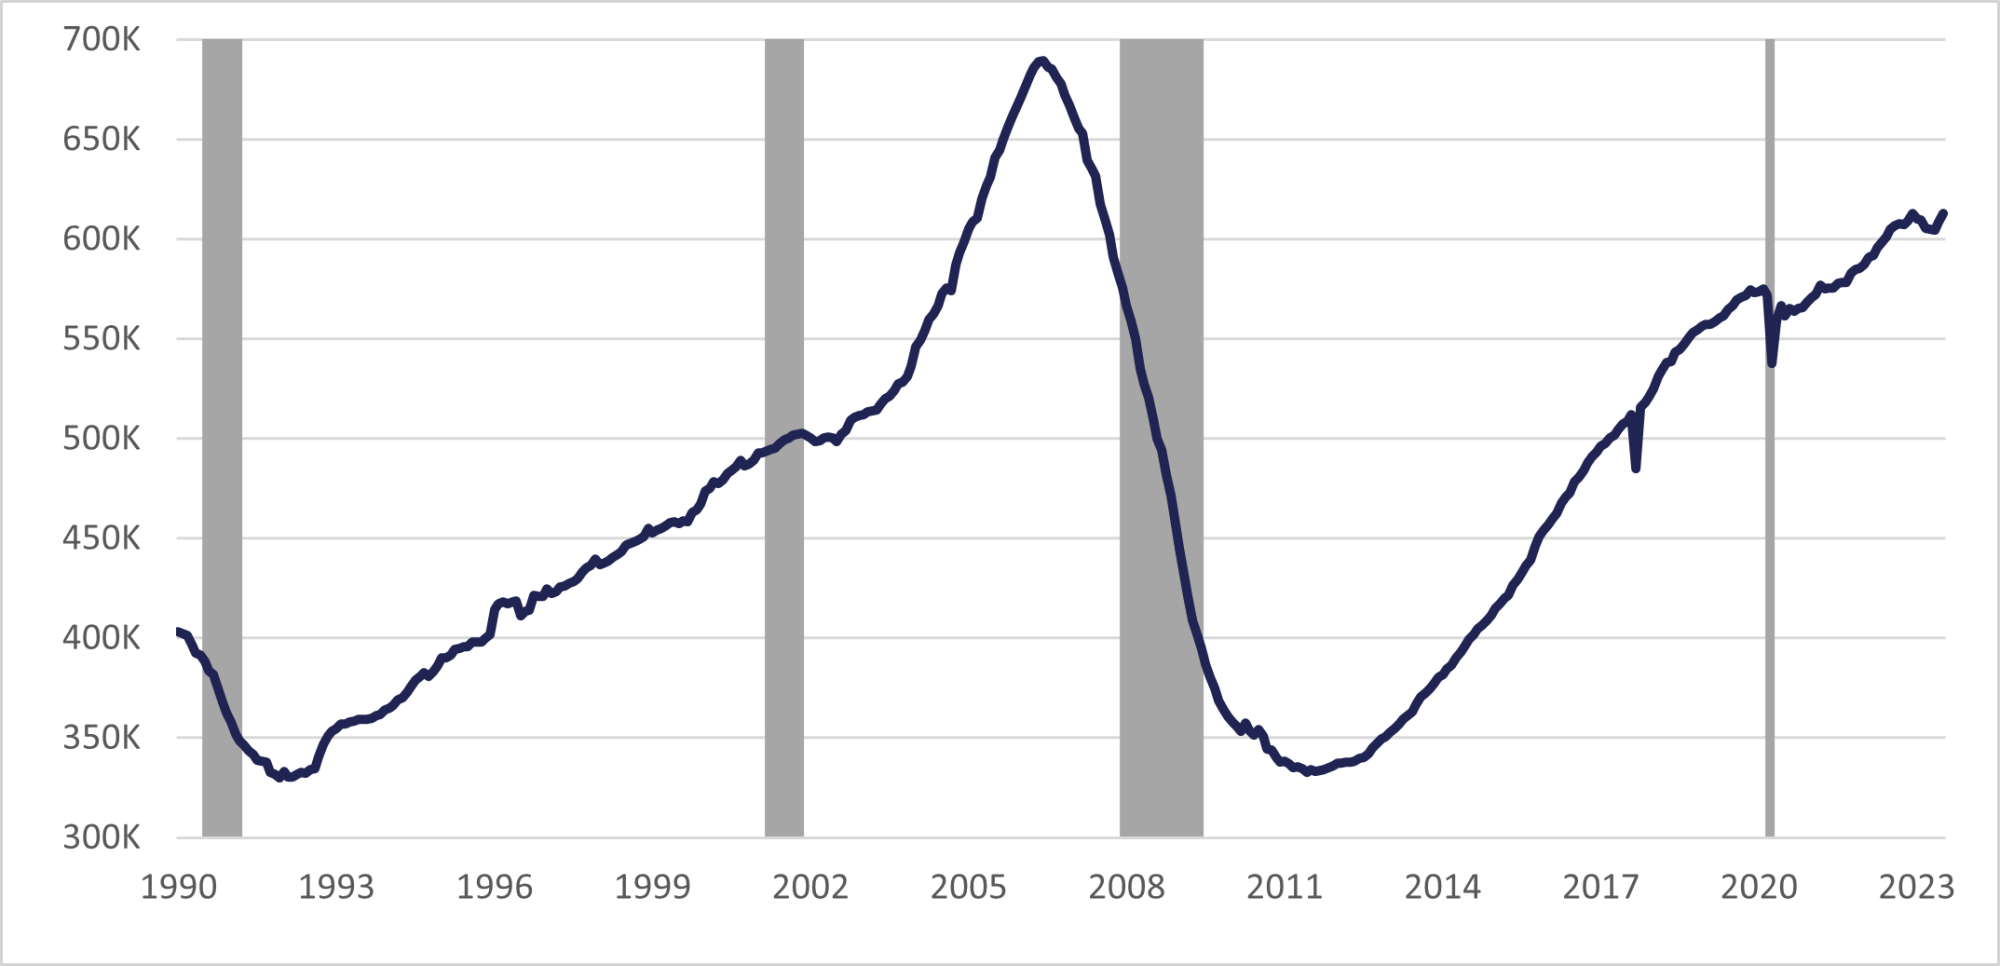
Florida experienced large declines in Construction employment from 2006 to 2011 in the aftermath of the housing bubble collapse. Construction employment peaked in June 2006 at 689,400 jobs and is currently at 612,700 jobs (a decrease of 76,700 jobs). At the low point during this decline, Construction employment was 332,500 (June 2011). Since June 2011, 280,200 jobs in the industry have been recovered.
Figure 2.03
Florida Construction Employment, Seasonally Adjusted
Source: Florida Department of Commerce, Bureau of Workforce Statistics and Economic Research (WSER), Current Employment Statistics, August 2023.
Since the end of the Great Recession, Construction employment was trending upward until the start of the COVID-19 pandemic. Construction employment was 575,100 in February 2020. Florida lost 37,300 Construction jobs from February to April 2020 and has since gained back more than the total jobs lost. As of July 2023, employment in this sector was 612,700, which is 37,600 more jobs than in February 2020 (+6.5%).
Changes in Construction employment during past recessions have generally been greater in Florida than in the U.S., however Florida Construction employment during the pandemic remained more stable than it did across the rest of the nation. Construction is particularly important as a share of employment in Southwest Florida and in particular the region served by local workforce development area 24 (LWDA).
Manufacturing
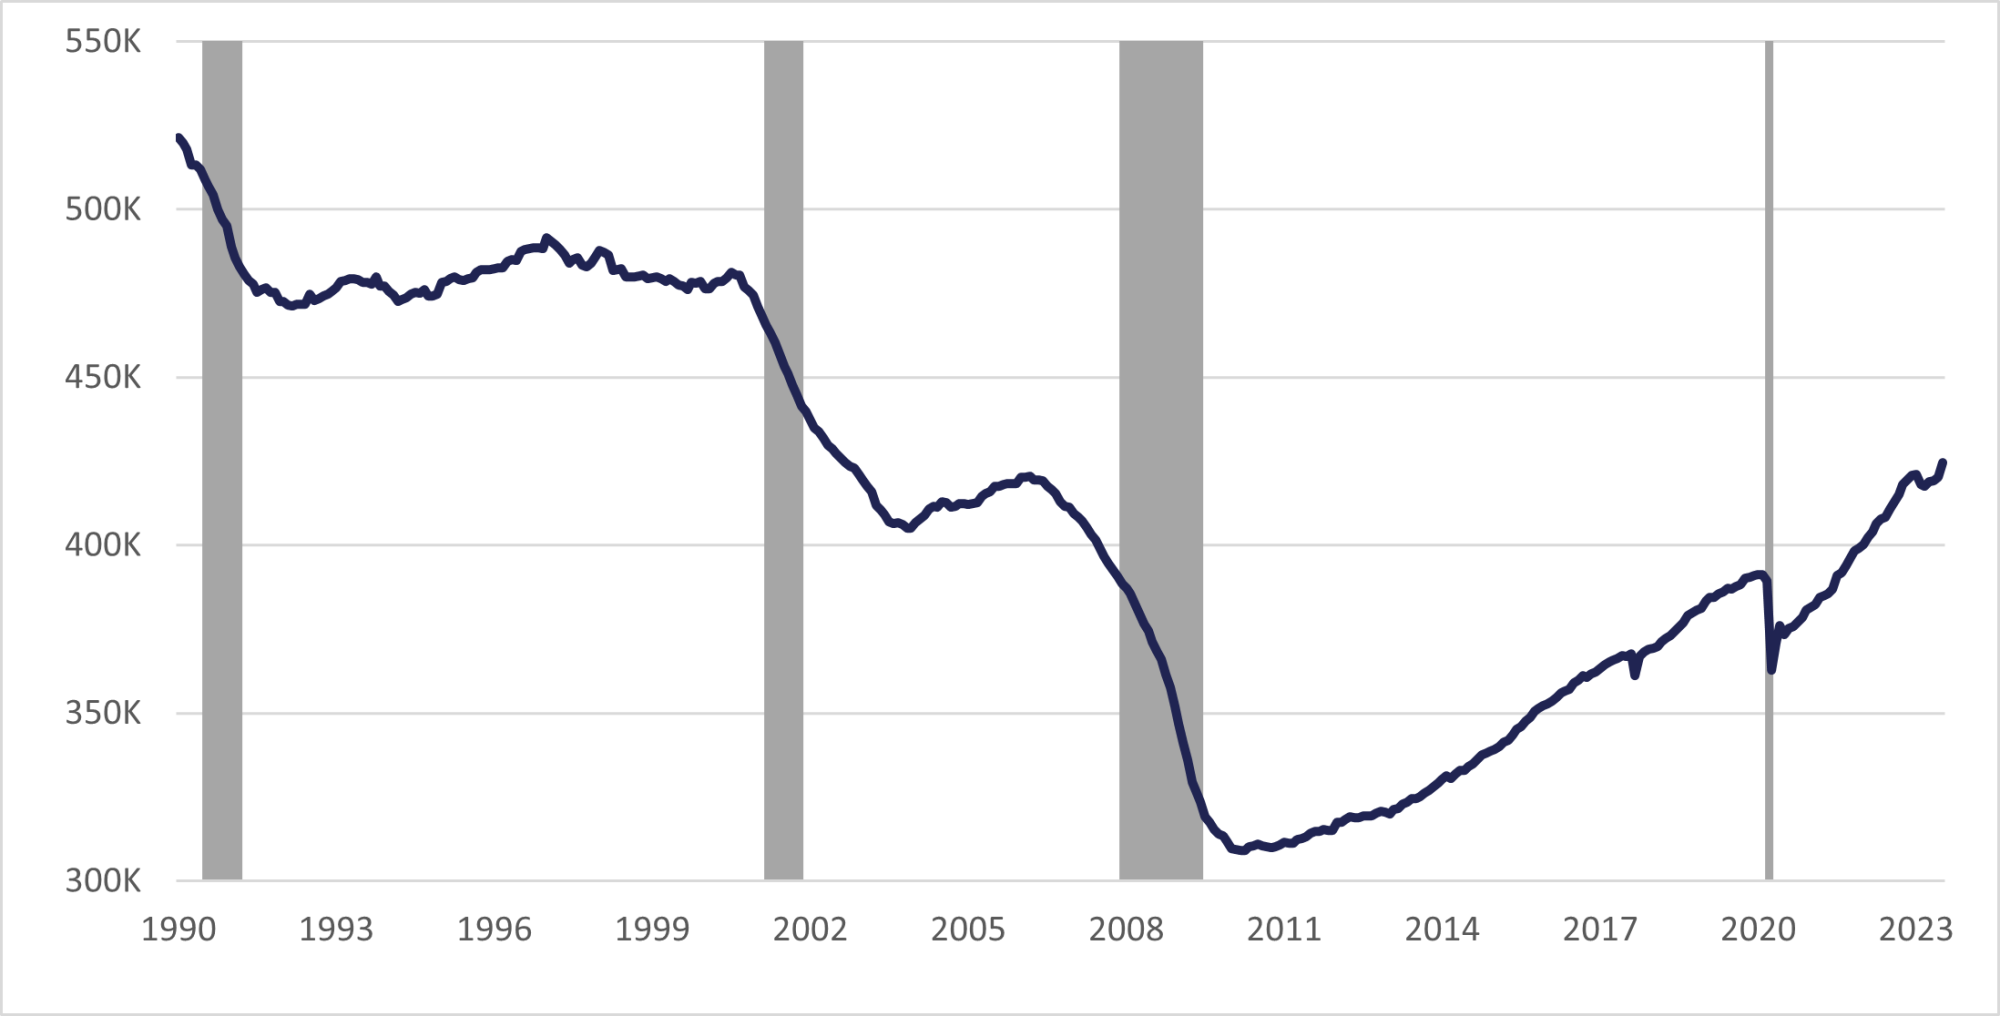
Manufacturing employment had generally been in decline since the 1980s; however, since the low in March 2010 (309,100 employed), the number of jobs in this sector has been trending upward. Florida lost 28,600 Manufacturing jobs from February to April 2020 and has since gained back more than the total jobs lost.
From the low in 2010 until the beginning of the pandemic in February 2020, this industry gained 82,300 jobs, for an annualized growth rate of 2.4% during this period. This industry’s employment was 424,600 in July 2023, which is 61,800 more jobs than the pandemic low point in April 2020 (362,800 jobs). The annualized growth rate since the pandemic low point has been +5.4%, meaning that the upward trend before the pandemic seems to have accelerated post-pandemic. As of July 2023, this industry’s employment was 424,600, which is 33,200 (+8.5%) more jobs than the pre-pandemic level in February 2020.
Figure 2.04
Florida Manufacturing Employment, Seasonally Adjusted
Source: Florida Department of Commerce, Bureau of Workforce Statistics and Economic Research (WSER), Current Employment Statistics, August 2023.
Florida’s pre-pandemic growth in Manufacturing employment tended to be faster than the nation, and the pandemic had less of an effect on the sector in Florida than it did nationwide. Manufacturing accounts for a particularly large share of employment in the North Florida (LWDA 6) and Brevard (LWDA 13) regions.
Trade, Transportation, and Utilities
The strength of this industry reflects the positive impact of tourism and population growth on the Florida economy.
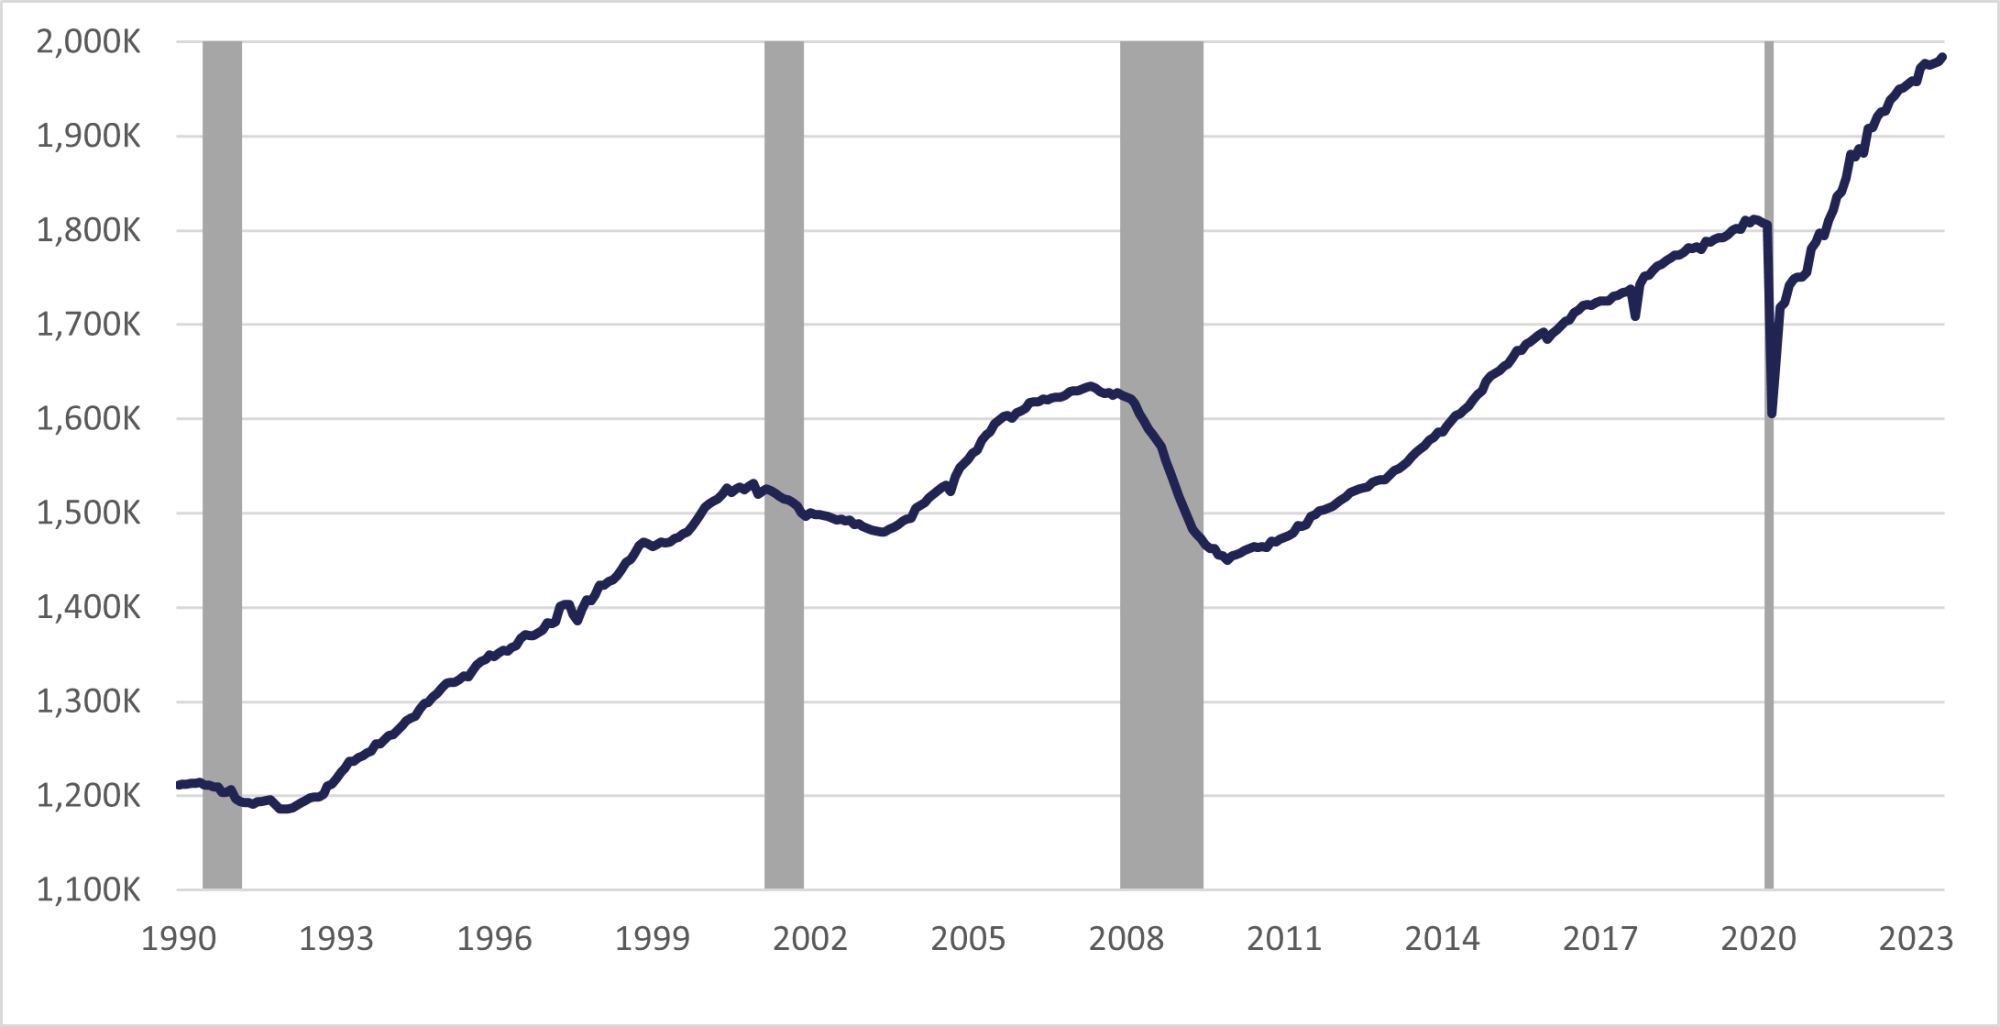
Since the end of the Great Recession, employment in Trade, Transportation, and Utilities (TTU) had been trending upward until the start of the COVID-19 pandemic. TTU industry employment was 1,807,800 in February 2020. Florida lost 202,100 jobs in the sector from February to April 2020 and has since gained back more than the total jobs lost. From January 2018 to January 2019 the year-over-year (YoY) growth rate was 1.8% and from January 2019-2020 the YoY growth rate was 1.3%. This upward trend from before the pandemic seems to have accelerated as the January 2022-2023 YoY growth rate was 4.0%. This industry’s employment was 1,984,300 in July 2023, representing 176,500 more jobs than in February 2020 (+9.8%) and an all-time high.
Figure 2.05
Florida Trade, Transportation and Utilities Employment, Seasonally Adjusted
Source: Florida Department of Commerce, Bureau of Workforce Statistics and Economic Research (WSER), Current Employment Statistics, August 2023.
Information
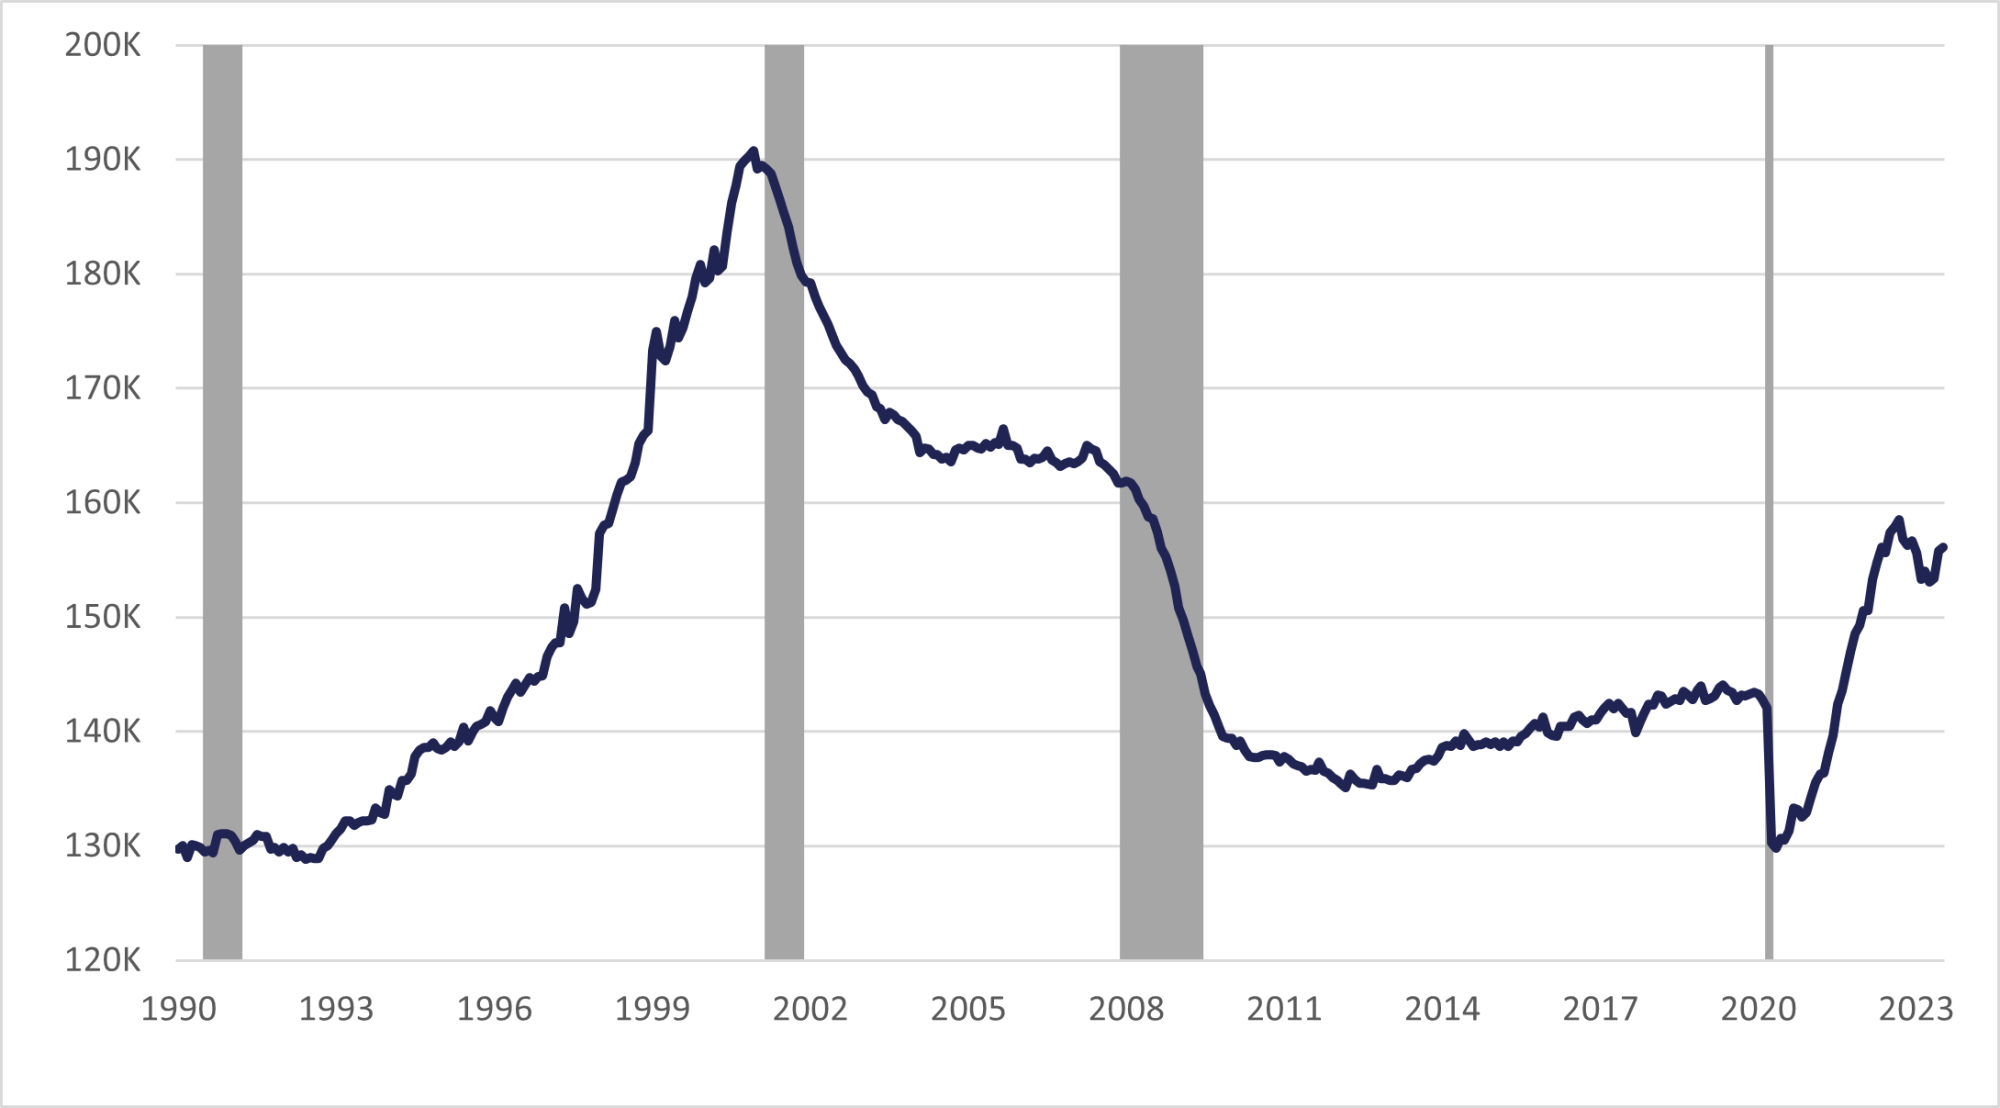
Florida experienced large declines in Information sector employment from 2001 to 2004 after the end of the tech bubble, and from 2007 to 2010 following the collapse of the housing bubble. Industry employment remained relatively stable from the low point after the Great Recession to the pandemic. Since the pandemic, Information industry employment has been trending upward. As of July 2023, the industry employment was 156,100.
Figure 2.06
Florida Information Employment, Seasonally Adjusted
Source: Florida Department of Commerce, Bureau of Workforce Statistics and Economic Research (WSER), Current Employment Statistics, August 2023.
In February 2020, the employment was 142,800. Florida lost 12,500 Information jobs from February to April 2020 and has since gained back more than the total jobs lost. As of July 2023, the employment was 156,100, which is 13,300 more jobs than February 2020 (+9.3%).
Florida’s rate of growth in Information employment has generally mirrored or run slightly below the nationwide rate. However, Florida’s post-pandemic YoY growth rate from September 2021 to October 2022 was 11.0% on average, which was 2.7 percentage points higher than the US average rate of 8.3%, before it returned to relative normal growth. Information employment is broadly distributed around the state, although mostly concentrated in metropolitan areas.
Financial Activities
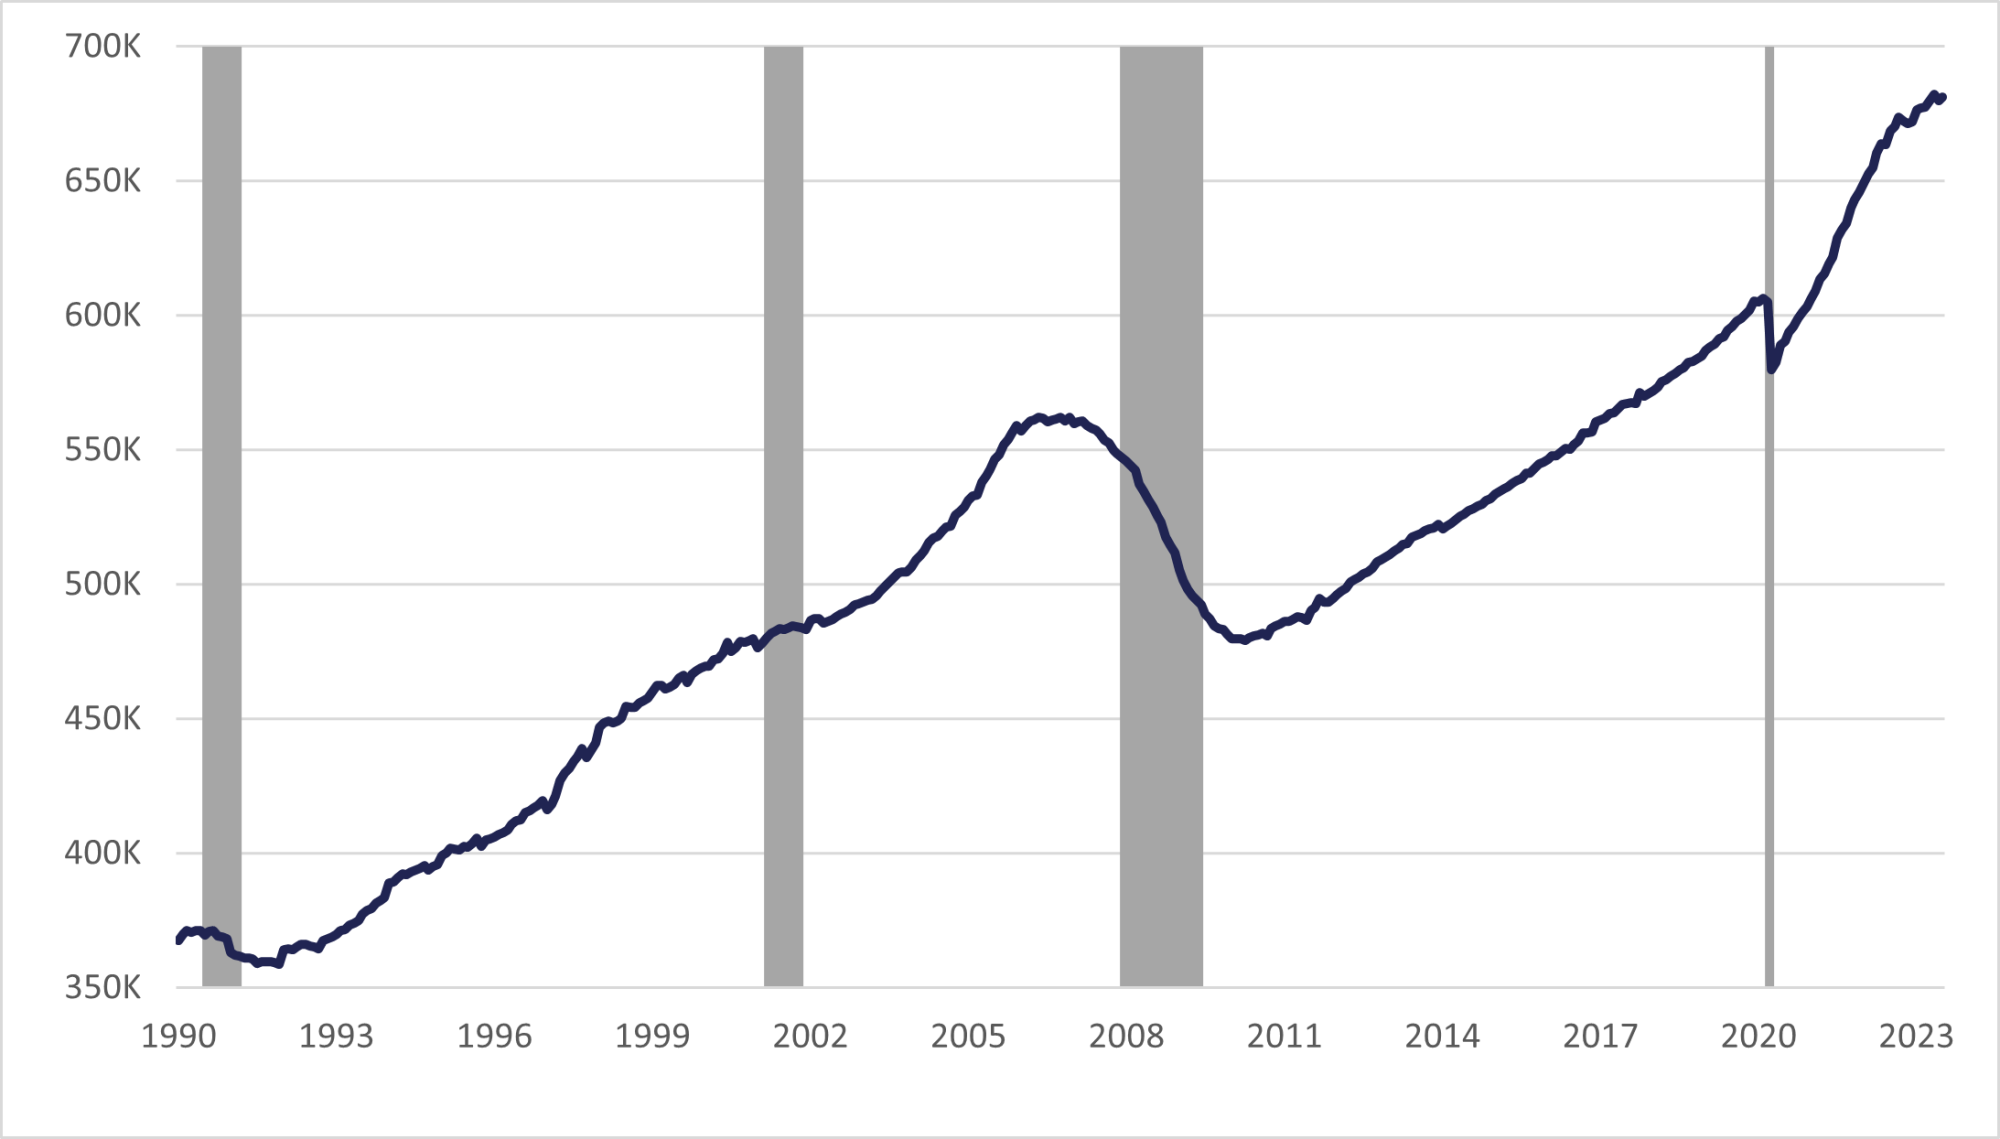
Financial Activities employment in Florida previously peaked at 562,100 jobs in December 2006 and experienced a rapid decline to 479,200 jobs in April 2010 during the Great Recession. Since that low point, employment in this sector had been trending upward with an average yearly growth rate of 2.7% during this period until February 2020, when employment was 606,200.
Figure 2.07
Florida Financial Activities Employment, Seasonally Adjusted
Source: Florida Department of Commerce, Bureau of Workforce Statistics and Economic Research (WSER), Current Employment Statistics, August 2023.
Florida lost 26,400 jobs in this industry between February and April 2020 and has since gained back more than the total jobs lost. In May 2023, this industry reached a new all-time high in employment with 682,100 and as of July 2023, the employment was 681,200, which is 75,000 more jobs than February 2020 (+12.4%).
The Financial Activities sector in Florida has historically grown more rapidly than in the U.S. as a whole. This pattern has only intensified in the post-pandemic period: since January 2021, the average yearly growth rate for Florida has been 5.0% compared to only 1.9% for the U.S. as a whole. Financial Activities jobs are a particularly significant share of employment in the Tampa Bay (LWDA 15) region, and to a lesser extent in the Northeast Florida (LWDA 8) region.
Professional and Business Services
Florida’s Professional and Business Services industry has been growing steadily for the past 30 years, except for a decline during the Great Recession, when it bottomed out at 988,600 jobs in September 2009. Since the end of the Great Recession, the jobs in this sector had returned to their upward trend until March 2020.
Figure 2.08
Florida Professional and Business Services Employment, Seasonally Adjusted

Source: Florida Department of Commerce, Bureau of Workforce Statistics and Economic Research (WSER), Current Employment Statistics, August 2023.
In February 2020, the employment in this sector was 1,406,400. Florida lost 136,500 jobs in this industry from February to April 2020. This industry has since gained back more than the total jobs lost and has continued its upward trend. As of July 2023, the employment was 1,644,800, which is 238,400 more jobs than February 2020 and a new all-time high (+17%).
Florida’s rate of growth in Professional and Business Services employment has generally mirrored or run slightly above the nationwide rate. Professional and Business Services employment is broadly distributed around the state, although mostly concentrated in metropolitan areas, especially in central and south Florida.
Education and Health Services
Florida did not experience declines in Education and Health Services employment in recent recessions, except the COVID-19 recession. Employment in this sector has been growing steadily, although the rate of job growth did slow during the Great Recession, with notable accelerations in 2014 and 2023.
Figure 2.09
Florida Education and Health Services Employment, Seasonally Adjusted

Source: Florida Department of Commerce, Bureau of Workforce Statistics and Economic Research (WSER), Current Employment Statistics, August 2023.
Education and Health Services employment was slower to recover from the pandemic than most other industries. Employment was 1,362,400 in February 2020 and the industry lost 135,700 jobs from February to April 2020. Florida gained all of these jobs back by January 2022 and has since continued to grow with an employment of 1,486,500 in July 2023 (+9.1% since February 2020), a new all-time high.
Florida’s rate of growth in Education and Health Services employment has generally trended with the national rate. Education and Health Services jobs are a particularly large share of employment in the North Central Florida (LWDA 9), Chipola (LWDA 3), and Pasco Hernando (LWDA 16) regions.
Leisure and Hospitality
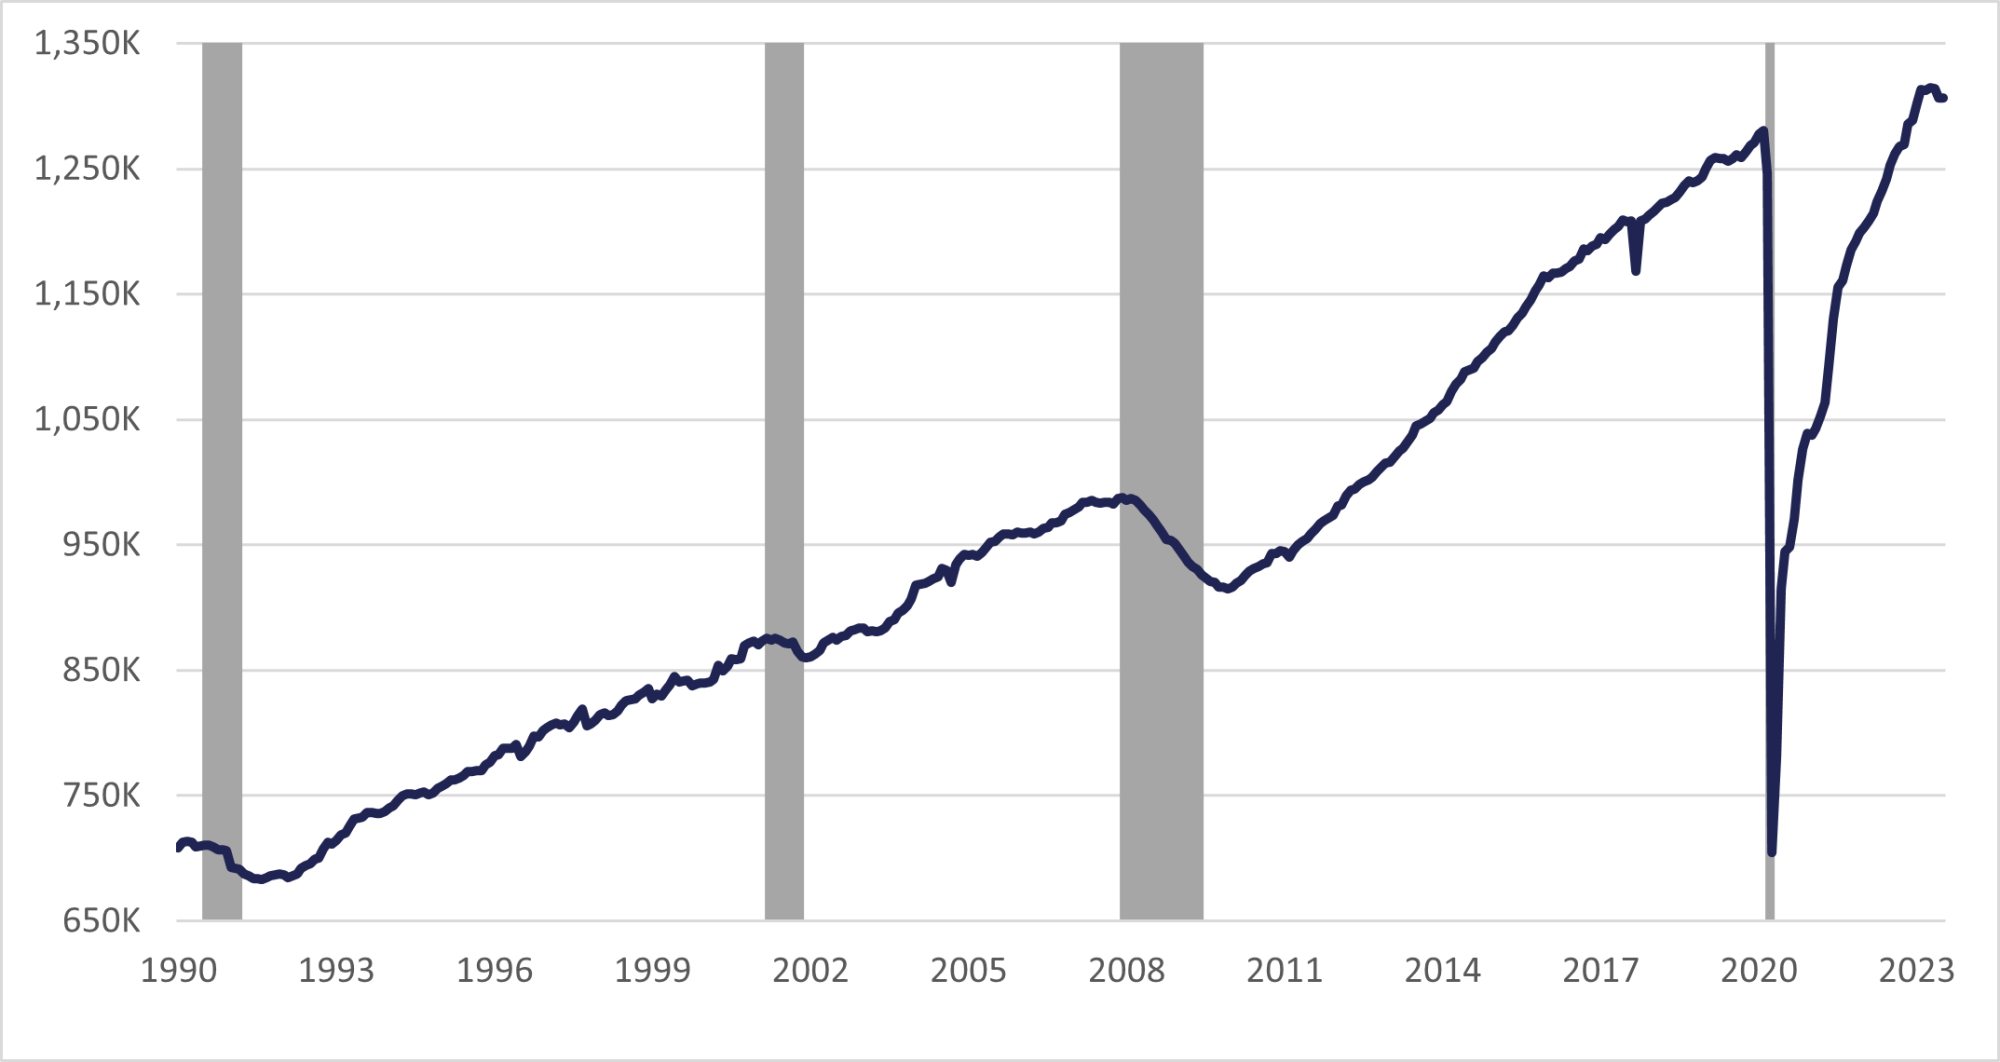
Leisure and Hospitality employment in Florida experienced a significant decrease during the Great Recession, reaching a low of 915,200 employed in December 2009.
Figure 2.10
Florida Leisure and Hospitality Employment, Seasonally Adjusted
Source: Florida Department of Commerce, Bureau of Workforce Statistics and Economic Research (WSER), Current Employment Statistics, August 2023.
Since the end of the Great Recession, Leisure and Hospitality employment had been trending upward at an accelerating rate until the start of the COVID-19 pandemic. Leisure and Hospitality suffered the greatest job loss of any industry during the pandemic and was slower to recover than other industries.
The employment in this sector was 1,280,300 in February 2020. Florida lost 575,500 (-55%) Leisure and Hospitality jobs from February to April 2020 and did not gain these jobs back until November 2022. It has since continued to grow, reaching an all-time high in employment in April 2023 with 1,314,600 jobs. As of July 2023, the employment in this industry was 1,306,200, which is 25,900 more jobs than February 2020 (+2.0%).
Historically, Florida’s rate of growth in Leisure and Hospitality employment has closely mirrored the nationwide rate. Industry job loss in Florida due to the pandemic was slightly less than the nation, as Florida lost 45.0% of employment compared to 48.6% of employment nationwide. However, Florida’s rate of recovery in this sector has lagged the nationwide rate.
Leisure and Hospitality constitute a disproportionately large share of total employment in the Okaloosa Walton (LWDA 2), Gulf Coast (LWDA 4), and Central Florida (LWDA 12) regions.
Other Services
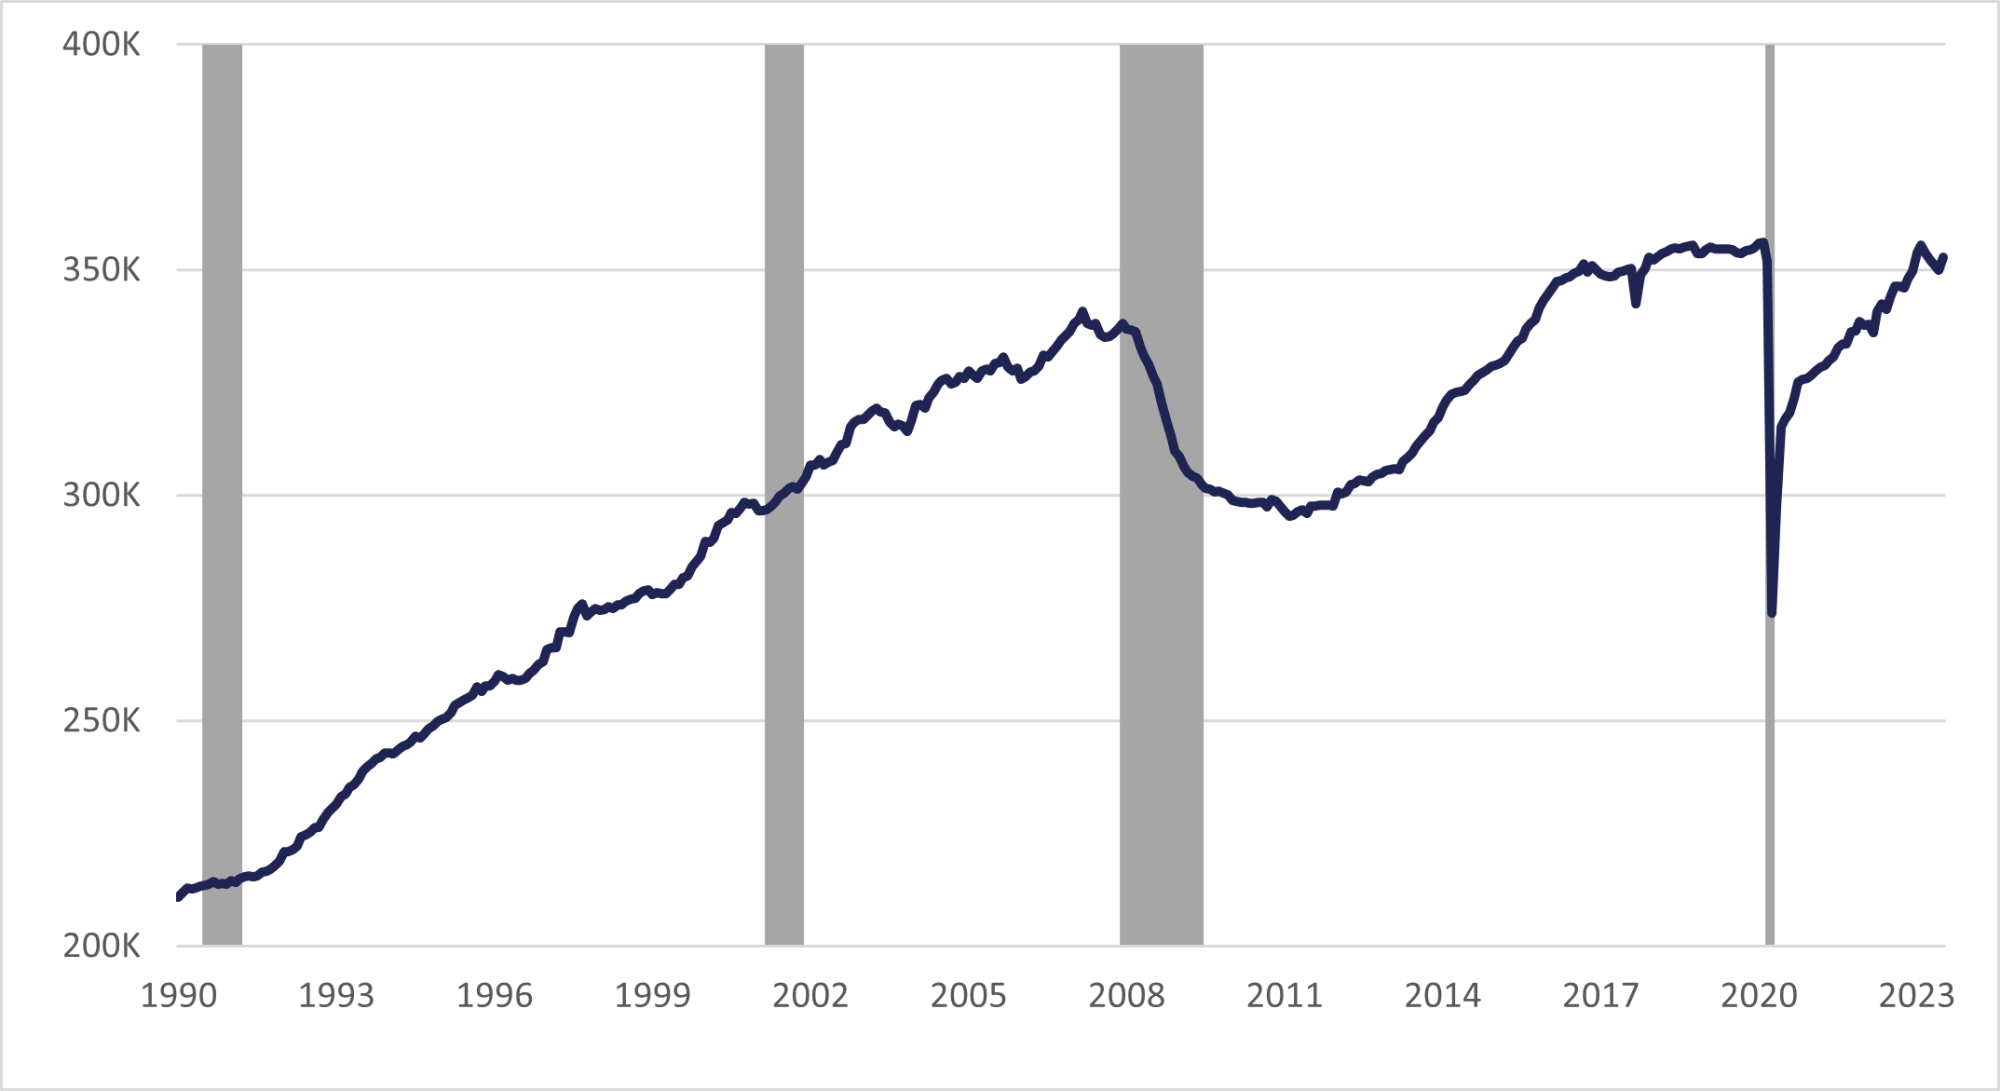
The Other Services sector comprises establishments engaged in providing services not specifically provided elsewhere in the industry classification system. Examples range from automotive repair and maintenance to environment, conservation, and wildlife organizations. Other Services employment in Florida experienced large declines during the Great Recession and did not start to recover until 2012.
Figure 2.11
Florida Other Services Employment, Seasonally Adjusted
Source: Florida Department of Economic Commerce, Bureau of Workforce Statistics and Economic Research (WSER), Current Employment Statistics, August 2023.
The number of jobs in this sector had been trending upward again until March 2020. Other Services employment was 356,200 in February 2020. Florida lost 82,300 jobs from this sector from February to April 2020 (-23.1%). This industry has yet to gain back all these lost jobs. The peak post-pandemic employment was 355,500 in February 2023, when the industry had recovered 99.8% of the jobs lost during the pandemic. Since then, the industry has stayed relatively constant with 352,900 employments in July 2023.
Aside from the trough in the years after the Great Recession, Florida’s rate of growth in Other Services had historically tended to run above the nationwide rate, although this trend ended around 2017.
Other Services jobs are more concentrated as a share of employment in the Research Coast (LWDA 20) region and, to a lesser degree, in the Palm Beach County (LWDA 21) region.
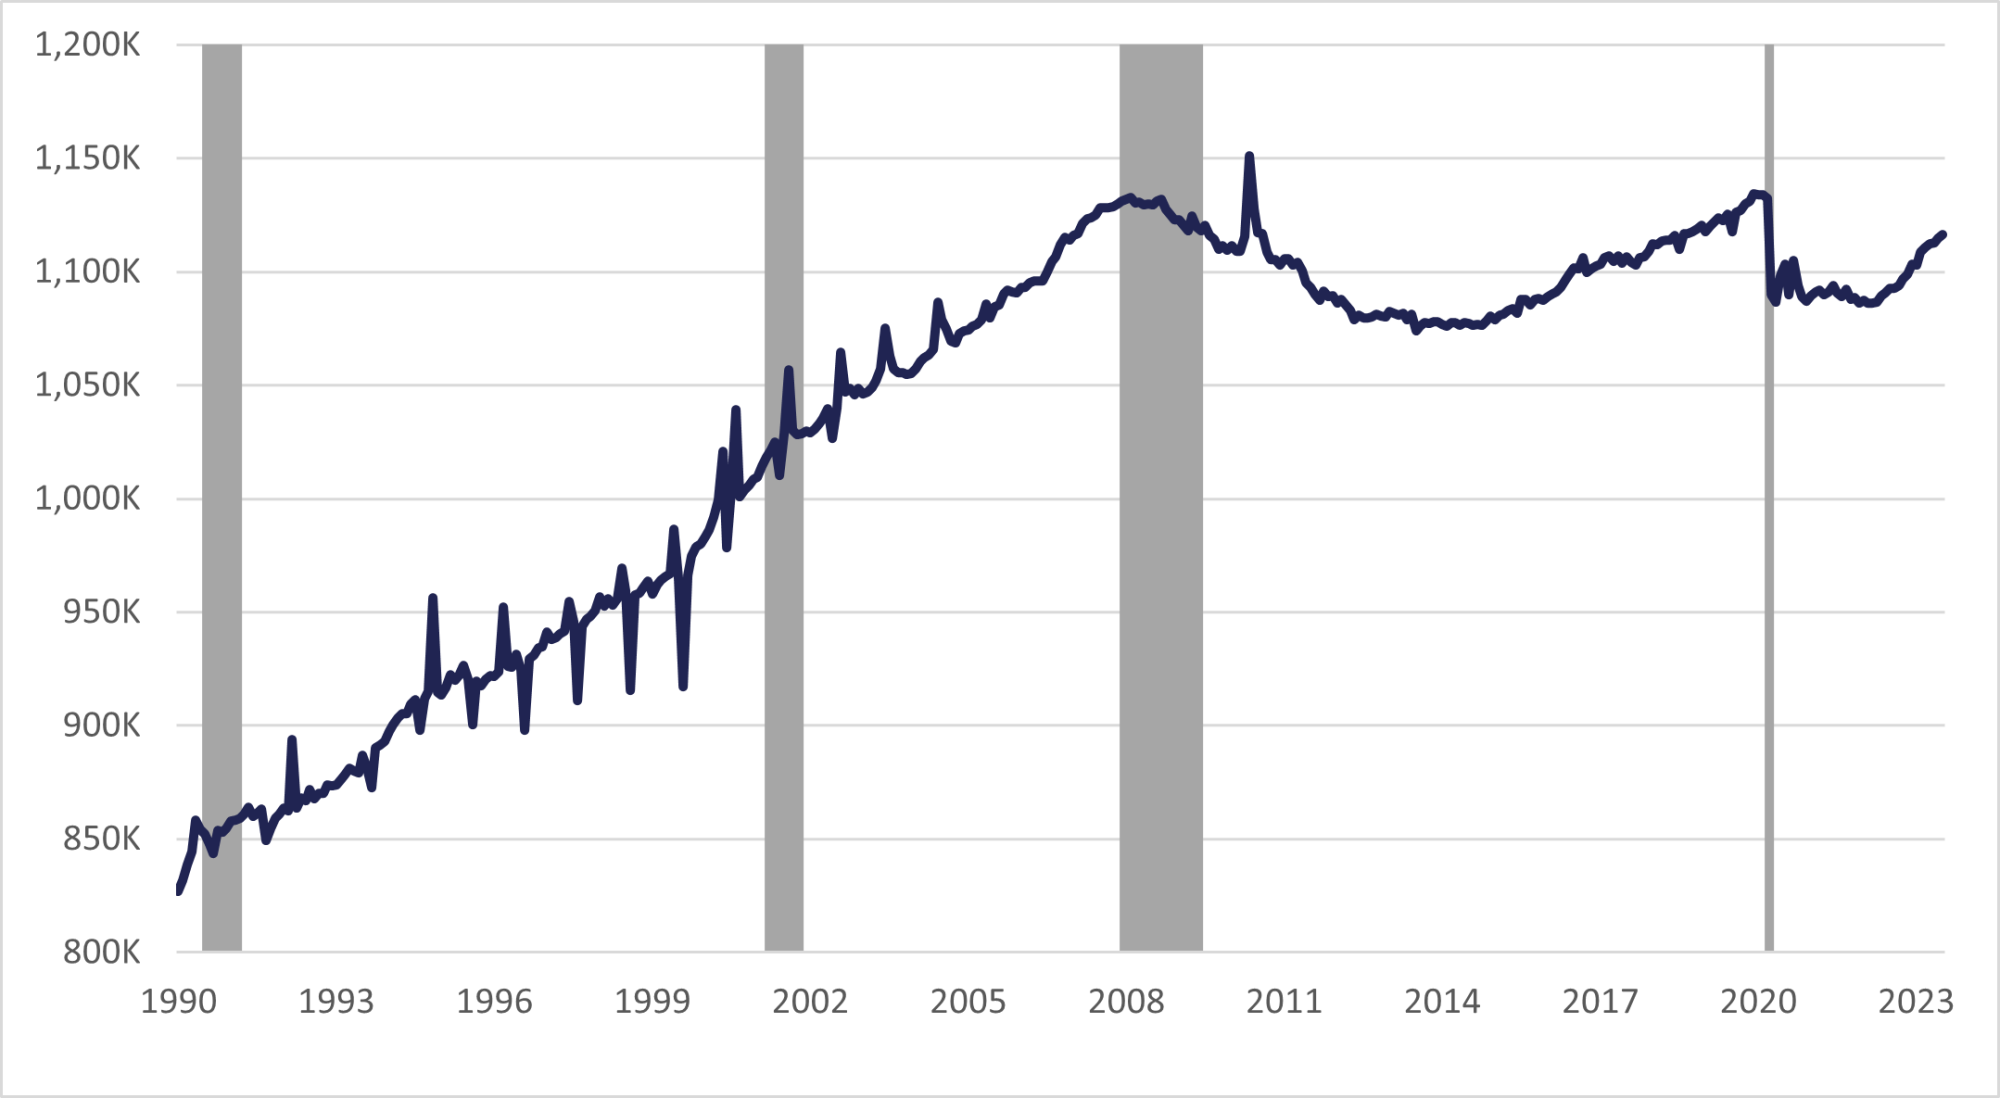
Government
Florida experienced losses in total Government employment from 2008 to 2014. Since 2014, the number of jobs in this sector had been trending upward and nearly returned to 2008 levels just before the COVID-19 pandemic started. Although, at the state government level, it is important to note that Florida operates a lean state government apparatus with the lowest number of state government employees per capita in the nation, reflecting a policy decision rather than an economic indicator.
Figure 2.12
Florida Government Employment, Seasonally Adjusted
Source: Florida Department of Economic Commerce, Bureau of Workforce Statistics and Economic Research (WSER), Current Employment Statistics, August 2023.
The employment in this sector was 1,133,800 in February 2020. Florida lost 43,800 Government jobs from February to April 2020. However, employment in this sector continued to decline until April 2021. As of July 2023, the employment in this industry was 1,116,400, which is 17,400 fewer jobs than February 2020 employment.
Occupational Groups
Occupational Groups represent the most aggregated level of occupations according to the Standard Occupational Classification and Coding Structure.
The three largest Occupational Groups in Florida are Office and Administrative Support occupations, with 1,388,581 jobs (14.0% of total jobs), Sales and Related (1,108,693 jobs, 11.1%) and Food Preparation and Serving Related (960,376 jobs, 9.6%) occupations.
The “Other Occupations < 5% share” group is the sum of every other occupational group that did not have at least 5% distribution of employment in Florida. Only the eight largest major occupational groups are shown in the figure below.
Figure 2.13
Percent Distribution of Employment in Florida by Major Occupational Group

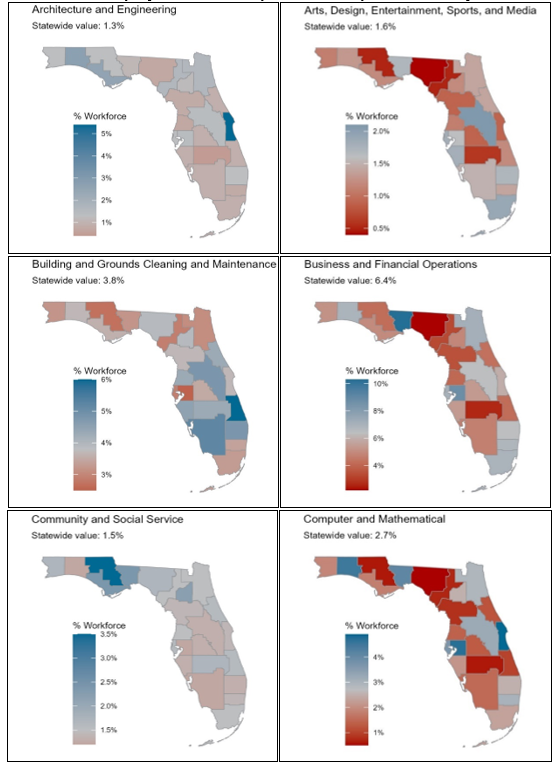
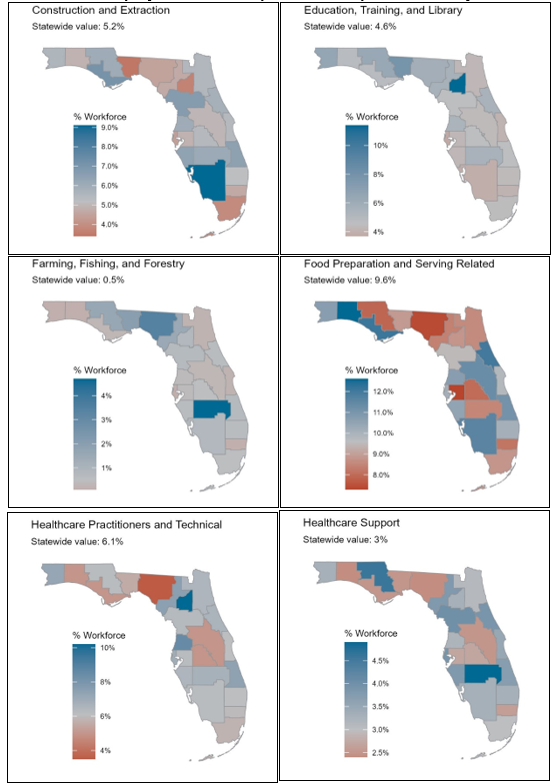
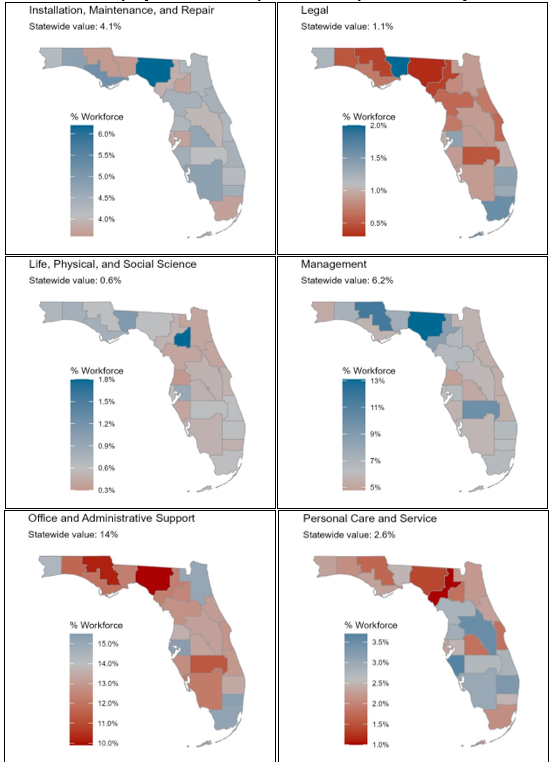
Occupational Groups by LWDA
The following figures display local area employment by major Occupational Group. Local occupational variation results from the diversity of economic focus and industry mix of Florida’s geographic areas.
Figure 2.14 lists each Occupational Group with the local workforce development area in which that group has the highest concentration.
Figure 2.14
Local Workforce Area with Largest Share of Employment, by Occupational Group
| Occupational Group | Local Workforce Development Area | Share of Employment |
|---|---|---|
| Architecture and Engineering | LWDA 13 | 5.4% |
| Arts, Design, Entertainment, Sports, and Media | LWDA 12 | 2.1% |
| Building and Grounds Cleaning and Maintenance | LWDA 20 | 6.0% |
| Business and Financial Operations | LWDA 5 | 10.3% |
| Community and Social Service | LWDA 3 | 3.5% |
| Computer and Mathematical | LWDA 13 | 4.9% |
| Construction and Extraction | LWDA 24 | 9.1% |
| Education, Training, and Library | LWDA 9 | 11.4% |
| Farming, Fishing, and Forestry | LWDA 19 | 4.7% |
| Food Preparation and Serving Related | LWDA 2 | 12.6% |
| Healthcare Practitioners and Technical | LWDA 9 | 10.2% |
| Healthcare Support | LWDA 19 | 4.9% |
| Installation, Maintenance, and Repair | LWDA 6 | 6.2% |
| Legal | LWDA 5 | 2.0% |
| Life, Physical, and Social Science | LWDA 9 | 1.8% |
| Management | LWDA 6 | 13.1% |
| Office and Administrative Support | LWDA 15 | 15.5% |
| Personal Care and Service | LWDA 18 | 3.7% |
| Production | LWDA 6 | 7.9% |
| Protective Service | LWDA 3 | 7.1% |
| Sales and Related | LWDA 2 | 13.5% |
| Transportation and Material Moving | LWDA 17 | 15.7% |
Source: Florida Department of Commerce, Bureau of Workforce Statistics and Economic Research, Occupational and Industry Employment Projections 2022-2030.
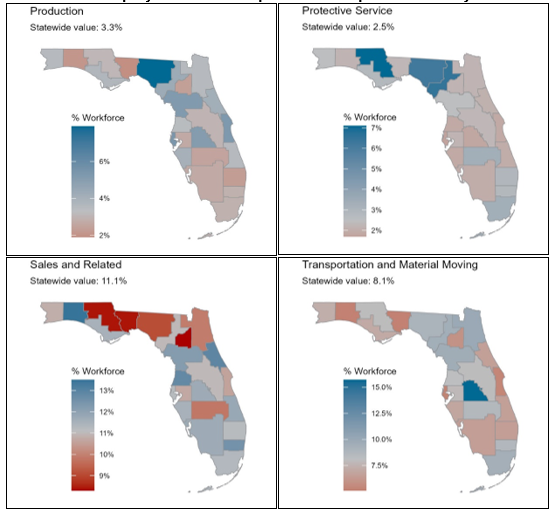
The maps in Figure 2.15 show the percent distribution of employment by major occupational group for all workforce areas in Florida. The color indicates the workforce region’s share of occupational employment relative to the statewide concentration, with blue indicating a share greater than statewide, red indicating a share less than statewide, and grey indicating a share similar to the statewide concentration. (In other words, when a local workforce area is highlighted in blue, that means the occupation is unusually concentrated in that area, and if it is red, that area has a low concentration of that occupation).
Figure 2.15
Share of Employment for Occupational Groups in Florida by LWDA
Source: Florida Department of Commerce, Bureau of Workforce Statistics and Economic Research, Occupational and Industry Employment Projections 2022-2030.
Figure 2.15 (continued)
Share of Employment for Occupational Groups in Florida by LWDA
Source: Florida Department of Commerce, Bureau of Workforce Statistics and Economic Research, Occupational and Industry Employment Projections 2022-2030.
Figure 2.15 (continued)
Share of Employment for Occupational Groups in Florida by LWDA
Source: Florida Department of Commerce, Bureau of Workforce Statistics and Economic Research, Occupational and Industry Employment Projections 2022-2030.
Figure 2.15 (continued)
Share of Employment for Occupational Groups in Florida by LWDA
Source: Florida Department of Commerce, Bureau of Workforce Statistics and Economic Research, Occupational and Industry Employment Projections 2022-2030.
Detailed Existing Demand Occupations
Existing demand occupations are occupations that have the highest number of projected total job openings. Starting with the release of the 2017-2025 projections, projected job openings are calculated using the separations method. Total job openings reflect (1) job openings resulting from employment growth, (2) job openings resulting from workers permanently exiting an occupation, and (3) job openings resulting from workers transferring to other occupations. In most occupations, replacement needs provide many more job openings than employment growth does.
The top five existing demand occupations for Florida statewide are related to Customer Service and Hospitality. Fast Food and Counter Workers is the top existing demand occupation with 449,810 projected total job openings between 2022 and 2030. Registered Nurses as well as General and Operations Managers are the only top existing demand occupations that require a degree beyond high school, based on criteria from the O*NET Education, Training, and Experience data.
Figure 2.16 displays the top 15 existing demand occupations (based on 2022-2030 total job openings) for Florida statewide.
Figure 2.16
Top 15 Existing Demand Occupations in Florida
| Code | Occupation | 2022 Employment | 2030 Employment | 2022-30 Level Change | 2022-2030 Percent Change | Total Job Openings | 2022 Median Hourly Wage | 2022 Entry Wage | 2022 Experienced Wage |
|---|---|---|---|---|---|---|---|---|---|
| 35-3023 | Fast Food and Counter Workers | 241,499 | 273,660 | 32,161 | 13.3% | 449,810 | $12.28 | $10.62 | $13.30 |
| 41-2031 | Retail Salespersons | 312,884 | 322,743 | 9,859 | 3.2% | 362,022 | $14.03 | $11.32 | $18.13 |
| 35- 3031 | Waiters and Waitresses | 198,790 | 215,329 | 16,539 | 8.3% | 335,957 | $13.79 | $10.27 | $18.65 |
| 41-2011 | Cashiers | 223,807 | 221,904 | -1,903 | -0.9% | 320,453 | $12.74 | $10.82 | $13.94 |
| 43-4051 | Customer Service Representatives | 271,886 | 280,721 | 8,835 | 3.2% | 286,575 | $17.61 | $13.67 | $21.16 |
| 53-7065 | Stockers and Order Fillers | 163,034 | 175,557 | 12,523 | 7.7% | 221,718 | $15.87 | $13.10 | $17.56 |
| 43- 9061 | Office Clerks, General | 214,649 | 218,028 | 3,379 | 1.6% | 200,455 | $17.86 | $13.12 | $22.46 |
| 53-7062 | Laborers and Freight, Stock, and Material Movers, Hand | 162,499 | 179,705 | 17,206 | 10.6% | 196,206 | $15.45 | $12.92 | $18.66 |
| 35-2014 | Cooks, Restaurant | 118,986 | 147,046 | 28,060 | 23.6% | 181,763 | $16.08 | $13.19 | $17.85 |
| 37-2011 | Janitors and Cleaners, Except Maids and Housekeeping Cleaners | 121,314 | 132,478 | 11,164 | 9.2% | 145,674 | $13.34 | $11.15 | $15.44 |
| 37-3011 | Landscaping and Groundskeeping Workers | 114,705 | 128,285 | 13,580 | 11.8% | 138,730 | $15.54 | $13.35 | $17.48 |
| 11-1021 | General and Operations Managers | 154,799 | 171,598 | 16,799 | 10.9% | 123,818 | $42.90 | $23.02 | $70.24 |
| 43- 6014 | Secretaries and Administrative Assistants, Except Legal, Medical, and Executive | 135,721 | 132,173 | -3,548 | -2.6% | 110,811 | $18.38 | $13.83 | $22.06 |
| 29-1141 | Registered Nurses | 193,041 | 216,636 | 23,595 | 12.2% | 108,546 | $37.36 | $28.87 | $43.19 |
| 37-2012 | Maids and Housekeeping Cleaners | 86,291 | 95,910 | 9,619 | 11.1% | 106,018 | $13.69 | $11.51 | $15.21 |
Source: Florida Department of Commerce, Bureau of Workforce Statistics and Economic Research, Occupational and Industry Employment Projections 2022-2030.
The Florida Department of Commerce (FloridaCommerce) also identifies existing demand occupations for the state and each LWDA in the state in published Demand Occupation Lists. These annual publications identify occupations that exhibit high growth and wages. Occupations must pass three criteria to make it on the Demand Occupation List. They must:
- Be linked to a postsecondary, associate’s, or bachelor’s degree
- Have entry and average wages above an employment cost and price level adjusted Florida wage
- Have above a given threshold of annual job openings in conjunction with positive projected employment growth.
Figure 2.17
2023-2024 Statewide Demand Occupation List
| Occupation Title | Annual Percent Growth | Annual Openings | 2021 Hourly Entry Wage | 2021 Hourly Mean Wage |
|---|---|---|---|---|
| Accountants and Auditors | 1.43 | 9,327 | $21.86 | $36.69 |
| Aircraft Mechanics and Service Technicians | 1.28 | 1,424 | $19.87 | $31.28 |
| Airline Pilots, Copilots, and Flight Engineers | 1.19 | 665 | $63.62 | $111.83 |
| Architectural and Civil Drafters | 1.36 | 831 | $18.87 | $26.84 |
| Architectural and Engineering Managers | 1.76 | 723 | $46.08 | $70.33 |
| Audio and Video Technicians | 2.49 | 1,013 | $14.84 | $24.05 |
| Automotive Service Technicians and Mechanics | 0.33 | 5,289 | $13.91 | $21.79 |
| Biological Technicians | 1.89 | 566 | $14.82 | $20.84 |
| Bookkeeping, Accounting, and Auditing Clerks | 0.22 | 12,179 | $13.86 | $20.40 |
| Bus and Truck Mechanics and Diesel Engine Specialists | 1.26 | 1,594 | $18.05 | $25.08 |
| Bus Drivers, Transit and Intercity | 0.73 | 1,327 | $14.27 | $20.76 |
| Business Teachers, Postsecondary | 2.23 | 525 | $23.69 | $45.70 |
| Cardiovascular Technologists and Technicians | 1.55 | 517 | $14.20 | $24.33 |
| Cargo and Freight Agents | 1.39 | 1,118 | $15.36 | $22.67 |
| Carpenters | 0.99 | 6,762 | $15.60 | $21.14 |
| Cement Masons and Concrete Finishers | 1.41 | 1,658 | $14.09 | $19.20 |
| Chefs and Head Cooks | 1.48 | 1,972 | $16.30 | $28.29 |
| Civil Engineers | 1.67 | 1,642 | $27.52 | $45.22 |
| Claims Adjusters, Examiners, and Investigators | 0.10 | 2,094 | $20.39 | $31.45 |
| Clergy | 1.03 | 1,825 | $15.27 | $24.58 |
| Clinical Laboratory Technologists and Technicians | 1.40 | 1,891 | $15.26 | $25.13 |
| Commercial Pilots | 1.34 | 746 | $27.66 | $52.69 |
| Community and Social Service Specialists, All Other | 1.56 | 546 | $15.25 | $21.18 |
| Compensation, Benefits, and Job Analysis Specialists | 1.47 | 554 | $19.06 | $28.75 |
| Compliance Officers | 1.15 | 2,499 | $18.12 | $31.63 |
| Computer and Information Systems Managers | 1.82 | 2,248 | $44.67 | $70.34 |
| Computer Network Architects | 1.53 | 685 | $32.80 | $53.64 |
| Computer Network Support Specialists | 1.44 | 887 | $21.01 | $32.57 |
| Computer Systems Analysts | 1.45 | 2,943 | $27.96 | $44.58 |
| Computer User Support Specialists | 1.73 | 4,532 | $15.75 | $24.95 |
| Construction and Building Inspectors | 1.06 | 1,468 | $19.06 | $30.12 |
| Construction Managers | 1.64 | 3,377 | $28.74 | $49.89 |
| Cost Estimators | 0.90 | 1,377 | $19.13 | $31.18 |
| Dental Assistants | 1.87 | 3,421 | $15.87 | $19.63 |
| Dental Hygienists | 1.87 | 1,153 | $29.19 | $35.18 |
| Diagnostic Medical Sonographers | 2.45 | 614 | $26.98 | $34.27 |
| Drywall and Ceiling Tile Installers | 1.10 | 788 | $14.00 | $19.61 |
| Education Administrators, Postsecondary | 1.42 | 1,111 | $33.25 | $46.05 |
| Electrical and Electronic Engineering Technologists and Technicians | 1.42 | 782 | $19.14 | $29.33 |
| Electrical Engineers | 1.97 | 656 | $28.99 | $45.32 |
| Electricians | 1.51 | 5,999 | $16.86 | $23.60 |
| Electronics Engineers, Except Computer | 1.69 | 519 | $35.33 | $50.30 |
| Elementary School Teachers, Except Special Education | 1.21 | 6,265 | $21.08 | $29.57 |
| Engineers, All Other | 1.32 | 693 | $26.74 | $49.99 |
| Farmers, Ranchers, and Other Agricultural Managers | 0.10 | 5,002 | $22.53 | $44.56 |
| Financial Managers | 2.28 | 3,661 | $34.98 | $66.29 |
| Firefighters | 0.63 | 1,626 | $16.59 | $25.71 |
| First-Line Supervisors of Construction Trades and Extraction Workers | 1.35 | 6,420 | $21.04 | $31.74 |
| First-Line Supervisors of Housekeeping and Janitorial Workers | 1.83 | 2,885 | $13.88 | $19.74 |
| First-Line Supervisors of Landscaping, Lawn Service, and Groundskeeping Workers | 1.74 | 1,982 | $16.38 | $23.81 |
| First-Line Supervisors of Mechanics, Installers, and Repairers | 1.22 | 3,401 | $20.64 | $31.26 |
| First-Line Supervisors of Non-Retail Sales Workers | 0.04 | 2,634 | $23.51 | $43.82 |
| First-Line Supervisors of Office and Administrative Support Workers | 0.48 | 11,899 | $18.86 | $29.35 |
| First-Line Supervisors of Production and Operating Workers | 1.09 | 2,870 | $18.77 | $29.79 |
| First-Line Supervisors of Retail Sales Workers | 0.02 | 10,845 | $14.19 | $22.39 |
| First-Line Supervisors of Transportation and Material Moving Workers, Except Aircraft Cargo Handling Supervisors | 1.46 | 4,152 | $16.95 | $26.27 |
| Food Service Managers | 0.59 | 3,684 | $19.55 | $35.82 |
| General and Operations Managers | 1.36 | 15,477 | $21.26 | $47.51 |
| Glaziers | 2.24 | 869 | $15.29 | $20.39 |
| Graphic Designers | 0.70 | 1,716 | $16.87 | $25.83 |
| Heating, Air Conditioning, and Refrigeration Mechanics and Installers | 1.16 | 4,213 | $15.77 | $22.52 |
| Heavy and Tractor-Trailer Truck Drivers | 0.98 | 13,002 | $14.92 | $21.62 |
| Human Resources Managers | 1.35 | 766 | $34.83 | $56.98 |
| Human Resources Specialists | 1.35 | 5,002 | $18.49 | $31.42 |
| Industrial Engineers | 2.36 | 1,025 | $30.14 | $44.86 |
| Industrial Machinery Mechanics | 2.15 | 1,828 | $18.12 | $26.07 |
| Industrial Truck and Tractor Operators | 1.83 | 4,759 | $14.88 | $19.30 |
| Information Security Analysts | 4.14 | 1,047 | $30.80 | $49.44 |
| Insurance Sales Agents | 1.06 | 5,238 | $14.47 | $28.19 |
| Interpreters and Translators | 3.15 | 522 | $13.67 | $24.63 |
| Kindergarten Teachers, Except Special Education | 1.20 | 979 | $19.71 | $28.39 |
| Licensed Practical and Licensed Vocational Nurses | 1.57 | 3,969 | $18.96 | $23.01 |
| Loan Officers | 0.19 | 1,467 | $17.27 | $35.86 |
| Logisticians | 1.47 | 932 | $20.00 | $33.32 |
| Machinists | 1.36 | 1,125 | $15.46 | $22.14 |
| Management Analysts | 1.85 | 8,036 | $22.17 | $41.63 |
| Market Research Analysts and Marketing Specialists | 2.73 | 6,860 | $18.28 | $32.99 |
| Marketing Managers | 1.54 | 1,463 | $36.91 | $72.48 |
| Mechanical Engineers | 1.75 | 711 | $27.76 | $43.30 |
| Medical Assistants | 2.34 | 9,263 | $13.72 | $17.06 |
| Medical Equipment Repairers | 1.49 | 569 | $15.53 | $24.55 |
| Medical Secretaries and Administrative Assistants | 1.50 | 5,104 | $13.53 | $17.21 |
| Meeting, Convention, and Event Planners | 1.80 | 1,150 | $15.27 | $25.39 |
| Middle School Teachers, Except Special and Career/Technical Education | 1.22 | 2,908 | $20.31 | $28.98 |
| Mobile Heavy Equipment Mechanics, Except Engines | 1.10 | 937 | $17.19 | $24.11 |
| Motorboat Mechanics and Service Technicians | 1.12 | 507 | $15.78 | $24.18 |
| Network and Computer Systems Administrators | 1.34 | 1,592 | $24.60 | $39.34 |
| Occupational Therapy Assistants | 3.36 | 588 | $24.74 | $31.43 |
| Operating Engineers and Other Construction Equipment Operators | 0.96 | 2,869 | $15.72 | $21.27 |
| Painters, Construction and Maintenance | 0.95 | 3,163 | $14.28 | $18.62 |
| Paralegals and Legal Assistants | 1.80 | 4,961 | $17.89 | $25.93 |
| Personal Financial Advisors | 0.57 | 1,939 | $20.04 | $50.42 |
| Pest Control Workers | 1.36 | 1,557 | $13.66 | $18.60 |
| Pharmacy Technicians | 0.96 | 2,629 | $13.75 | $17.33 |
| Phlebotomists | 2.29 | 1,214 | $13.78 | $17.17 |
| Physical Therapist Assistants | 3.39 | 1,330 | $22.28 | $31.22 |
| Physician Assistants | 3.99 | 837 | $28.97 | $50.39 |
| Plumbers, Pipefitters, and Steamfitters | 1.10 | 3,524 | $16.60 | $23.13 |
| Police and Sheriff’s Patrol Officers | 0.60 | 3,358 | $22.46 | $31.88 |
| Postsecondary Teachers, All Other | 1.47 | 2,167 | $19.75 | $33.81 |
| Producers and Directors | 1.81 | 774 | $18.61 | $34.98 |
| Property, Real Estate, and Community Association Managers | 1.09 | 3,497 | $17.33 | $32.01 |
| Public Relations Specialists | 1.40 | 1,596 | $17.13 | $30.57 |
| Radiologic Technologists and Technicians | 1.39 | 1,359 | $20.96 | $28.64 |
| Registered Nurses | 1.53 | 13,568 | $26.50 | $34.62 |
| Respiratory Therapists | 3.03 | 742 | $24.46 | $29.37 |
| Roofers | 2.35 | 3,616 | $14.17 | $19.63 |
| Sales Managers | 1.37 | 2,575 | $30.43 | $61.04 |
| Sales Representatives, Wholesale and Manufacturing, Except Technical and Scientific Products | 0.83 | 9,474 | $16.02 | $32.58 |
| Sales Representatives, Wholesale and Manufacturing, Technical and Scientific Products | 1.05 | 2,619 | $21.11 | $43.77 |
| Secondary School Teachers, Except Special and Career/Technical Education | 1.22 | 3,890 | $21.75 | $30.83 |
| Securities, Commodities, and Financial Services Sales Agents | 0.49 | 3,393 | $18.80 | $37.75 |
| Security and Fire Alarm Systems Installers | 2.00 | 687 | $16.23 | $22.90 |
| Sheet Metal Workers | 1.43 | 1,016 | $15.24 | $21.68 |
| Special Education Teachers, Kindergarten and Elementary School | 1.22 | 615 | $19.78 | $30.63 |
| Substance Abuse, Behavioral Disorder, and Mental Health Counselors | 2.37 | 2,200 | $15.52 | $24.04 |
| Surgical Technologists | 1.63 | 755 | $17.60 | $23.10 |
| Surveying and Mapping Technicians | 1.65 | 717 | $14.73 | $20.52 |
| Telecommunications Equipment Installers and Repairers, Except Line Installers | 1.41 | 2,320 | $16.05 | $25.27 |
| Telecommunications Line Installers and Repairers | 1.31 | 814 | $16.56 | $22.57 |
| Tile and Stone Setters | 2.06 | 777 | $14.53 | $20.23 |
| Training and Development Specialists | 1.58 | 2,558 | $17.25 | $29.87 |
| Transportation, Storage, and Distribution Managers | 1.45 | 757 | $28.08 | $49.75 |
| Welders, Cutters, Solderers, and Brazers | 1.35 | 1,917 | $15.86 | $21.31 |
Source: Florida Department of Commerce, Bureau of Workforce Statistics and Economic Research, 2023-2024 Demand Occupation List.
The 2021 Reimagining Education and Career Help (REACH) Act established a Labor Market Estimating Conference within the Office of Economic and Demographic Research. The Conference meets regularly to provide long-term strategic direction regarding at-risk areas of Florida’s labor market. Occupational areas of concern and critical occupation groups of concern are identified by comparing supply and demand over a 10-year forecast that considers only existing economic structures and identifies foundational imbalances that would persist without intervention.
The Conference identified 101 occupational areas of concern for the state that are represented by educational attainment in the report linked here. In the most recent convening, the conference identified Healthcare Practitioners and Technical Occupations and Healthcare Support Occupations as critical occupational groups of concern (June 2023).
(ii) Emerging Demand Industry Sectors and Occupations. Provide an analysis of the industries and occupations for which demand is emerging.
Projected Changes in Occupational Demand
Occupational employment projections tables for all Florida geographic areas can be found on the FloridaCommerce website (https://floridajobs.org/labor-market-information) and on the Florida Insight website (https://floridajobs.org/economic-data).
Emerging Demand Industries
Emerging industries are new or small industries with high projected employment growth. The emerging industries listed below reflect the four-digit North American Industry Classification System (NAICS) industries with the fastest projected growth rates over the next eight years for industries with less than the average employment level. Notably, Trade,
Transportation and Utilities industries occupy two of the five top positions and five of the top 20 positions on the list of emerging industries. The complete list of the fastest-growing industries is in Figure 2.18.
Figure 2.18
Top Emerging Industries
| Sector | Code | Industry Title | 2022 Employment | 2030 Employment | 2022-2030 Total Change | 2022 – 2030 Percent Change |
|---|---|---|---|---|---|---|
| Professional and Business Services | 5615 | Travel Arrangement and Reservation Services | 21,146 | 29,814 | 8,668 | 40.99% |
| Financial Activities | 5321 | Automotive Equipment Rental and Leasing | 15,664 | 20,470 | 4,806 | 30.68% |
| Financial Activities | 5331 | Lessors of Nonfinancial Intangible Assets (except Copyrighters) | 1,942 | 2,473 | 531 | 27.34% |
| Manufacturing | 3212 | Veneer, Plywood, and Engineered Wood Product Manufacturing | 4,816 | 6,054 | 1,238 | 25.71% |
| Education and Health Services | 6219 | Other Ambulatory Health Care Services | 18,159 | 22,706 | 4,547 | 25.04% |
| Other Services | 8112 | Electronic and Precision Equipment Repair and Maintenance | 8,716 | 10,816 | 2,100 | 24.09% |
| Trade, Transportation and Utilities | 4831 | Deep Sea, Coastal, and Great Lakes Water Transportation | 14,241 | 17,569 | 3,328 | 23.37% |
| Information | 5121 | Motion Picture and Video Industries | 12,266 | 15,084 | 2,818 | 22.97% |
| Leisure and Hospitality | 7113 | Promoters of Performing Arts, Sports, and Similar Events | 10,195 | 12,493 | 2,298 | 22.54% |
| Education and Health Services | 6117 | Educational Support Services | 9,170 | 11,111 | 1,941 | 21.17% |
| Leisure and Hospitality | 7121 | Museums, Historical Sites, and Similar Institutions | 8,115 | 9,830 | 1,715 | 21.13% |
| Manufacturing | 3254 | Pharmaceutical and Medicine Manufacturing | 10,389 | 12,500 | 2,111 | 20.32% |
| Professional and Business Services | 5417 | Scientific Research and Development Services | 25,226 | 30,274 | 5,048 | 20.01% |
| Manufacturing | 3361 | Motor Vehicle Manufacturing | 1,652 | 1,975 | 323 | 19.55% |
| Professional and Business Services | 5619 | Other Support Services | 13,759 | 16,439 | 2,680 | 19.48% |
| Education and Health Services | 6116 | Other Schools and Instruction | 24,649 | 29,443 | 4,794 | 19.45% |
| Trade, Transportation and Utilities | 4854 | School and Employee Bus Transportation | 1,677 | 2,000 | 323 | 19.26% |
| Manufacturing | 3336 | Engine, Turbine, and Power Transmission Equipment Manufacturing | 2,529 | 3,015 | 486 | 19.22% |
| Education and Health Services | 6223 | Specialty (except Psychiatric and Substance Abuse) Hospitals | 16,297 | 19,229 | 2,932 | 17.99% |
| Construction | 2373 | Highway, Street, and Bridge Construction | 24,568 | 28,957 | 4,389 | 17.86% |
Source: Florida Department of Commerce, Bureau of Workforce Statistics and Economic Research, Occupational and Industry Employment Projections 2022-2030.
Aviation
As of 2022, the aviation sector (composed of subsectors including passenger and freight air transportation, airport operations and support services, and flight training) has added more than 28,000 jobs statewide since reaching a low point in 2010, an increase of 54%. The aviation sector added 11,533 jobs in 2022 alone, an increase of 15% over 2021 levels. The average annual wage of employees in the aviation sector was $80,522 in 2022, compared to the statewide average of $63,811.
The occupations expected to add the most jobs in the aviation sector that require postsecondary training are Aircraft Mechanics and Service Technicians; Airline pilots, Copilots, and Flight Engineers; Career and Technical Education Teachers; and Avionics Technicians.
Aerospace
As of 2022, the aerospace sector (composed of subsectors including aircraft and aircraft parts manufacturing, search and navigation instrument manufacturing, missile and space vehicle manufacturing, and satellite communications) has added more than 10,000 jobs statewide since reaching a low point in 2014, an increase of 39%. Florida’s aviation sector added 2,453 jobs in 2022 alone, an increase of 6% over 2021 levels. The average annual wage of employees in the aerospace sector was $110,825 in 2022, compared to the statewide average of $63,811.
The occupations expected to add the most jobs in the aerospace sector that require postsecondary training are Industrial Engineers; Aircraft Mechanics and Service Technicians; Software Developers; Mechanical Engineers; and Aerospace Engineers.
Emerging Occupations
Emerging occupations comprise (1) new occupations in the workforce and (2) traditional occupations with requisite knowledge, skills, and abilities that are currently evolving in response to altered market conditions, new technology, and societal changes. Some of the factors that cause occupations to emerge are changing technology, laws, demographics, and business practices. In Florida, the fastest-growing among the emerging occupations are statisticians, information security analysts, and physician assistants.
The most common industry sectors for emerging occupations are healthcare and professional services, due to ongoing advances in medical technology; life, physical, and environmental sciences; engineering, mathematics, and computer sciences; and psychology and the social sciences. The growth in healthcare sector emerging occupations reflects an increasing demand for medical services due to population aging and technological innovation.
The Healthcare Practitioners and Technical occupational group is projected to account for five of the top 20 emerging occupations (Physician Assistants, Veterinary Technologists and Technicians, Respiratory Therapists, Veterinarians, Genetic Counselors).
Figure 2.19 shows the top 20 emerging occupations for Florida statewide. This list is based on the 2022-2030 projected job growth rate for occupations with less than-average employment at the occupational level.
Figure 2.19
Top 20 Emerging Occupations in Florida
| Code | Occupation | 2022 Employment | 2030 Employment | 2022-2030 Level Change | 2022-2030 Percent Change | Total Job Openings | 2022 Median Wage | 2022 Entry Wage | 2022 Experienced Wage |
|---|---|---|---|---|---|---|---|---|---|
| 15-2041 | Statisticians | 1,488 | 2,075 | 587 | 39.4% | 1,588 | $35.00 | $21.61 | $49.64 |
| 15-1212 | Information Security Analysts | 8,469 | 11,271 | 2,802 | 33.1% | 8,383 | $51.17 | $34.11 | $63.62 |
| 29-1071 | Physician Assistants | 8,066 | 10,639 | 2,573 | 31.9% | 6,692 | $52.48 | $31.91 | $64.04 |
| 15-2098 | Data Scientists and Mathematical Science Occupations, All Other | 2,864 | 3,764 | 900 | 31.4% | 2,763 | - | - | - |
| 31-2021 | Physical Therapist Assistants | 7,909 | 10,052 | 2,143 | 27.1% | 10,642 | $30.94 | $24.26 | $35.62 |
| 31-2011 | Occupational Therapy Assistants | 3,396 | 4,308 | 912 | 26.9% | 4,702 | $31.31 | $26.39 | $35.25 |
| 39-1013 | First-Line Supervisors of Gambling Services Workers | 1,069 | 1,354 | 285 | 26.7% | 1,311 | $27.71 | $19.38 | $31.94 |
| 39-3011 | Gaming Dealers | 4,802 | 6,076 | 1,274 | 26.5% | 7,559 | $12.35 | $10.61 | $20.08 |
| 25-1071 | Health Specialties Teachers, Postsecondary | 11,611 | 14,614 | 3,003 | 25.9% | 12,597 | $38.45 | $25.60 | $54.93 |
| 27-4032 | Film and Video Editors | 1,558 | 1,959 | 401 | 25.7% | 1,720 | $23.48 | $18.08 | $30.86 |
| 27-3091 | Interpreters and Translators | 3,826 | 4,789 | 963 | 25.2% | 4,182 | $22.50 | $15.35 | $31.29 |
| 25-1072 | Nursing Instructors and Teachers, Postsecondary | 4,634 | 5,792 | 1,158 | 25.0% | 4,972 | $37.08 | $26.13 | $44.75 |
| 29-2056 | Veterinary Technologists and Technicians | 11,022 | 13,752 | 2,730 | 24.8% | 9,693 | $17.69 | $14.21 | $20.34 |
| 31-9096 | Veterinary Assistants and Laboratory Animal Caretakers | 6,097 | 7,600 | 1,503 | 24.7% | 10,240 | $16.16 | $13.11 | $17.35 |
| 29-1126 | Respiratory Therapists | 8,993 | 11,172 | 2,179 | 24.2% | 5,939 | $31.50 | $26.99 | $36.06 |
| 29-1131 | Veterinarians | 5,472 | 6,791 | 1,319 | 24.1% | 2,862 | $50.42 | $34.02 | $66.21 |
| 47-3016 | Helpers--Roofers | 1,313 | 1,625 | 312 | 23.8% | 1,686 | $17.65 | $14.75 | $18.77 |
| 15-1221 | Computer and Information Research Scientists | 1,360 | 1,682 | 322 | 23.7% | 1,151 | $55.09 | $40.86 | $74.70 |
| 15-2031 | Operations Research Analysts | 6,159 | 7,597 | 1,438 | 23.3% | 5,020 | $36.09 | $21.01 | $47.59 |
| 17-3021 | Aerospace Engineering and Operations Technicians | 1,887 | 2,319 | 432 | 22.9% | 1,973 | $37.28 | $23.47 | $44.61 |
Source: Florida Department of Commerce, Bureau of Workforce Statistics and Economic Research, Occupational and Industry Employment Projections 2022-2030.
(iii) Employers’ Employment Needs. With regard to the industry sectors and occupations identified in (A)(i) and (ii), provide an assessment of the employment needs of employers, including a description of the knowledge, skills, and abilities required, including credentials and licenses.
Training
Certifications are issued by a non-governmental certification body and convey that an individual has the knowledge or skill to perform a specific job. A license is awarded by a government agency and conveys legal authority to work in an occupation. Possession of a certificate or license usually commands a wage premium, generally ranging from 15% to 35% in Florida. Figure 2.20 displays median weekly earnings for full-time workers over age 25, with and without certifications.
Among all Floridians in this group, 27.1% have a certificate or license, with median weekly earnings of $1,008. This is 30% higher than the same measure for those without a certification ($774). That difference is reported in the table as the “wage premium.” The wage premium from certificates and licenses tends to be higher among older workers, and lower among female or Black workers.
Figure 2.20
Florida Weekly Earnings with Certificates or Licenses (Ages 25 and above)
| Median Weekly Earnings for Full-time Wage & Salary Workers | ||||
| % With Certificate or License | Without Certificate or License | With Certificate or License | Wage Premium | |
| Total Employed (over 25) | 27.1% | $774 | $1,008 | 30% |
| Age | ||||
| 25 - 34 | 23.0% | $694 | $859 | 24% |
| 35 - 44 | 28.7% | $814 | $1,010 | 24% |
| 45 - 54 | 29.5% | $802 | $1,085 | 35% |
| 55 - 64 | 26.9% | $859 | $1,094 | 27% |
| 65 + | 27.9% | $757 | $1,245 | 64% |
| Sex | ||||
| Male | 24.6% | $839 | $1,132 | 35% |
| Female | 30.0% | $708 | $917 | 30% |
| Education | ||||
| Male (non-Degree) | 15.8% | $730 | $858 | 18% |
| Male (Degree) | 34.0% | $1,155 | $1,378 | 19% |
| Female (non-Degree) | 16.8% | $599 | $666 | 11% |
| Female (Degree) | 41.2% | $905 | $1,045 | 15% |
| Race | ||||
| White | 27.4% | $806 | $1,056 | 31% |
| Black or African American | 25.7% | $657 | $755 | 15% |
| Asian | 28.7% | $944 | $1,144 | 21% |
| Hispanic or Latino Ethnicity | 22.3% | $677 | $934 | 38% |
Source: LMI Institute, State Certifications and Licenses Data Tables, 2019.
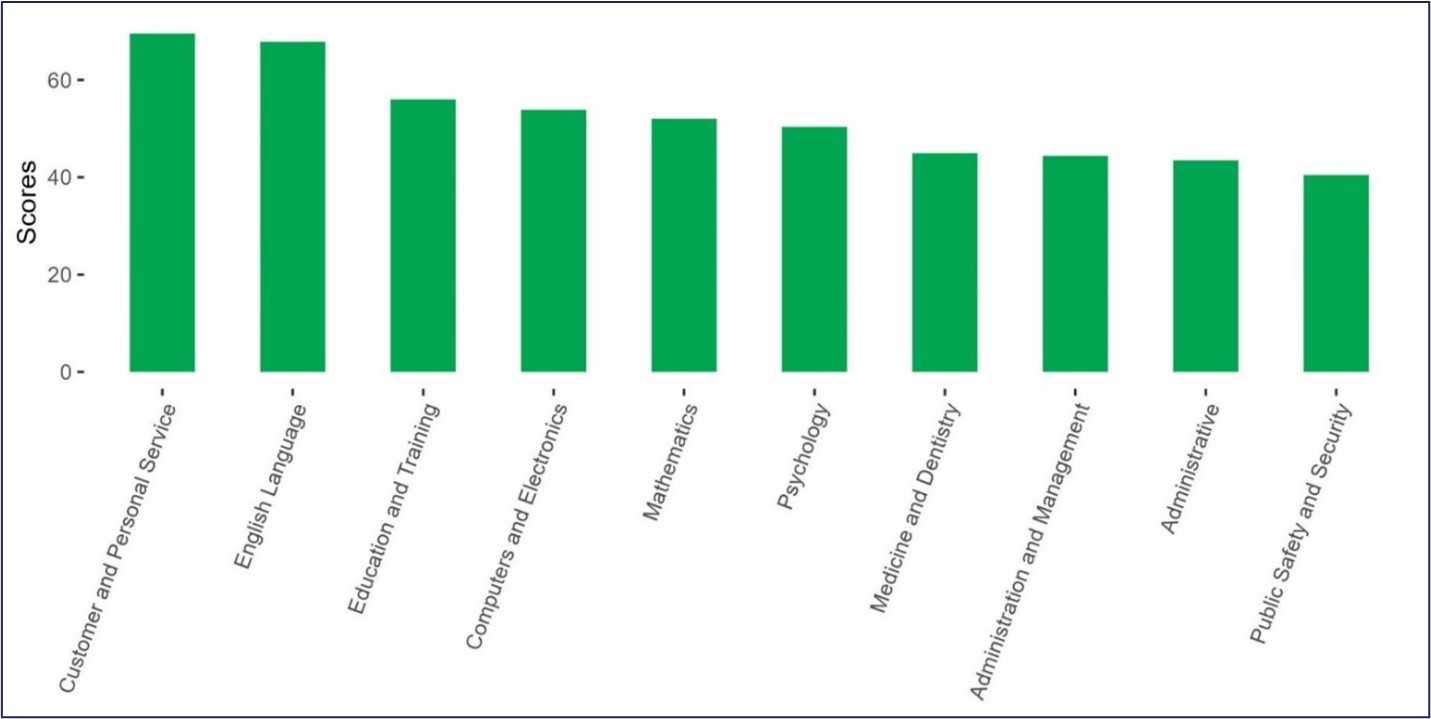
The needs of employers with respect to knowledge and technology skills are also available for each occupation in the labor market by the Occupational Information Network (O*Net) system (see https://www.onetonline.org/). By using the content in the O*NET database, it is possible to analyze the knowledge and technology skills needed for individual occupations, occupational groups, or targeted occupations. The following is an analysis of occupations that are emerging, have rapid growth, and have numerous job openings.
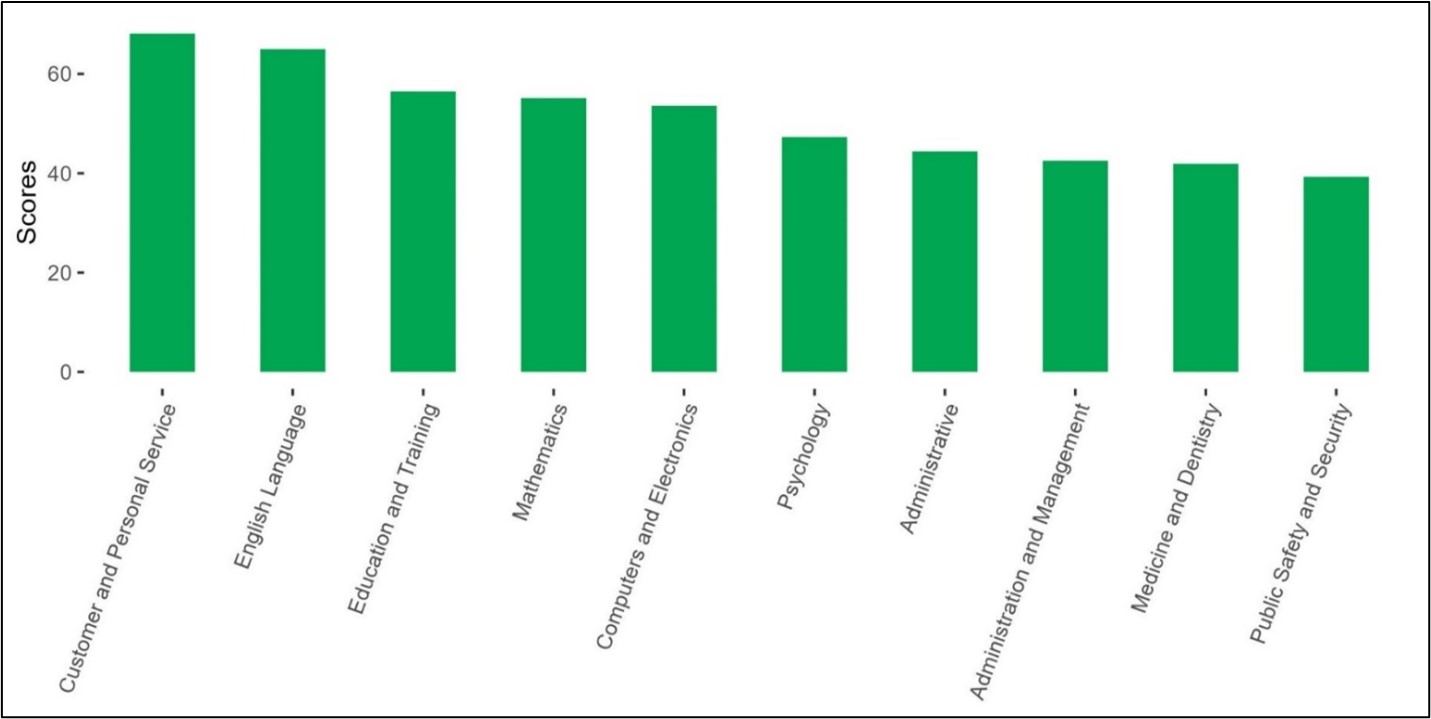
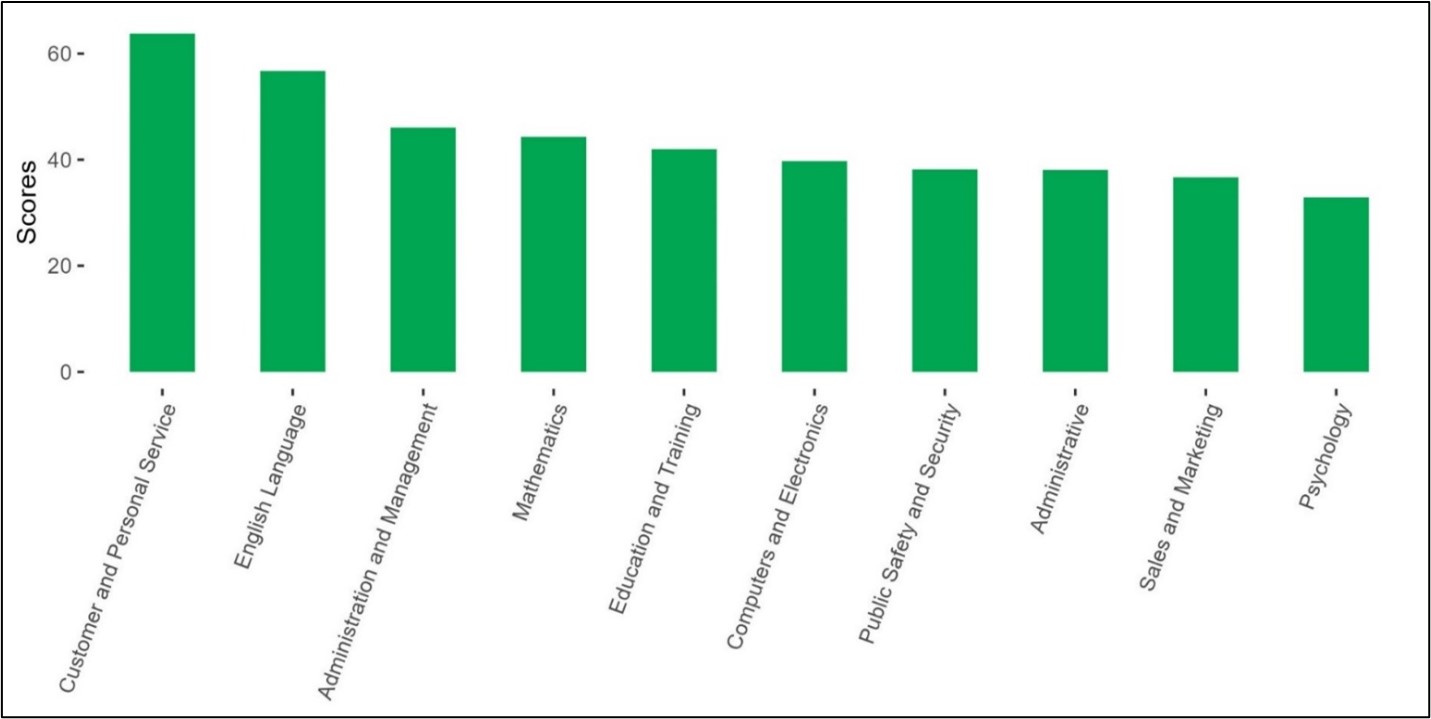
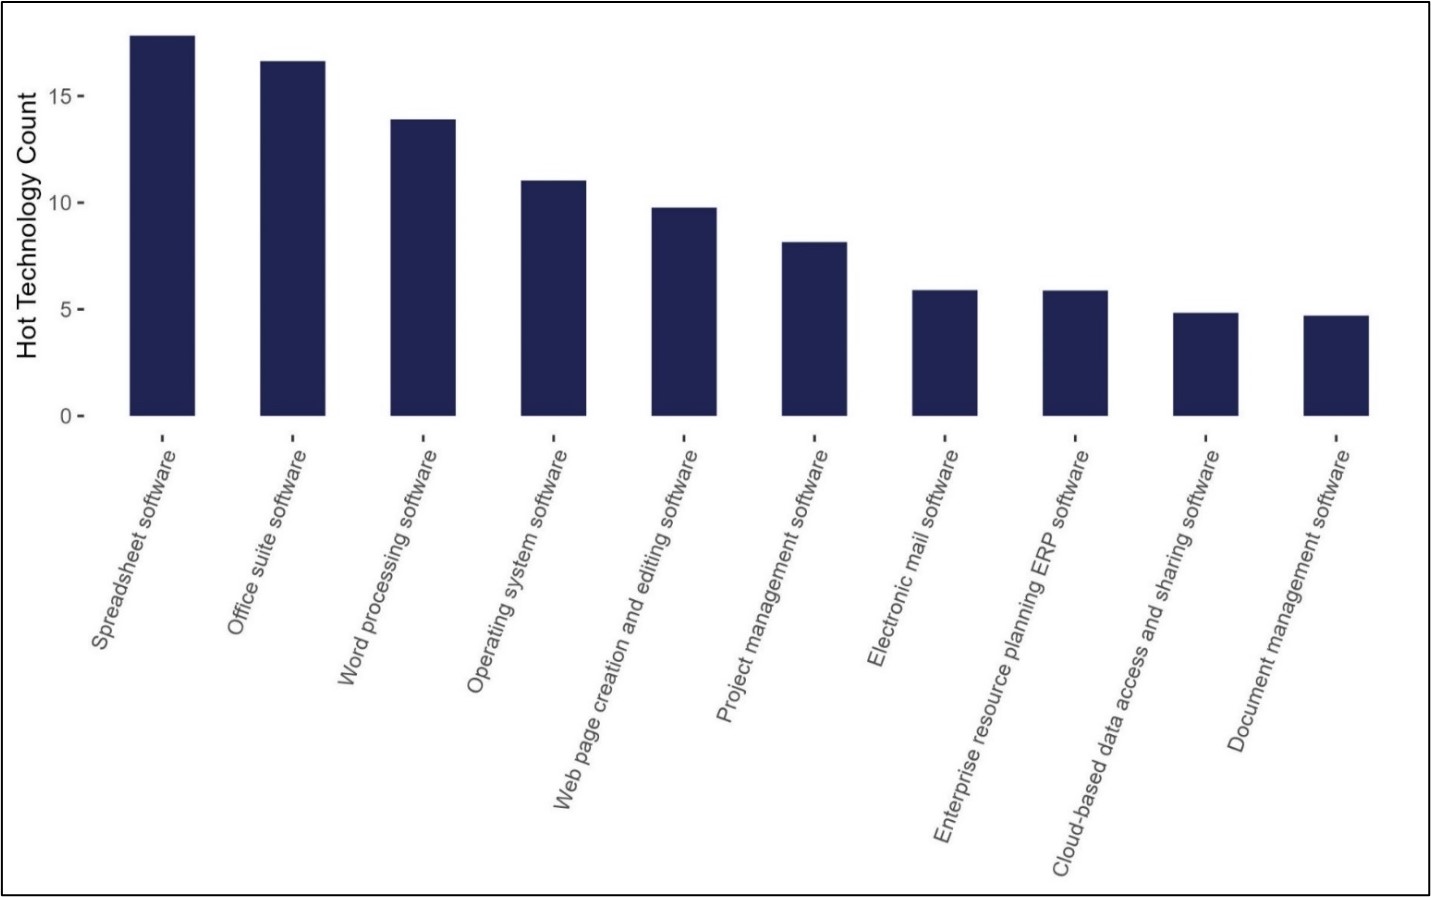
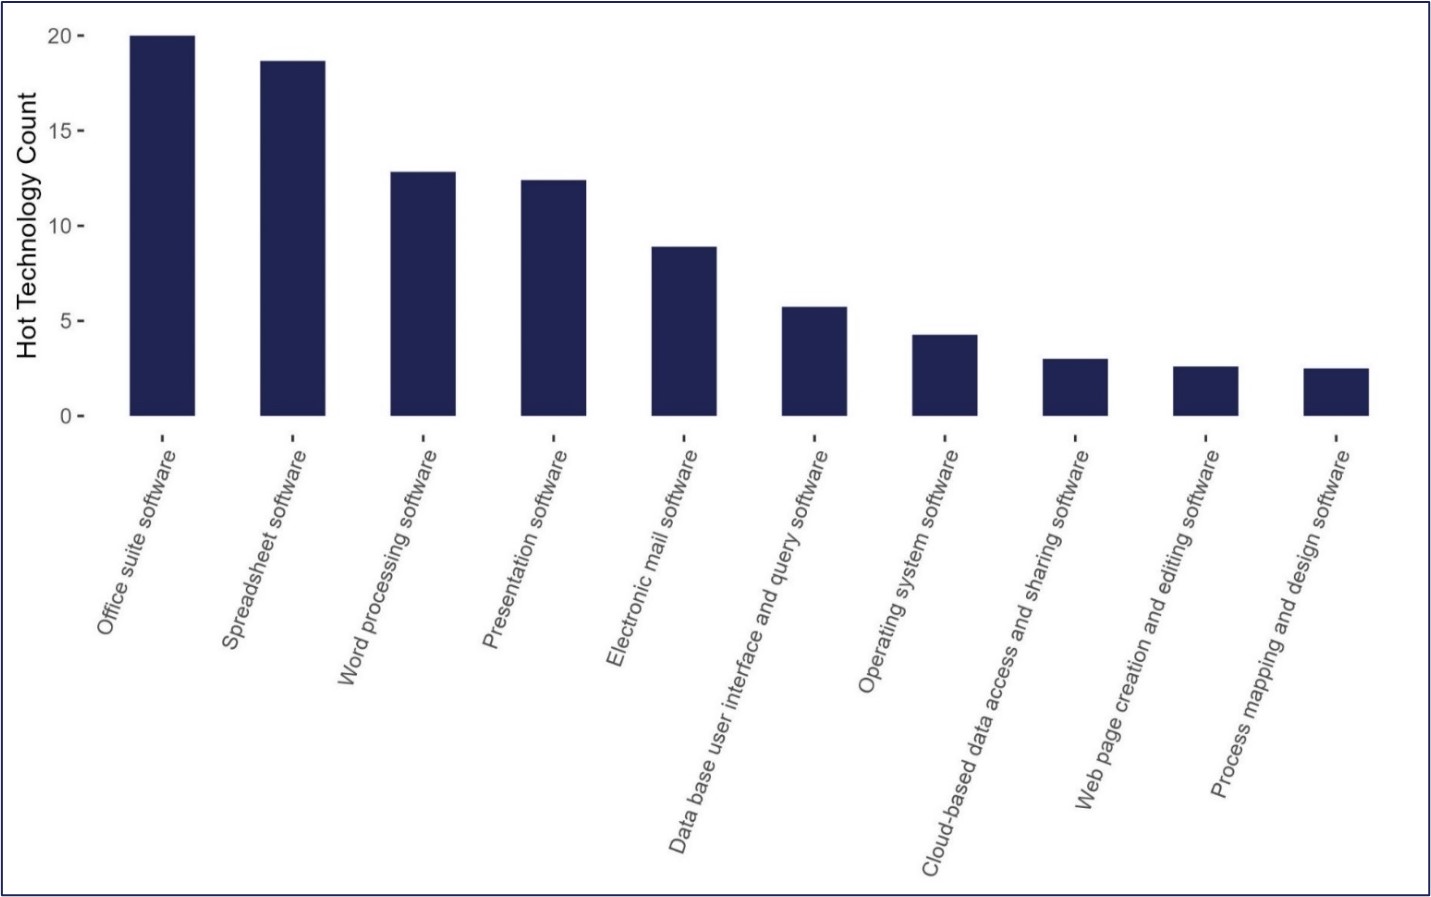
O*NET level and importance scores for the various knowledge topics were matched to the relevant occupational groups. The level and importance scores were added together and standardized to a 100-point scale. Technology requirements that are often included in employer job postings are referred to as hot technologies. These are added across the relevant occupational groups to show the top ten most frequently mentioned hot technologies used to measure technology skills.
The highest knowledge scores for emerging occupations are Customer and Personal Service, English Language, Education and Training, Mathematics, and Computers and Electronics (Figure 2.21). Over half of the top emerging occupations list software for Office suites, spreadsheets, presentations, word processing, and electronic mail as hot technology skills (Figure 2.22).
According to O*NET Education, Training, and Experience data, four of the top 20 emerging occupations require an associate degree (Physical Therapist Assistants, Occupational Therapy Assistants, Film and Video Editors, and Respiratory Therapists), two require a Bachelor’s degree (Information Security Analysts and Interpreters and Translators), and six require a Master’s degree (Statisticians, Physician Assistants, Health Specialties Teachers, Postsecondary, Nursing Instructors and Teachers, Postsecondary, Veterinarians, and Genetic Counselors).
Figure 2.21
Emerging Occupations Top Knowledge Scores
Source: O*NET and Florida Department of Commerce, Prepared by the Bureau of Workforce Statistics and Economic Research, August 2023.
Figure 2.22
Emerging Occupations Top Technology Skills

Source: O*NET and Florida Department of Commerce, Prepared by the Bureau of Workforce Statistics and Economic Research, August 2023.
According to O*Net Education, Training, and Experience, five of the top 20 occupations that will gain the most new job openings from 2022 to 2030 require the majority to have a bachelor’s degree or higher: Registered Nurses, General and Operations Managers, Marketing Research Analysts, Management Analysts, and Accountants and Auditors.
The highest knowledge scores for the occupations projected to have the most new job openings from 2022-2030 are Customer and Personal Service, English Language, Administration and Management, Mathematics, and Education and Training. More than 15 of the 20 occupations have spreadsheet and Office suite software as hot technologies.
Figure 2.23
Occupations with the Most Job Openings Top Knowledge Scores
Source: O*NET and Florida Department of Commerce, Prepared by the Bureau of Workforce Statistics and Economic Research, August 2023.
Figure 2.24
Occupations with the Most Job Openings Top Technology Skills
Source: O*NET and Florida Department of Commerce, Prepared by the Bureau of Workforce Statistics and Economic Research, August 2023.
According to O*Net Education, Training, and Experience, ten of the top 20 fastest-growing occupations from 2022 to 2030 require the majority to have a bachelor’s degree or higher: Nurse Practitioners, Information Security Analysts, Physician Assistants, Postsecondary Health Specialties Teachers, Postsecondary Nursing Instructors and Teachers, Veterinarians, Operations Research Analysts, Market Research Analysts, Speech-Language Pathologists, and Diagnostic Medical Sonographers.
The highest knowledge scores for occupations projected to grow the fastest between 2022 and 2030 are Customer and Personal Service, English Language, Education and Training, Computers and Electronics, and Mathematics (Figure 2.25). More than 15 of the 20 occupations have Office suite and spreadsheet software as hot technologies (Figure 2.26).
Figure 2.25
Rapid Growth Occupations Top Knowledge Scores
Source: O*NET and Florida Department of Commerce, Prepared by the Bureau of Workforce Statistics and Economic Research, August 2023.
Figure 2.26
Rapid Growth Occupational Top Technology Skills
Source: O*NET and Florida Department of Commerce, Prepared by the Bureau of Workforce Statistics and Economic Research, August 2023.