
Located in:
- II. Strategic Elements
The Unified or Combined State Plan must include a Strategic Planning Elements section that analyzes the State’s current economic environment and identifies the State’s overall vision for its workforce development system. The required elements in this section allow the State to develop data-driven goals for preparing an educated and skilled workforce and to identify successful strategies for aligning workforce development programs to support economic growth. Unless otherwise noted, all Strategic Planning Elements apply to Combined State Plan partner programs included in the plan as well as to core programs. Where requirements identify the term “populations”, these must include individuals with barriers to employment as defined at WIOA Section 3. This includes displaced homemakers; low-income individuals; Indians, Alaska Natives, and Native Hawaiians; individuals with disabilities, including youth who are individuals with disabilities; older individuals; ex-offenders; homeless individuals, or homeless children and youths; youth who are in or have aged out of the foster care system; individuals who are English language learners, individuals who have low levels of literacy, and individuals facing substantial cultural barriers; farmworkers (as defined at section 167(i) of WIOA and Training and Employment Guidance Letter No. 35-14); individuals within 2 years of exhausting lifetime eligibility under the Temporary Assistance for Needy Families program; single parents (including single pregnant women); and long-term unemployed individuals. Additional populations include veterans, unemployed workers, and youth, and others that the State may identify.
- a. Economic, Workforce, and Workforce Development Activities Analysis
The Unified or Combined State Plan must include an analysis of the economic conditions, economic development strategies, and labor market in which the State’s workforce system and programs will operate.
- a. Economic, Workforce, and Workforce Development Activities Analysis
II. a. 1. A. Economic Analysis
The Unified or Combined State Plan must include an analysis of the economic conditions and trends in the State, including sub-State regions and any specific economic areas identified by the State. This must include—
i. Existing Demand Industry Sectors and Occupations
Provide an analysis of the industries and occupations for which there is existing demand.
ii. Emerging Demand Industry Sectors and Occupations
Provide an analysis of the industries and occupations for which demand is emerging.
iii. Employers’ Employment Needs
With regard to the industry sectors and occupations identified in (A)(i) and (ii), provide an assessment of the employment needs of employers, including a description of the knowledge, skills, and abilities required, including credentials and licenses.
Current Narrative:
Existing Demand Industry Sectors and Occupations.
Three of the most important economic benchmarks used by Illinois to understand our economic position and to evaluate the effectiveness of our efforts to improve that position are overall economic production, employment and earnings. Examining these three indicators across the past ten years provides an uncommonly stark description of Illinois’ experience before, during and since the brief recession in 2020 at the start of the COVID-19 pandemic.
The main narrative told by the numbers in Table 1 is that Illinois has struggled to keep up with its neighboring states and the nation, both in terms of economic output and employment growth. Though the Great Lakes region (IL, IN, MI, OH and WI) has lagged the nation on both economic indicators, Illinois has been particularly challenged. Between 2012 and 2017, the state’s Gross Domestic Product (GDP) increased by 3.7 percent compared to the US GDP growth of 11.2 percent. The GDP in the Great Lakes Region was 6.5 percent for the same period. The story through 2022-- the latest year for which data are available--shows that even though GDP growth in Illinois picked up over the decade, it lagged both the Great Lakes Region and the nation. The last ten years have seen an increase in the state’s GDP of nearly 10 percent, which is less than the region’s growth of 14.0 percent and the nation’s 23.1 percent growth.
A look at the employment data suggests a similar struggle: in the five years ending 2022, Illinois’ employment contracted by 1.0 percent, reflecting the lingering impact of the pandemic on the labor market. In contrast, the Great Lakes region overall registered a slight contraction of -0.4%, while the U.S. experienced positive employment growth of 3.2 percent in these last five years.
Growth in earnings in Illinois presents a comparative bright spot: over the last five years, personal incomes among Illinoisans have increased almost as much as the region (47.4 percent vs 49.5 percent, respectively). However, earnings in the nation have surpassed both Illinois and the region, growing by 62.1 percent during that same time period.
Table 1: Illinois vs. Benchmark States vs. US:
Change in GDP, Employment & Earnings over 10 years

The situation described by these numbers provides the setting for continuing implementation of the Workforce Innovation and Opportunity Act (WIOA). The challenge for Illinois is to utilize WIOA and all of the partner programs to assist the state’s employers to increase productivity, employment and earnings throughout the state.
Table 2 shows projected employment demand through 2030 for major industry sectors across Illinois. It is expected that the largest number of job openings will be created within the leisure and hospitality, professional/business services and health care/social assistance sectors. Large percentage increases in employment are expected in these three sectors, as well as in transportation and warehousing and retail trade.
Table 2: Illinois Employment by Major Industry Sector

Projections Source: IL Department of Employment Security Statewide Long-Term Employment Projections
The location quotient for selected major industries in each county and EDR is provided on the accompanying maps (see below). These maps indicate where each industry has a comparative advantage versus the rest of the United States, based on private-sector employment. A value of 1.0 indicates the industry is at the national level, values greater than 1.0 indicate the industry has a comparative advantage versus the nation, and values less than 1.0 indicate the industry has a comparative disadvantage versus the nation. The degree of comparative advantage or disadvantage increases as the value deviates from 1.0.
Regions with a comparative advantage in a particular sector will be encouraged and supported in efforts to leverage their situation. Regions without a comparative advantage in a sector will be encouraged and supported in efforts to understand the root causes and use this information to target resources at sectors where the outcomes look most promising.
The following table provides a ranking of sectors by LQ and by the Percent Change in Employment depicted on the prior maps.

Four sectors, Manufacturing, Financial Activities, Professional & Business Services and Trade, Transportation & Utilities have an LQ indicating a comparative advantage for Illinois. Two sectors, Education and Health and Leisure & Hospitality have an LQ at or greater than 0.90, which indicates they are near the national level. Information and Construction are the next level at 0.81 and 0.75, respectively. The one true outlier is Natural Resources and Mining, with an LQ of 0.35.
Note that the Leisure & Hospitality sector increased by nearly 42% in employment during the two-year timeframe, a rate more than triple that of the next highest sector. This unusually high increase is a direct reflection of the recapture of the thousands of jobs lost during the early months of the pandemic. It should be noted that at this point in the economic recovery since the pandemic, this sector has regained x% of its workers.
The analysis of Location Quotients and Change in Employment is merely the first step in identifying priority sectors. The next section of the Unified State Plan covers how industries are categorized as Leading, Emerging or Maturing and how that information is used to help determine priority sectors.
Table 4 shows projected employment demand through 2030 for major occupational sectors throughout Illinois. The largest numbers of new jobs are expected to be created within occupational categories of food preparation and service, transportation and material moving, management occupations, and business and financial operations occupations. Large numbers of job openings (including replacement jobs) are expected in those occupations, as well as healthcare support occupations and sales and related occupations. Regardless of overall employment change, significant numbers of job openings are still expected annually due to replacements of existing workers who will transfer or exit from the labor force.
Table 4: Illinois Employment by Major Occupational Sector

Emerging Demand Industry Sectors and Occupations.
The State Plan must contain an assessment of sectors and industries that are leading, emerging and maturing across the state as a whole, as well as in the sub-state regions. To start this analysis, the Interagency State Data Team used the standard grouping of Sectors & Industries from the Bureau of Labor Statistics, show in the following table:

For each of these Sectors’ Industries, the team looked at the following data points:
- Number of workers
- % share of all Illinois workers
- 12-year projected net change
- Location Quotient (Illinois activity vs U.S.)
Location Quotient is a calculation comparing the concentration of sector activity (number of workers, number of establishments, etc.) of a given region compared to a larger region. A value above 1.0 indicates activity is more concentrated than in the larger area, and a value below 1.0 indicates activity is less concentrated. The farther away from 1.0, the greater the difference. For example, a location quotient of 5.0 indicates a much higher concentration of activity than a value of 1.5. For the statewide analysis, sectors compared activity in Illinois to the national totals.
Based on these factors, each sector was categorized as one of the following:
| Category | Number of Workers | Projected Change | Location Quotient |
|---|---|---|---|
| LEADING | High/Medium | Net Growth | Above 1.0 |
| EMERGING | Medium/Low | Net Growth | Below 1.0 |
| MATURING | High/Medium | Net Loss | Below 1.0 |
LEADING industries are identified as those that are expected to grow during the projection period and which are important within the state (i.e., have a location quotient greater than 1.0).
EMERGING industries are identified as those that are not strongly represented in the current economy (i.e., have a location quotient that is less than 1.0) but are expected to grow during the projection period.
MATURING industries are identified as those that are important within the state but are not expected to grow during the projection period.
Each of these categories is significant for the economy, job growth and availability and are therefore important for the planning of WIOA and partner programs during the period of this Unified State Plan. In summary, LEADING industries are those that will likely provide the largest numbers of job openings due to their combination of size and growth; EMERGING industries are those that are currently small but are quickly gaining in economic importance and job creation; and MATURING industries are those which have slower job growth but still have hefty presences in the economy and will continue to create significant job openings, if only through attrition (e.g., accelerating retirements).
Tables 5, 6 and 7 display the results of categorizing (according to this methodology) the major industries from Table 3. Major industry categories that are not included in one of these three categories are now dropped from the analysis.
Table 5: LEADING Major Industry Sectors Statewide

Table 6: EMERGING Major Industry Sectors Statewide
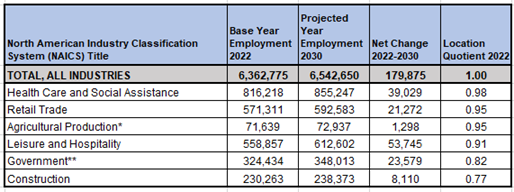
Table 7: MATURING Major Industry Sectors Statewide

The regional planning process utilizes the same analytics steps to assist regional teams to identify leading, emerging and maturing industries within each region. The regional planning process includes the development of crosswalks between the detailed (3-digit) industries and the occupational pathway for each region. The results of this crosswalk pinpoint occupations related to the detailed industries identified statewide as leading, emerging, and maturing. These are considered starting points for conversations with employers regarding critical occupations within their industries during the complete regional planning process.
Table 8 below summarizes the leading, emerging and maturing sectors preliminarily identified for each of the statewide Economic Development Regions based on these current and projected employment data, along with a brief comment on each region.
Table 8: LEADING, EMERGING and MATURING Industry Sectors Identified by Economic Development


As mentioned in the analysis of existing demand industries, the selection of priority sectors considered if the data indicated a sector was LEADING, EMERGING or MATURING. In addition, we looked at the status of all sectors in each of our ten regions. Giving greater weight to LEADING and EMERGING sectors, those with a larger geographic spread were rated higher than those less widespread across the state.
The following table displays the LEADING and EMERGING statewide sectors ranked following the application of geographic weighting.
Table 9: Sector Ranking with Regional Weighting


Regardless of whether an industry is in an existing or emerging sector, the employment opportunities for people with disabilities are more changing than what people without disabilities face. In Illinois, considering people with disabilities who are between the ages of 18-64 years, only 36% are employed. Whereas 75% of people without disabilities are employed. In 2023, those without a disability are three times more likely to be employed. The average annual employment rate for people with disabilities was 22.5% compared to a rate of 65% for those who are not disabled.
In 2023, barriers to employment range from: a physical work environment that can be difficult to navigate; a lack of assistive tools that provide needed accommodations to complete work tasks; and negative attitudes in the workplace that are unsupportive. In short, there is lack of programs, services, and systems to support people with disabilities in obtaining and maintaining employment. Employers fear a disruption and the added expenses that believe will be required accommodating employees with disabilities in the workplace.
Employers’ Employment Needs
To identify some recurring employer needs in the major employment sectors, we examine job postings analytics from Lightcast (formerly Emsi-Burning Glass). Lightcast analyzes online job postings from multiple platforms (e.g., LinkedIn, Indeed, Monster) and identifies skills and certifications frequently mentioned by type of employer or type of job opening. The data includes separate distinctions for general, common skills such as communications, and more occupation-specific, specialized skills. Care must be taken when viewing job postings analytics, given that some sectors do not typically recruit candidates via a public job ad, e.g., hiring via recruiters. Further, some skills frequently appear in job postings for general screening purposes. Finally, given the varied staffing needs and fragmented nature of skills required within a sector, the most prevalent specialized skills and certifications do not necessarily translate to the most frequent occupational titles. For example, CPA certification appears frequently regardless of sector, because most industries require accountants.
| Sector | Example Occupations | Common Skills | Specialized Skills | Certifications |
|---|---|---|---|---|
| Transportation & Warehousing | Heavy and Tractor-Trailer Truck Drivers, Laborers and Freight/Stock/Material Movers, Customer Service Representatives | Communications, Customer Service, Operations | Warehousing, Truck Driving, Forklift Truck | CDL, Tanker Endorsement, Hazmat Endorsement |
| Utilities | Electrical/Electronics Technician, Business/Management Analyst, Project Manager | Communications, Management, Operations | Project Management, Auditing, Computer Science | MBA, Professional Engineer License, Project Management Certification |
| Professional & Business Services | Software Developers, Sales representatives of Wholesale and Manufacturing products, All Other Computer Occupations | Communications, Management, Leadership | Project Management, Accounting, Marketing | MBA, Project Management Professional Certification, CPA |
| Health Care & Social Assistance | Registered Nurses, Home Health and Personal Care Aides, Nursing Assistant | Communications, Customer Service, Management | Nursing, medical records, nursing care, CPR | RN, Basic Life Support, CPR |
| Other Services | Hairdressers & Cosmetologists, Childcare Workers, Customer Service Representatives | Communications, Customer Service, Management | Marketing, Cosmetology, Project Management, Housekeeping | Barber License, CPR, Automotive Service Excellence |
| Government | Police Officers, Registered Nurses, Secretaries & Administrative Assistants | Communications, Management, Operations | Law enforcement, rehabilitation, international laws | Certified Loss Control Specialist, RN, Airline Transport Pilot License |
| Construction | Construction Managers, Construction Laborers, Janitors and Cleaners | Communications, Customer Service, Management | Project Management, Subcontracting, HVAC | CDL, CPR/First Aid, 30-hour OSHA General Industry Card |
| Manufacturing | Software Developers, Production Workers, Managers | Communications, Management, Leadership | Auditing, New Product Development, Process Improvement | MBA, Project Management Professional Certification, Forklift Certification |
| Wholesale Trade | Laborers and Material Movers, Heavy and Tractor-Trailer Truck Drivers, Software Developers | Communications, Sales, Customer Service | Warehousing, Marketing, Merchandising | CDL, MBA, Forklift Certification |
| Leisure & Hospitality | Fast Food and Counter Workers, Food Service Managers, Waiters and Waitresses | Customer Service, Communications, Management | Restaurant Operation, Food Safety and Sanitation, Cash Handling | ServSafe Certification, Food Handler's Card, CPR |
| Retail Trade | Retail Salespersons, First-Line Supervisors of Retail Sales Workers, Stockers and Order Fillers | Customer Service, Sales, Communications | Merchandising, Selling Techniques, Cash Register | Valid Driver's License, Certified Pharmacy Technician, Registered Pharmacist |
| Financial Activities | Software Developers, Securities/Commodities/Financial Services Sales Agents, Customer Service Representatives | Communications, Management, Customer Service | Marketing, Financial Services, Project Management | MBA, FINRA Series 7 for General Securities Representative, CPA |
| Educational Services | Postsecondary Teachers, Registered Nurses, Postsecondary Education Administrators | Communications, Teaching, Research | Marketing, Project Management, Student Services | Teaching Certificate, Board Certification, First Aid/CPR/AED/basic life support |
| Information | Retail Salespersons, Sales Representatives, Software Developers | Communications, Sales, Customer Service | Marketing, Project Management, Selling Techniques | BMBA, Project Management Professional, Certified Information Systems Security Professional |
Source: Lightcast, job postings analytics by industry supersector, July 2022-July2023.