
Located in:
- II. Strategic Elements
The Unified or Combined State Plan must include a Strategic Planning Elements section that analyzes the State’s current economic environment and identifies the State’s overall vision for its workforce development system. The required elements in this section allow the State to develop data-driven goals for preparing an educated and skilled workforce and to identify successful strategies for aligning workforce development programs to support economic growth. Unless otherwise noted, all Strategic Planning Elements apply to Combined State Plan partner programs included in the plan as well as to core programs. Where requirements identify the term “populations”, these must include individuals with barriers to employment as defined at WIOA Section 3. This includes displaced homemakers; low-income individuals; Indians, Alaska Natives, and Native Hawaiians; individuals with disabilities, including youth who are individuals with disabilities; older individuals; ex-offenders; homeless individuals, or homeless children and youths; youth who are in or have aged out of the foster care system; individuals who are English language learners, individuals who have low levels of literacy, and individuals facing substantial cultural barriers; farmworkers (as defined at section 167(i) of WIOA and Training and Employment Guidance Letter No. 35-14); individuals within 2 years of exhausting lifetime eligibility under the Temporary Assistance for Needy Families program; single parents (including single pregnant women); and long-term unemployed individuals. Additional populations include veterans, unemployed workers, and youth, and others that the State may identify.
- a. Economic, Workforce, and Workforce Development Activities Analysis
The Unified or Combined State Plan must include an analysis of the economic conditions, economic development strategies, and labor market in which the State’s workforce system and programs will operate.
- a. Economic, Workforce, and Workforce Development Activities Analysis
II. a. 1. A. Economic Analysis
The Unified or Combined State Plan must include an analysis of the economic conditions and trends in the State, including sub-State regions and any specific economic areas identified by the State. This must include—
i. Existing Demand Industry Sectors and Occupations
Provide an analysis of the industries and occupations for which there is existing demand.
ii. Emerging Demand Industry Sectors and Occupations
Provide an analysis of the industries and occupations for which demand is emerging.
iii. Employers’ Employment Needs
With regard to the industry sectors and occupations identified in (A)(i) and (ii), provide an assessment of the employment needs of employers, including a description of the knowledge, skills, and abilities required, including credentials and licenses.
Current Narrative:
General Economic Conditions
Figure 1: Percent Share of Michigan Online Job Advertisements by Michigan Prosperity Region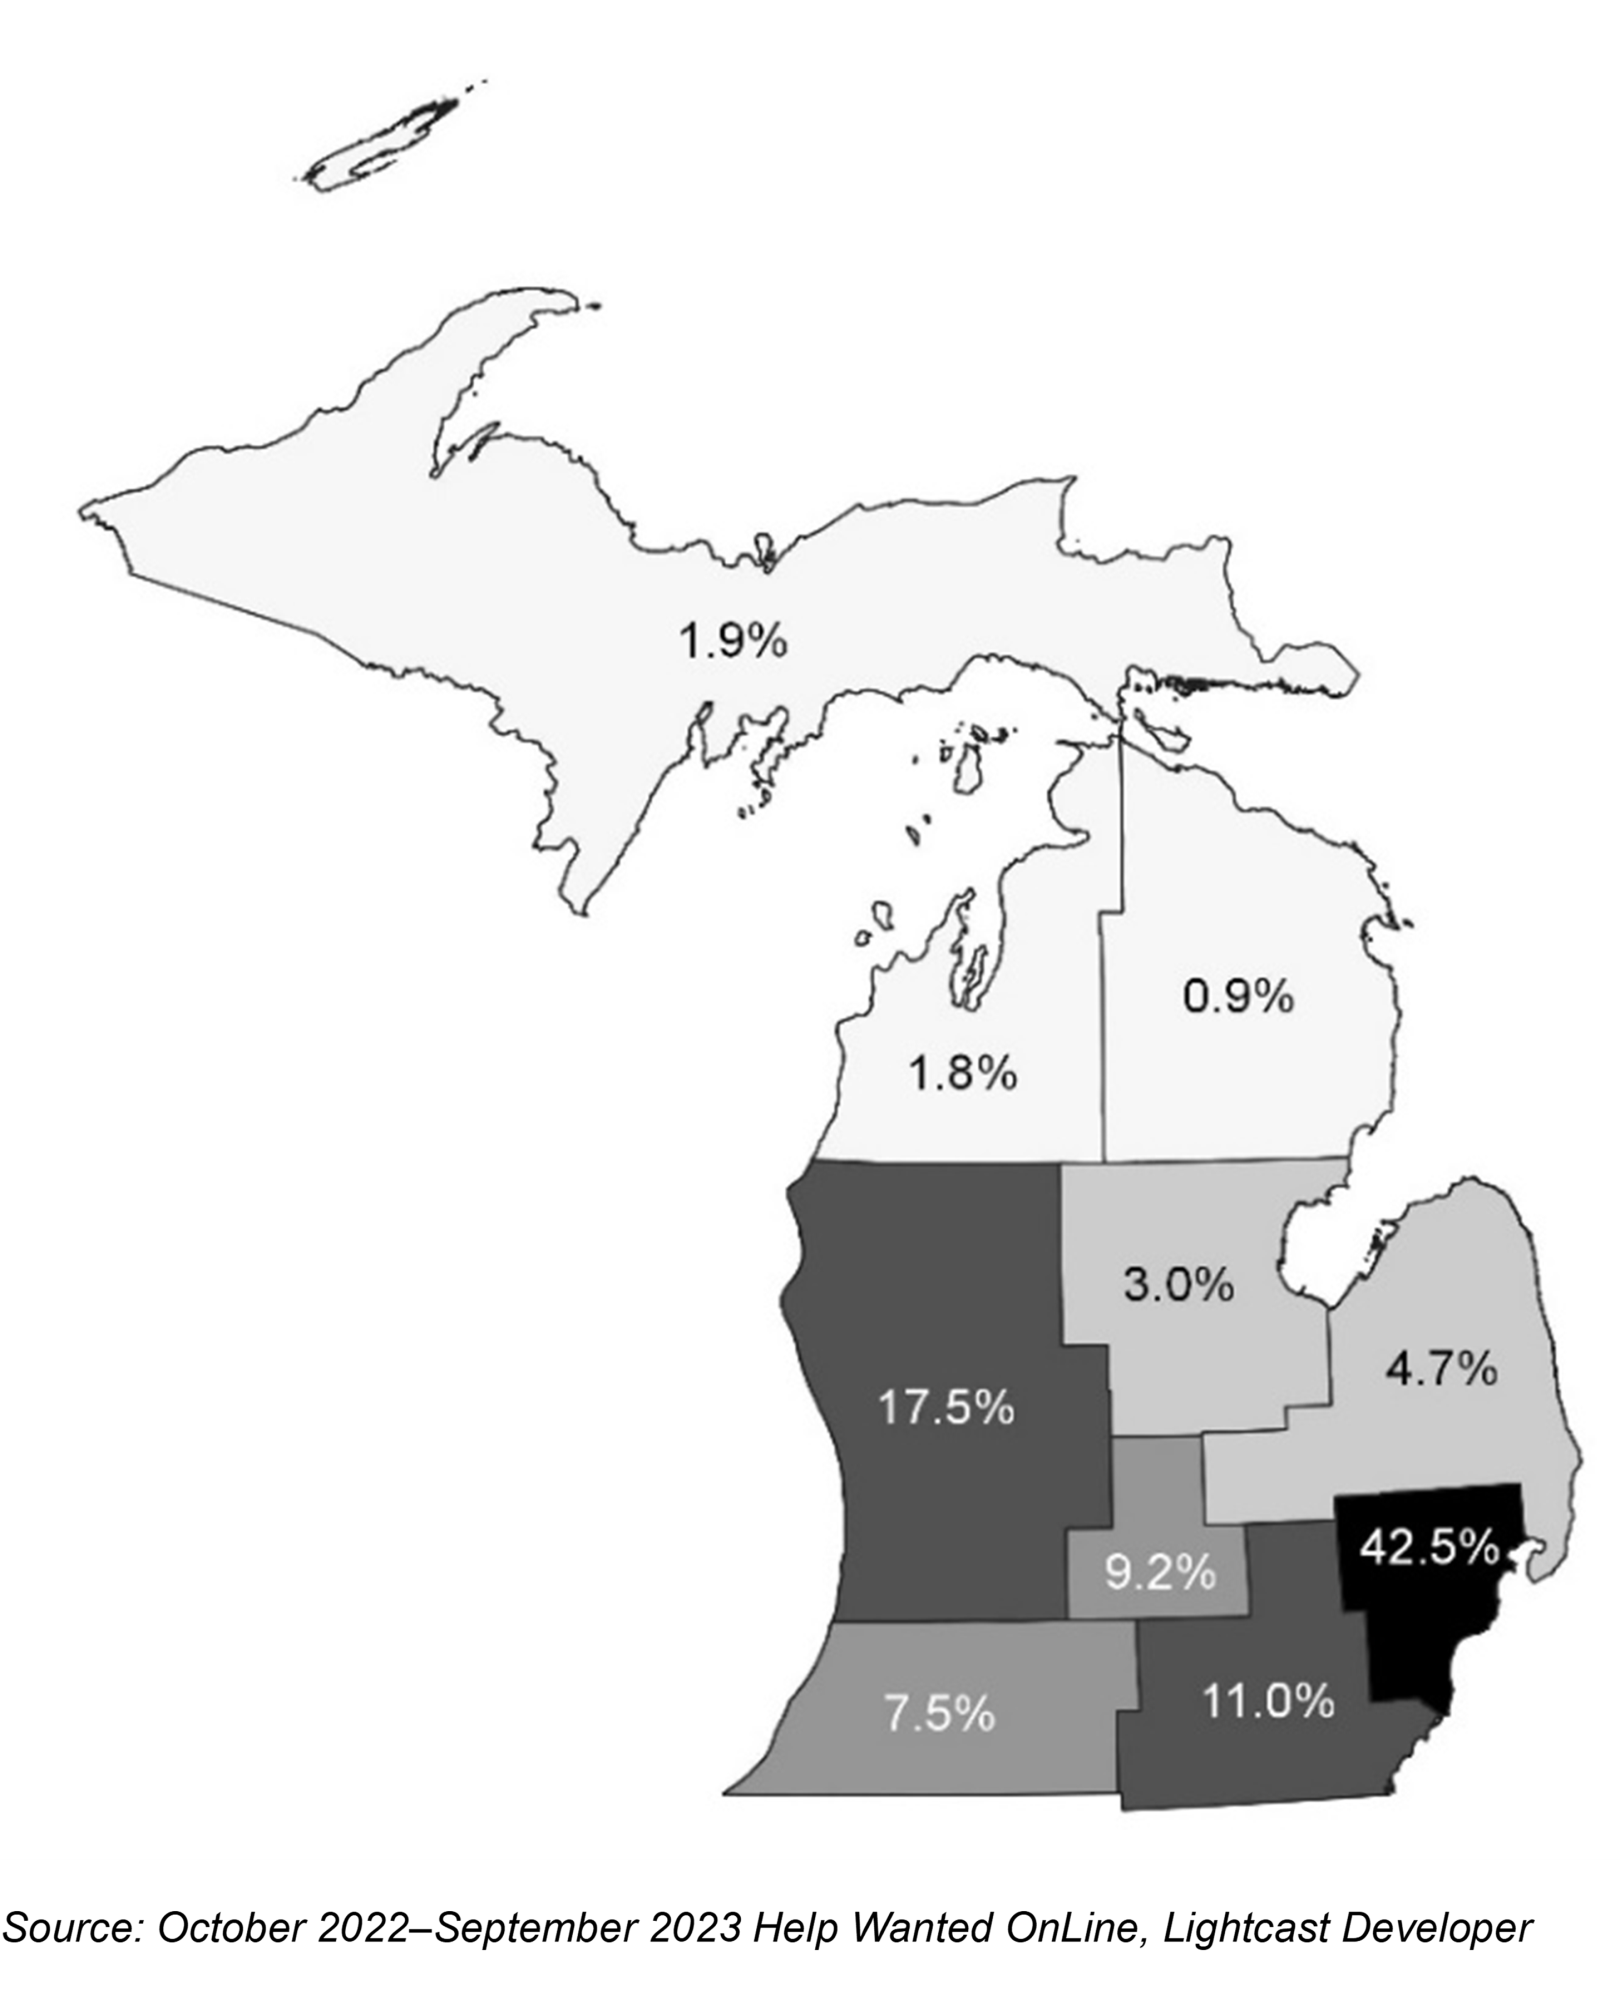
The Help Wanted OnLine job ad data series by Lightcast Developer, provides detailed information on historical and current online job postings. There were nearly 925,400 online job advertisements in Michigan throughout the past 12-month period. Of these, approximately 2.0 percent (18,300 ads) do not have a specific region of the state assigned. Most online advertisements for jobs in Michigan come from the Detroit Metro region, which is also the most populous in the state. The northern most regions of the state are more rural. and less populated, which in turn, can lead to the lower overall shares of online job postings in the state as shown in Figure 1.
Figure 2: Annual Unemployment Rates by Michigan Prosperity Region
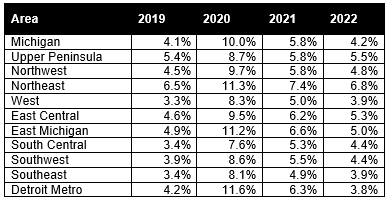
Source: Local Area Unemployment Statistics, Michigan Center for Data and Analytics, Michigan Department of Technology, Management, & Budget, U.S. Bureau of Labor Statistics
Unemployment rates vary throughout the prosperity regions due to a variety of factors such as demographics, educational attainment levels, total population, and more. During 2020, every region of the state, apart from the Upper Peninsula and Northeast, experienced an unemployment rate more than two times greater than their 2019 average. Since then, unemployment rates have continued to decrease in all areas of the state and, as of 2022, all are within a 1.0 percentage point difference of their pre-pandemic rate. Only the Detroit Metro region has an average unemployment rate lower than their 2019 rate.
Figure 3: Total Projected 2020–2030 Employment Growth, Average Annual Openings, and Median Hourly Wages in Michigan and Prosperity Regions
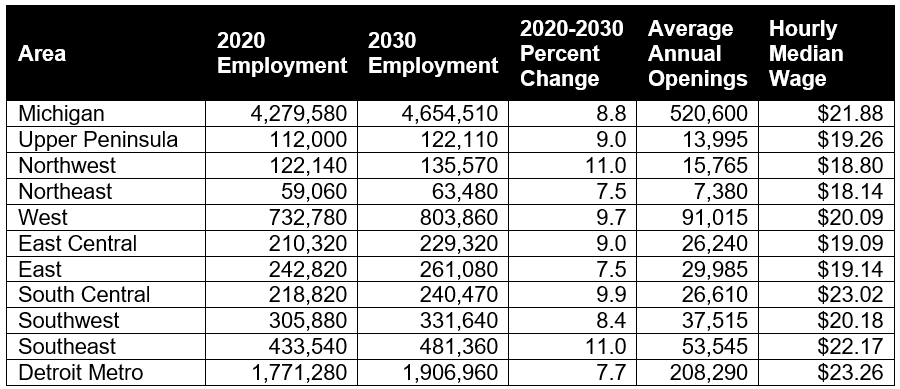
Source: 2020-2030 Long-term Occupational Projections, Michigan Center for Data and Analytics, Michigan Department of Technology, Management, & Budget; 2022 Occupational Employment and Wage Statistics, Michigan Center for Data and Analytics, U.S. Bureau of Labor Statistics
In 2023, the Michigan Center for Data and Analytics released the regional 2020 to 2030 projections as a
follow-up to the statewide long-term projections released one year prior. With a base year of 2020, much of the employment growth over the 10-year period can be attributed to post-pandemic recovery. Many prosperity regions are expected to have percentage growths that are greater than the statewide average of 8.8 percent and all are expected to have a notable number of average annual openings. The rightmost column of Figure 3 displays median hourly wages by area. Only 5 of the 10 regions have median hourly wages above $20 per hour. The statewide median wage is just under $22 per hour and only three regions, South Central, Southeast, and Detroit Metro, surpass this median.
Existing Demand – Industry Sectors and Occupations
The Michigan Center for Data and Analytics provides an online job advertisement dashboard. The dashboard is updated monthly and provides detailed information for each of the Michigan Prosperity Regions, as well as for the state itself. View Dashboard.
Figure 4: Top Ten Industry Sectors by Total Online Job Advertisements in Michigan

Source: October 2022–September 2023 Help Wanted OnLine, Lightcast Developer
Figure 4 displays the distribution of job advertisements in Michigan by the top industry sectors. Over the past 12-months, Healthcare and Social Assistance was the industry with the greatest amount of job postings in the state. Following behind were Retail Trade and Manufacturing. Combined, the top three industry sectors account for more than one-third (36 percent) of all advertisements in Michigan over the last year.
Figure 5: Top 15 Detailed Occupations by Total Online Job Advertisements in Michigan
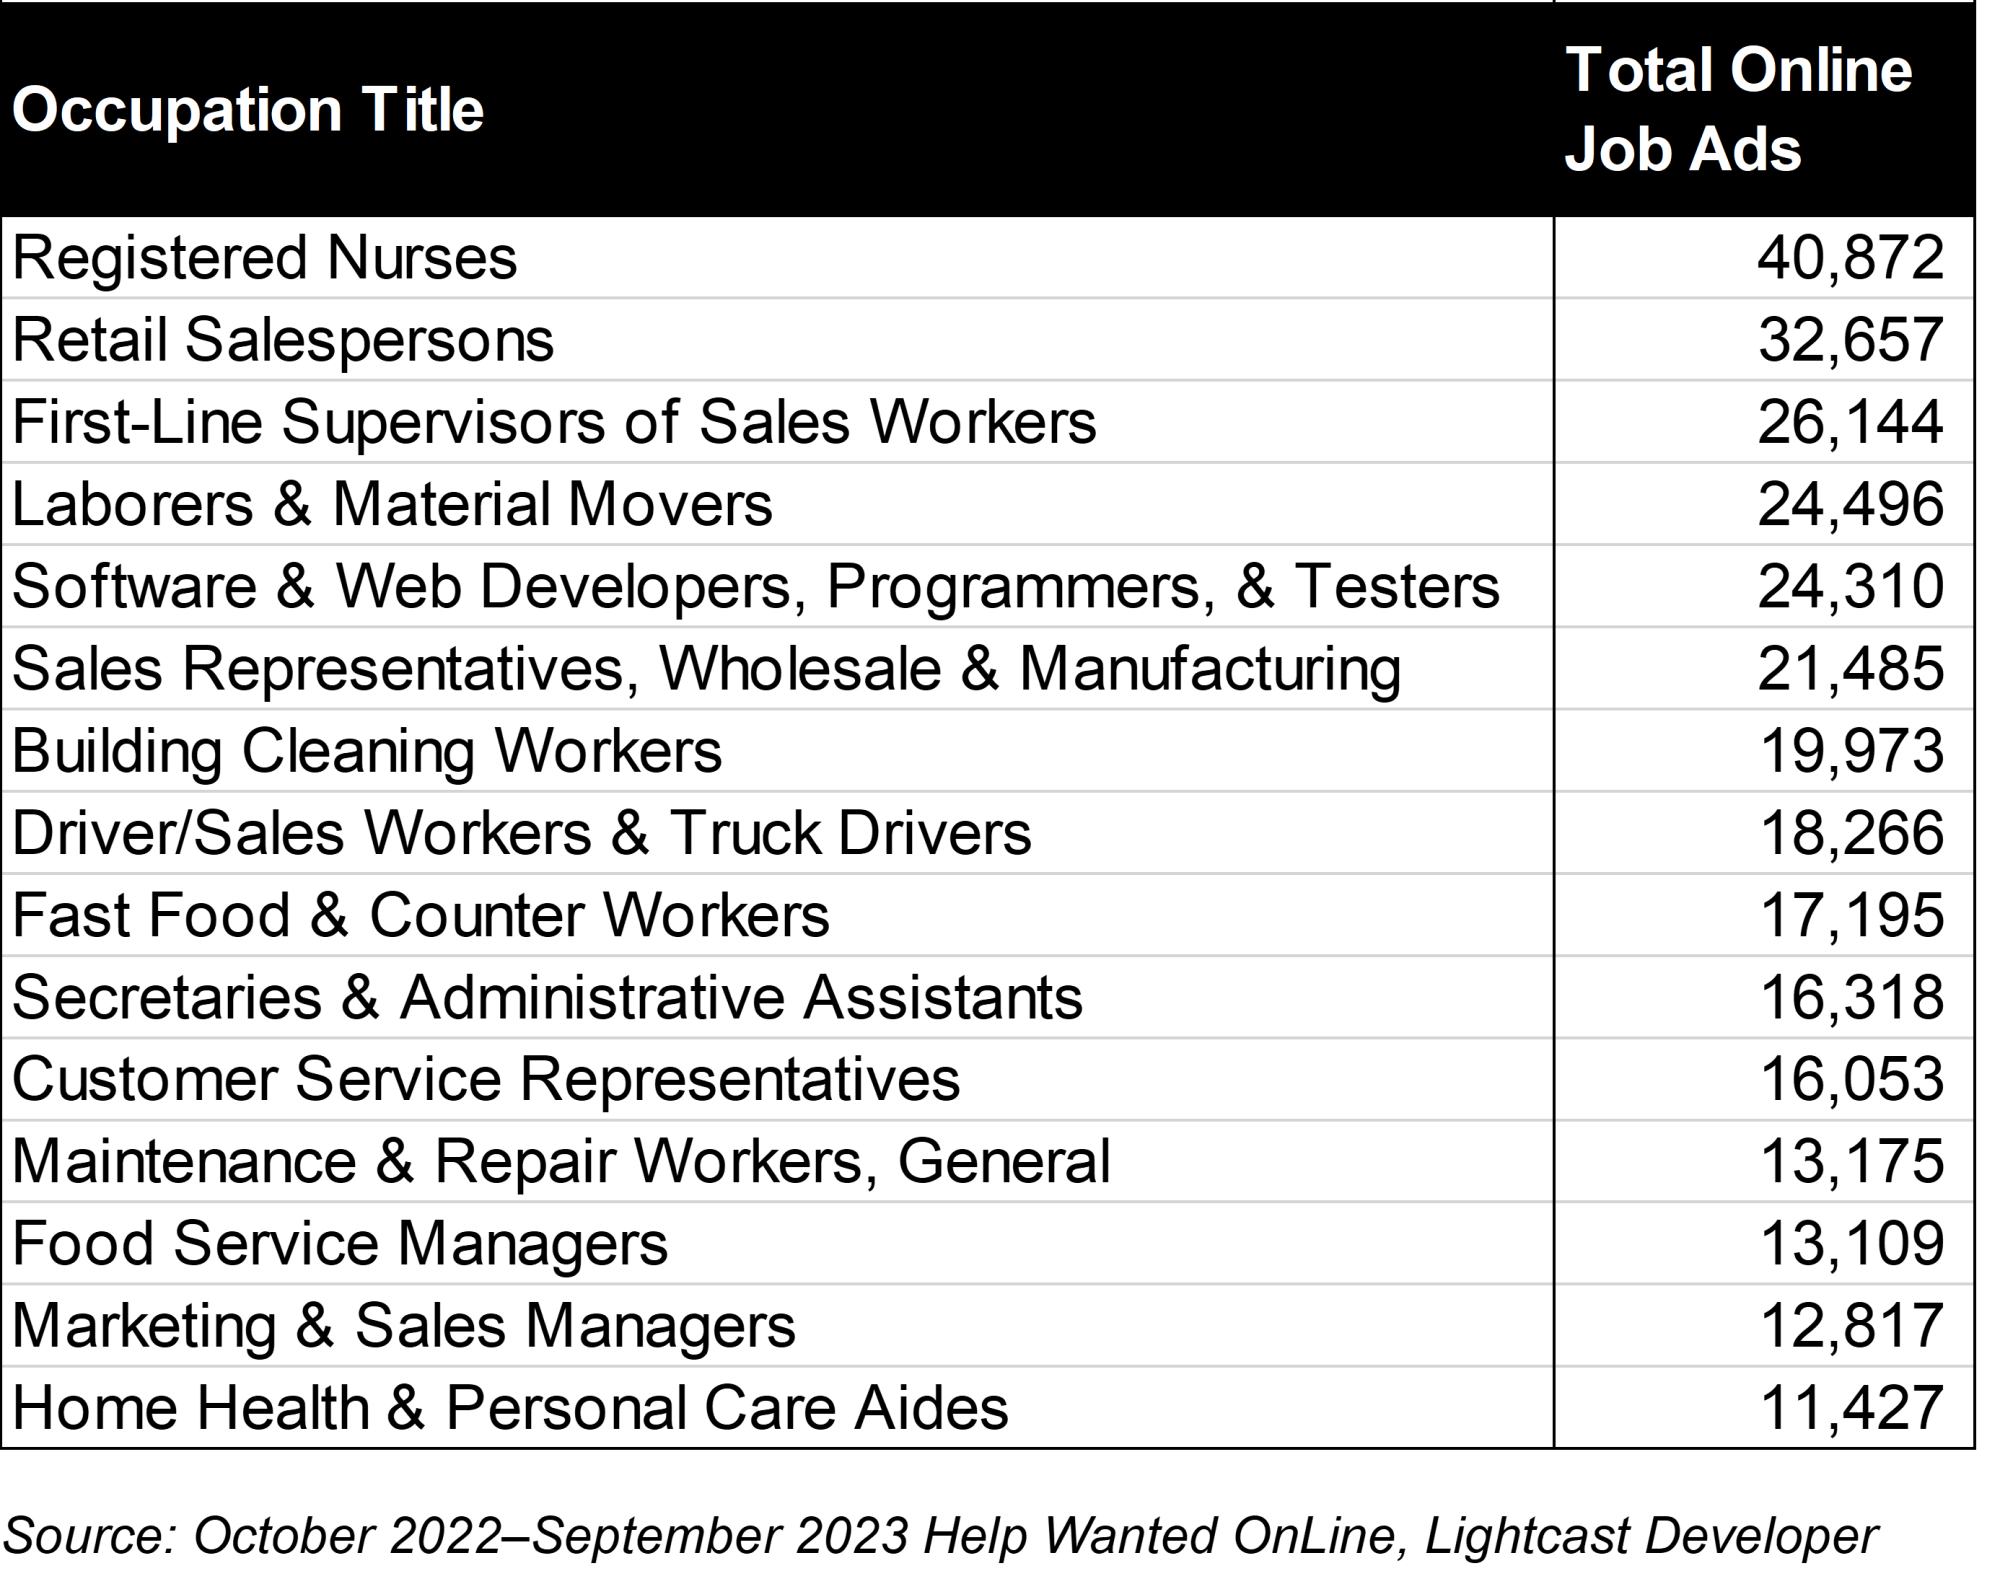
Registered nurses have historically been among the topmost posted occupations in Michigan. With nearly 41,000 online job postings in the past 12 months, the occupation accounts for 4.4 percent of all postings in the state. Retail Salespersons is the only other occupation to surpass 30,000 postings in the last year and while still high in volume, accounts for less than 4 percent (3.5 percent) of the ads statewide. Combined, the top 15 occupations hold 33 percent of all the online job ads in Michigan.
Emerging Demand – Industry Sectors and Occupations
Figure 6: Long-Term Projections (2020–2030) for Industry Sectors in Michigan
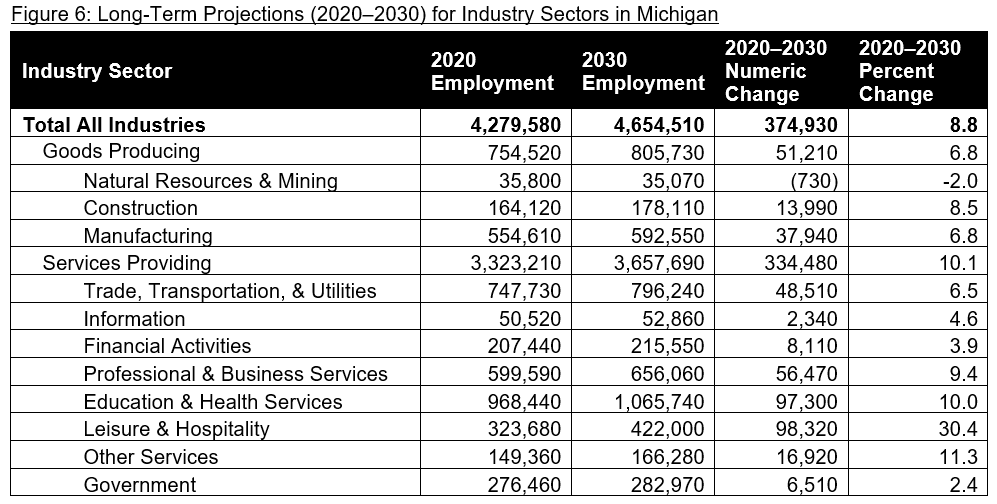
Source: 2020-2030 Long-term Industry Projections, Michigan Center for Data and Analytics, Michigan Department of Technology, Management, & Budget
Figure 6 displays long-term projections by industry sector in Michigan. The sectors are split between goods producing and services providing. With a base year of 2020, the industries that fall under services providing understandably have an average growth rate (10.1 percent) that is more than three percentage points higher than that of goods producing industries (6.8 percent). This is largely due to the Leisure and Hospitality industry sector, which was among the hardest hit during the pandemic. Between 2020 and 2030, this sector is expected to grow by more than 30 percent. Most of this growth can be attributed to employment recovery.
Figure 7: Long-Term Projections (2020–2030) for Occupation Groups in Michigan

Source: 2020-2030 Long-term Occupational Projections, Michigan Center for Data and Analytics, Michigan Department of Technology, Management, & Budget
Figure 7 displays occupation groups in Michigan by greatest to least projected employment change during 2020–2030. Unsurprisingly, the top two occupation groups by employment growth fall under the Leisure and Hospitality industry. Although two of the occupation groups (Office and Administrative Support and Farming, Fishing, and Forestry) are expected to experience employment loss over the 10-year period, it is important to note that both groups are still expected to have a high number of average annual openings.
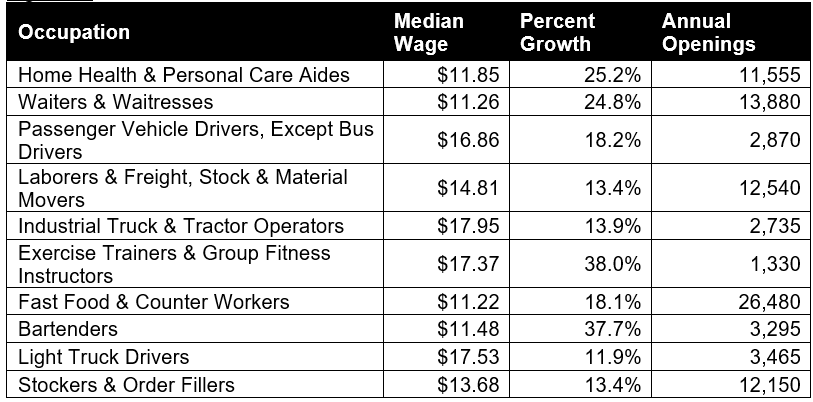
Figure 8 note:These occupations are chosen by a favorable mix of projected long-term job growth, projected annual openings, and median wages. They do not necessarily reflect current hiring demand. The y-axis on each of the following charts displays median hourly wages. The dashed line represents the 2021 statewide median hourly wage of $21.73. The x-axis represents the percent projected employment growth (2020–2030). Lastly, the size of the bubble correlates with the volume of expected average annual openings for an occupation.
Figure 8a: High School Diploma or Equivalent and Short-Term Training Top Ten Occupations
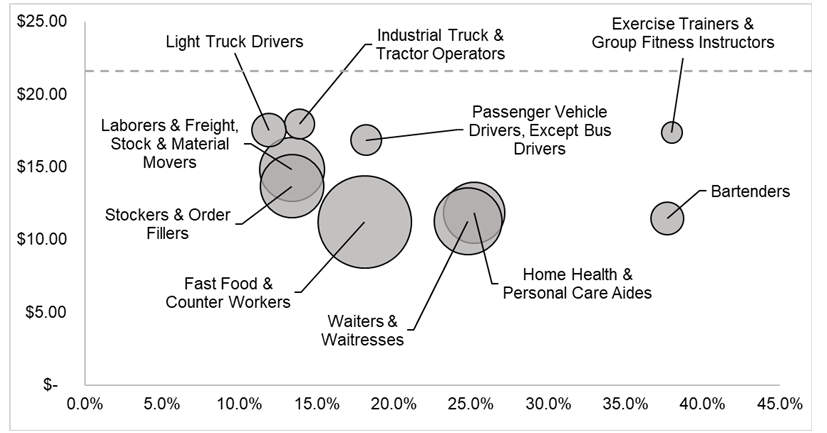
Figure 8b
Source: Michigan Center for Data and Analytics, Michigan Department of Technology, Management, & Budget
Occupations requiring a high school diploma and short-term training are often in service areas. Examples of these occupations include Fast Food and Counter Workers, Waiters and Waitresses, and Home Health and Personal Care Aides. Each of the displayed occupations fall beneath the statewide median wage. While each of the occupations have high projected employment growth (greater than 10 percent), and a high number of annual openings, these jobs lack a high median hourly wage.
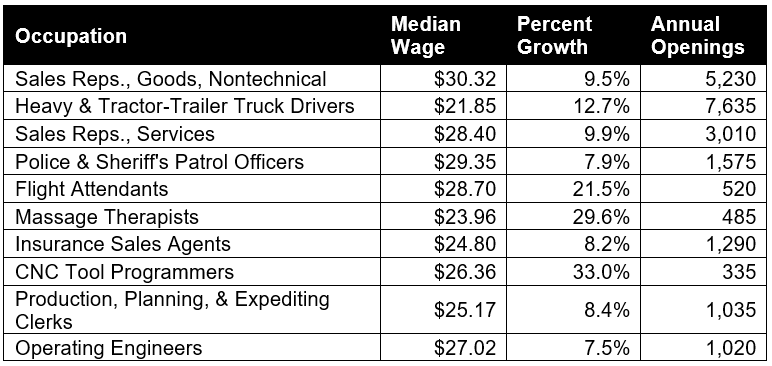
Figure 8c: Postsecondary Certificate or Moderate-Term Training Top Ten Occupations

Figure 8d
Source: Michigan Center for Data and Analytics, Michigan Department of Technology, Management, & Budget
Occupations that typically require a postsecondary certificate and moderate-term training that are high-demand and high-wage belong to a variety of industry areas. Among the represented industries are Construction (Operating Engineers), Transportation (Heavy and Tractor-Trailer Truck Drivers and Flight Attendants), and Leisure and Hospitality (Massage Therapists). These careers can be a good opportunity to earn above average median wages and pursue little time in postsecondary education.
Figure 8e: Associate Degree or Long-Term Training or Apprenticeship Top Ten Occupations
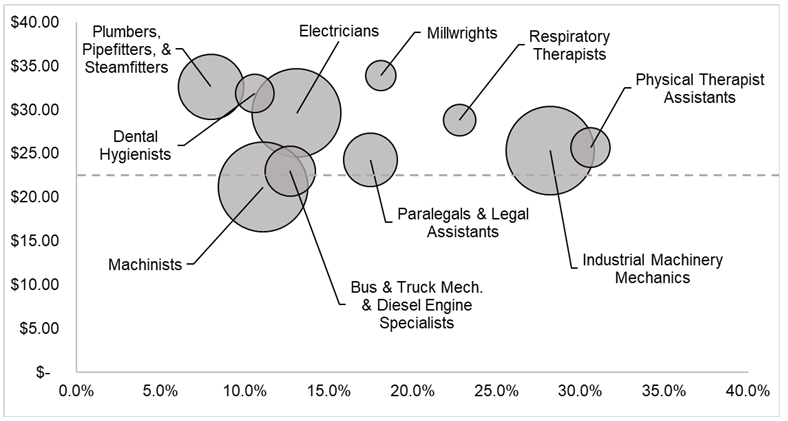
Figure 8f

Source: Michigan Center for Data and Analytics, Michigan Department of Technology, Management, & Budget
Figure 8e displays some of the top high-demand, high-wage occupations in the state that require an associate degree, long-term training (12 months or more), or apprenticeship. Most of the highlighted occupations are among professional trades such as Machinists and Electricians. Not only are these occupations expected to offer above average wages, but many are expected to have a high number of average annual openings.
Figure 8g: Bachelor’s Degree and Above Top Ten Occupations
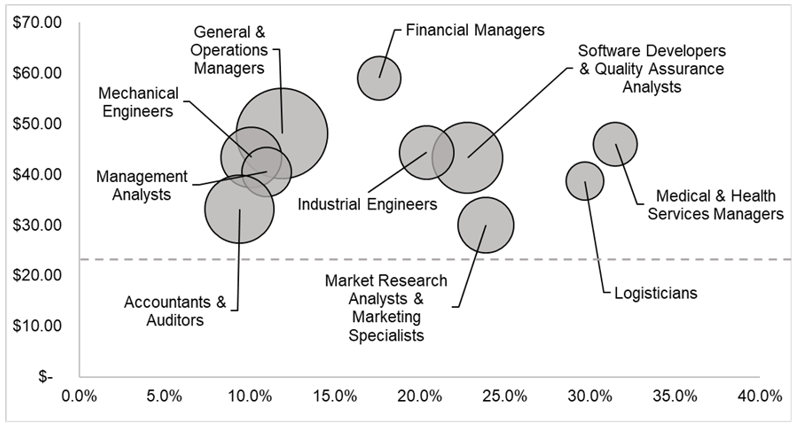
Figure 8h
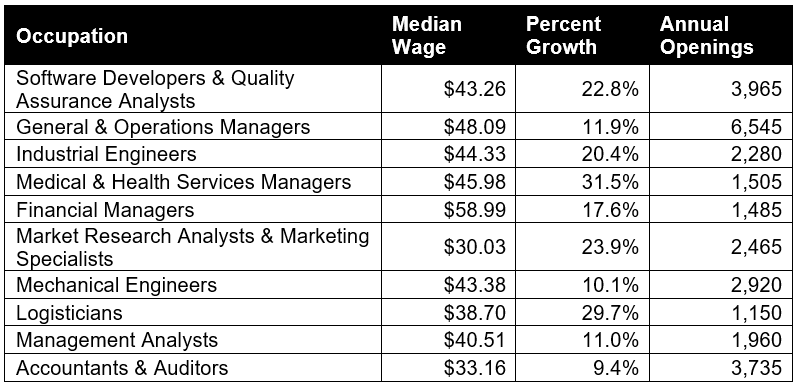
Source: Michigan Center for Data and Analytics, Michigan Department of Technology, Management, & Budget
All of the occupations displayed in Figure 8g require a bachelor’s degree or higher and pay well above the statewide average median wage. These occupations cut across a variety of industries but are often in areas such as Professional, Scientific, and Technical Services and Finance and Insurance.
Figure 8i: Science, Technology, Engineering, and Mathematics (STEM) Top Ten Occupations

Figure 8j

Source: Michigan Center for Data and Analytics, Michigan Department of Technology, Management, & Budget
Occupations in STEM can often overlap with high-demand, high-wage occupations requiring a bachelor’s degree or higher. These occupations are found in similar industry areas, and all pay above average wages.
Employers Needs
Figure 9: Share of Michigan Online Job Advertisements by Minimum Education Listed
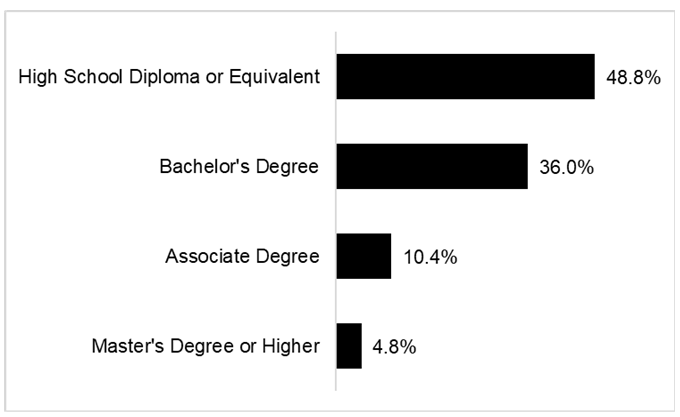
Source: October 2022–September 2023 Help Wanted OnLine, Lightcast Developer
Not every online job advertisement has a minimum education requirement listed, but of the ones that do, high school diploma or equivalent is the most often requested base level of education. In the past 12 months, nearly 50 percent of online job advertisements with an educational minimum were for those with a high school diploma or equivalent. Employers seeking individuals with at least a bachelor’s degree were the second most prominent at more than one-third of all Michigan ads in the past year. Online job advertisements may also seek other certifications or specific skills outside of educational attainment.
Figure 10: Top Ten Certifications and Baseline, Software, and Specialized Skills by Online Job Advertisements in Michigan

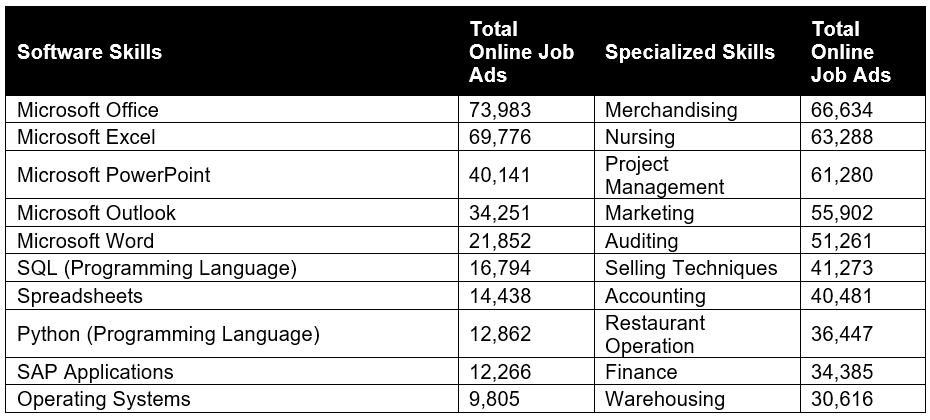
Note: Driver’s License is by far the topmost requested certification but has been excluded from the figure. Source: October 2022–September 2023 Help Wanted OnLine, Lightcast Developer
Figure 10 displays the top 10 certifications and type of skills listed in Michigan job advertisements over the October 2022 to September 2023 time period. The top 10 are based on the number of times the skill or certification is listed in an online job advertisement. Certifications are designated credentials earned by an individual to verify skills or knowledge gained to perform a job. Baseline skills are often called “foundational skills” and are defined as the common non-specialized skills that cut across a broad range of occupations. Specialized skills include professional and job-specific skills. Lastly, software skills include specific computer programs requested in online job postings, as well as programming skills.
Figure 11: Top Ten Industries by Online Job Advertisement Growth (2015–2022) in Michigan
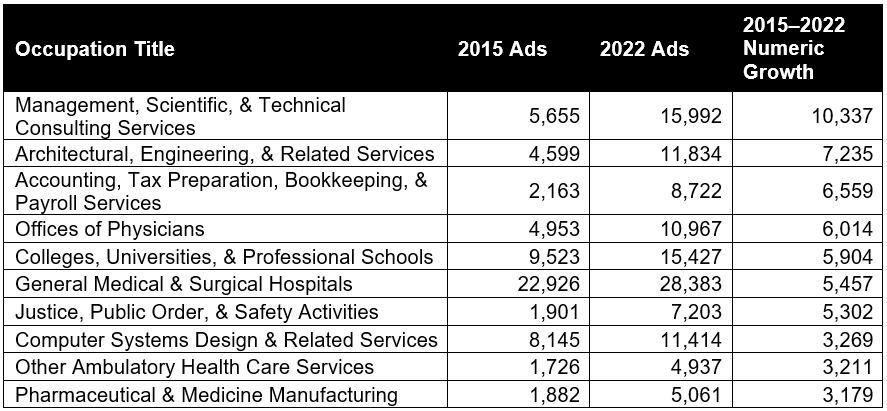
Source: Help Wanted OnLine, Lightcast Developer
Between 2015 and 2022, Management, Scientific, and Technical Consulting Services was the only industry to increase by more than 10,000 online job advertisements. The industries shown in Figure 11 are the top ten industries, based on numeric growth between 2015 and 2022. Many of the industries shown are within the medical field such as Offices of Physicians but overall, there is a variety of industry areas.
Figure 12: Top Ten Occupations by Online Job Advertisement Growth (2015–2022) in Michigan
Source: Help Wanted OnLine, Lightcast Developer
A large online demand has been shown for Software and Web Developers, Programmers, and Testers since 2015. This occupation is number one in terms of numeric growth and is the only one to have grown by well over 10,000 online job ads. Following behind are Registered Nurses, which has been in high demand consistently over the past few years. While the top ten occupations by job ad growth do cut across a variety of industry areas, Information Technology is a standout.