
Located in:
- II. Strategic Elements
The Unified or Combined State Plan must include a Strategic Planning Elements section that analyzes the State’s current economic environment and identifies the State’s overall vision for its workforce development system. The required elements in this section allow the State to develop data-driven goals for preparing an educated and skilled workforce and to identify successful strategies for aligning workforce development programs to support economic growth. Unless otherwise noted, all Strategic Planning Elements apply to Combined State Plan partner programs included in the plan as well as to core programs. Where requirements identify the term “populations”, these must include individuals with barriers to employment as defined at WIOA Section 3. This includes displaced homemakers; low-income individuals; Indians, Alaska Natives, and Native Hawaiians; individuals with disabilities, including youth who are individuals with disabilities; older individuals; ex-offenders; homeless individuals, or homeless children and youths; youth who are in or have aged out of the foster care system; individuals who are English language learners, individuals who have low levels of literacy, and individuals facing substantial cultural barriers; farmworkers (as defined at section 167(i) of WIOA and Training and Employment Guidance Letter No. 35-14); individuals within 2 years of exhausting lifetime eligibility under the Temporary Assistance for Needy Families program; single parents (including single pregnant women); and long-term unemployed individuals. Additional populations include veterans, unemployed workers, and youth, and others that the State may identify.
- a. Economic, Workforce, and Workforce Development Activities Analysis
The Unified or Combined State Plan must include an analysis of the economic conditions, economic development strategies, and labor market in which the State’s workforce system and programs will operate.
- a. Economic, Workforce, and Workforce Development Activities Analysis
II. a. 1. A. Economic Analysis
The Unified or Combined State Plan must include an analysis of the economic conditions and trends in the State, including sub-State regions and any specific economic areas identified by the State. This must include—
i. Existing Demand Industry Sectors and Occupations
Provide an analysis of the industries and occupations for which there is existing demand.
ii. Emerging Demand Industry Sectors and Occupations
Provide an analysis of the industries and occupations for which demand is emerging.
iii. Employers’ Employment Needs
With regard to the industry sectors and occupations identified in (A)(i) and (ii), provide an assessment of the employment needs of employers, including a description of the knowledge, skills, and abilities required, including credentials and licenses.
Current Narrative:
- Economic and Workforce Analysis
- Economic Analysis.
i. Existing Demand Industry Sectors and Occupations
In the middle of the last century, Puerto Rico's economy was centered on the production of sugarcane and tobacco. It then transformed into an economy sustained by the petrochemical, electronic, and textile manufacturing industries. This event occurred from the 1970s to the 2000s. How has the world transformed over time? Puerto Rico was no exception, as it was part of the transformation experienced by the rest of the economies.
Puerto Rico experienced a series of events that affected its economic development and created an economic crisis. Some of these events are as follows:
- The effects of hurricanes Irma and Maria resulted in the acceleration of the emigration of another 600,000 people from Puerto Rico.
- The COVID-19 pandemic has contributed to a decline in the country's economic activity.
- Significant differentiation of poverty parameters between Puerto Rico and the United States (US). According to the 2020 census, 43.4% of the population lives in poverty, compared to 11.4% in the United States. However, by 2022, the poverty percentage in Puerto Rico had dropped to 39.8%.
- Several reasons for the demographic exodus from Puerto Rico are related to the quality of life, security, government services or support, and high unemployment rate (UR), among others.
- Distribution of Medicaid Benefits in Puerto Rico.
- Overestimation of economic growth projections has resulted in deficits and increases in financial debt.
- Changes in government policies, modifications in economic planning strategies, and inconsistent progression in diverse economic activities could potentially benefit society.
- Lack of communication at all levels of the productivity sectors, both government and private companies.
- The reorganization of COFINA's debt in 2018 under the Puerto Rico Economic Stability, Management and Oversight Act (PROMESA), which President Barack Obama signed into law on June 30, 2016. The debt increased to $72 billion because of this reorganization. The government of Puerto Rico established COFINA, a public corporation, with the intention of issuing bonds to refinance the well-known extra-constitutional debt.
- The energy crisis makes it difficult for businesses to operate and establish them. This has contributed to an increase in the cost of living since it increases the availability of necessities and causes their prices to increase in the market.
- Ease and guidance for establishing new businesses.
- The growth of Gross Domestic Product (GDP) has stagnated since 2005, with a negative growth rate (-2%). This negative growth persisted until 2018 (-4.4%).
- By 2022, the U.S. economy faced one of the highest inflation rates in 40 years. Therefore, Puerto Rico is facing significant economic challenges.
Although the GDP growth in Puerto Rico has been significantly affected since 1970, it was not from 2005 until 2018, when they registered negative percentage rates. Some reasons for this are wrong decisions about the debt, poor collection of tax revenues to cover government expenses and thus improve tax rates, the increase in the inflation rate, and the effects of the war between Russia and Ukraine, conflict in the middle east, among others.
However, during the 21st century, Puerto Rico's economy, influenced by changes in globalization and technological processes, manufacturing processes, meals, export of services, medical equipment, transportation, etc., began to boom. This stage is capital-intensive and is characterized by large investments. The government plays a fundamental role in the establishment of industries and their continuous development, which allows for an increase in national wealth and better quality of life for society.
The goal of the government's efforts is to create an export-focused, multisectoral, export-diversified knowledge-based economy that is connected into international supply chains. Among the strategic sectors included in this diversification are the following:
1. Bioscience;
2. Aviation;
3. Information Technology;
4. Agrobusiness;
5. Travel and Tourism.
This is aligned with the feelings of employers in Puerto Rico, who have identified the need for six priority job families with highest potential to drive business growth over next decade:
- Engineering talent to design new business processes and drive innovation in product – a particular priority for advanced manufacturing, pharmaceutical, and aerospace industries.
- College-educated computer scientists – a particular priority for companies like Wovenware that are on cutting edge of tech innovation.
- Workers with specific tech skills - to support digital and technical functions across all industries for example cybersecurity, data and analytics.
- Skilled trade and construction workers – to enable physical expansion of facilities.
- Natural Sciences talent to continue PR’s edge on biopharma.
- Business talent to drive successful project implementation – with a particular focus on need in project managers.
This is an opportunity to make the most of our workforce's talent and capacity, which will lead to sustainability and economic growth. By using this strategy, Puerto Rico will be able to adjust to the dynamic nature of globalization and assimilate the circumstances or impacts that arise on a local as well as a worldwide scale.
Economic Indicators:
- GDP
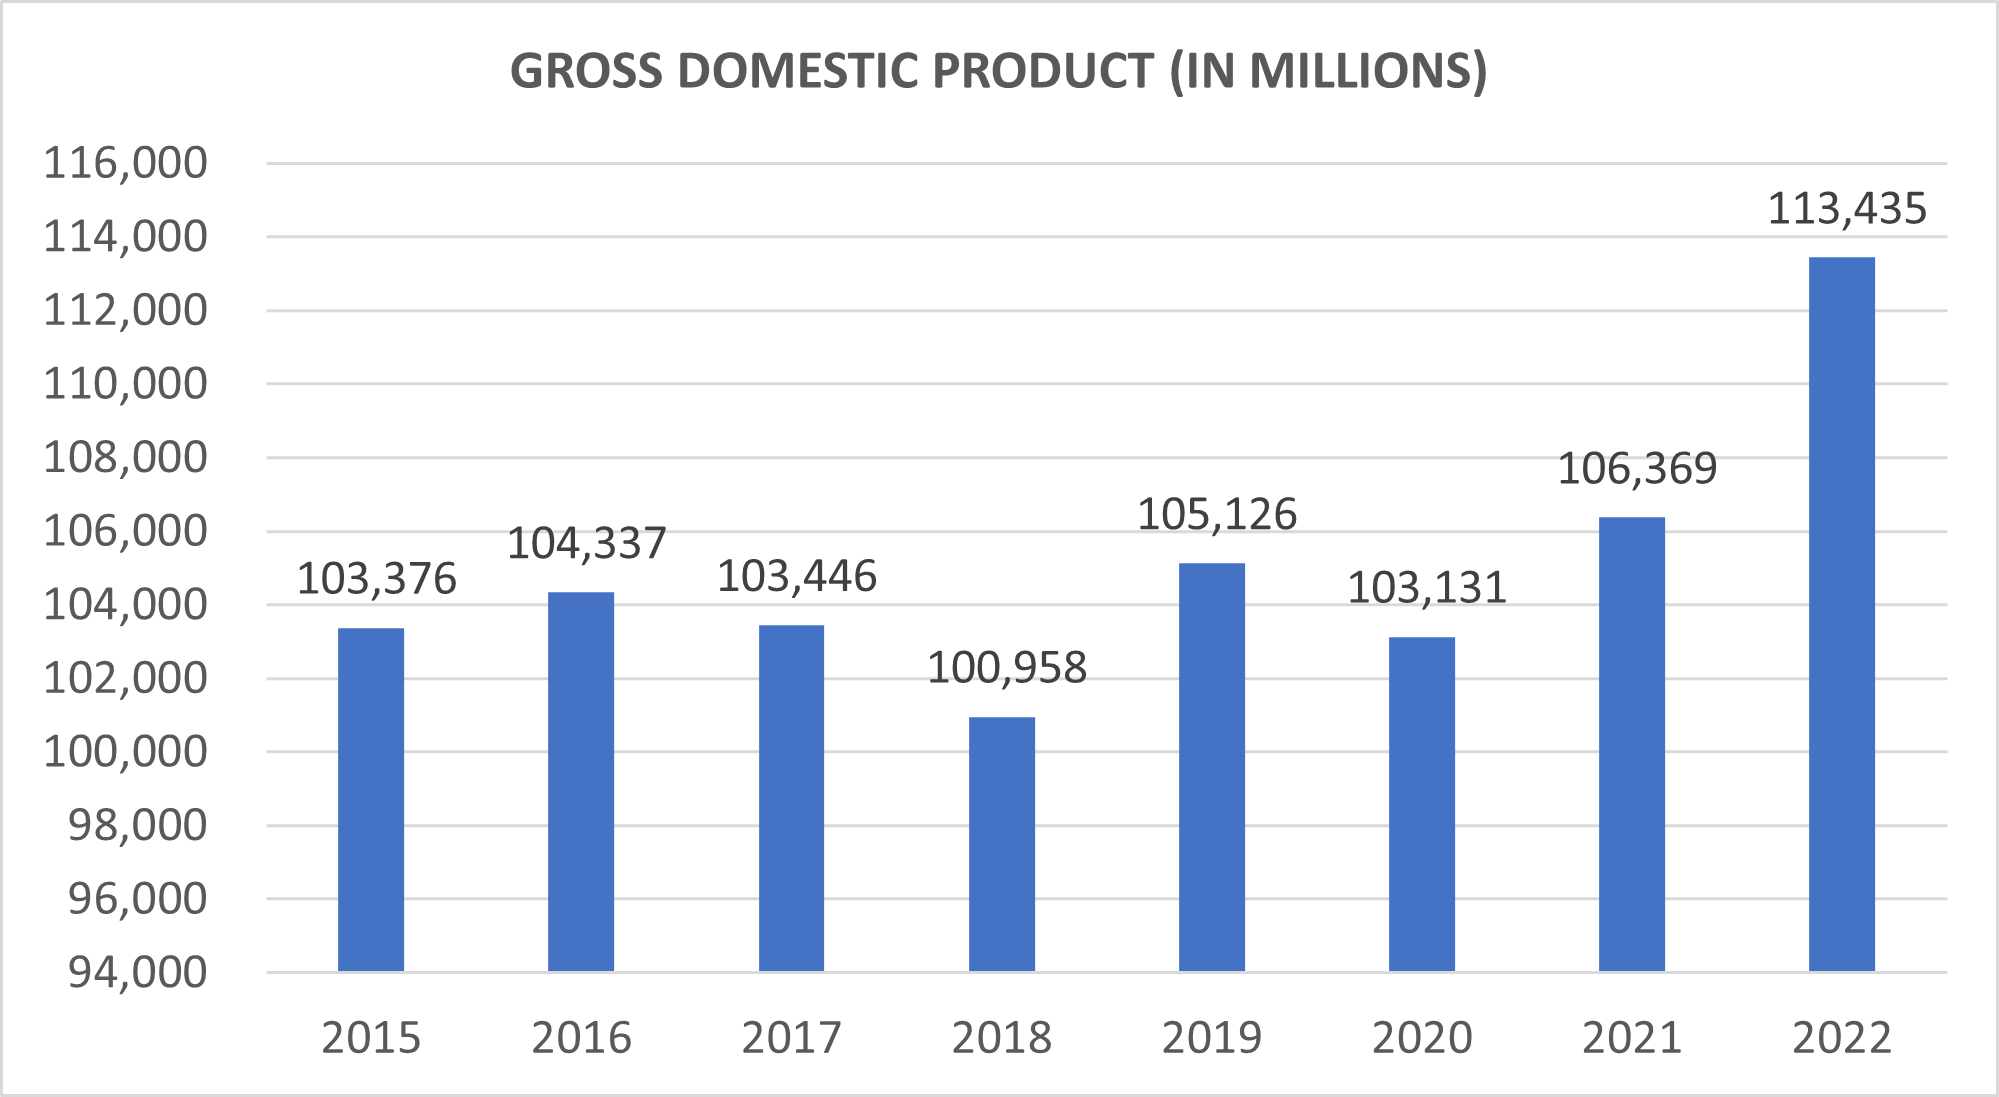
GDP is a macroeconomic indicator that is considered when analyzing economic development, accumulation of wealth, and social welfare. This is the market value of all the final services and goods in each period. Its measurement can be obtained from two sources: income and aggregate expenditure. The trajectory of Puerto Rico's GDP from 2015 to 2022:
Graph 1: Gross Domestic Product in Millions from 2016 to 2022
Source: www.estadísticaspr.gov
The GDP increased in 2016 at a growth rate of.93% from 2015. Because of Hurricane Maria, the GDP decreased in 2017 and 2018 compared to 2016 to a level of -.85% for 2017 and -3.2% for 2018. In 2019, GDP had a significant recovery compared to 2018 of 4.1%. In 2020, GDP decreased compared to 2019 by -1.9%, as part of the effects of the COVID-19 pandemic. In the years 2021 and 2022, the GDP increased in relation to the year 2020 at a rate of 3.1% for the year 2021 and 10% for the year 2022.
Below are some macroeconomic indicators that influence economic development and sustainability. These are the Gross Domestic Product, Disposable Personal Income and Personal Consumer Expenditure for the years from 2013 to 2022. In these last two variables there is an expense above the available income for the years 2013, 2014, 2015, 2019 and 2022.
Table 1: Economics Indicator (2013-2022)
CURRENT PRICE (IN THOUSANDS)
Years
| Economic Variable | 2013 | 2014 | 2015 | 2016 | 2017 | 2018 | 2019 | 2020 | 2021 | 2022 |
|---|---|---|---|---|---|---|---|---|---|---|
| Gross Domestic Product | $102,450 | $102,446 | $103,376 | $104,337 | $103,446 | $100,958 | $105,126 | $103,131 | $106,369 | $113,435 |
| Disposable Personal Income | $61,866 | $60,781 | $61,238 | $61,359 | $62,656 | $69,669 | $65,126 | $71,707 | $78,603 | $81,827 |
| Personal Consumer Expenditure | $62,478 | $61,899 | $61,641 | $60,979 | $62,454 | $65,157 | $68,759 | $65,470 | $72,529 | $82,416 |
Source: Puerto Rico Puerto Rico Planning Board - Ingreso y Producto 2022
The next table shows the same macroeconomic variables in per capita terms. This information shows that GDP increases over time except for 2020 because of the pandemic on production and population.
Table 2: Economics Indicator (2013-2022) Per Capita
Years
| Economic Variable | 2013 | 2014 | 2015 | 2016 | 2017 | 2018 | 2019 | 2020 | 2021 | 2022 |
|---|---|---|---|---|---|---|---|---|---|---|
| Gross Domestic Product | $28,348 | $28,745 | $29,502 | $30,330 | $30,732 | $30,978 | $32,914 | $31,854 | $32,503 | $34,989 |
| Disposable Personal Income | $17,118 | $17,054 | $17,477 | $17,837 | $18,614 | $21,377 | $20,390 | $22,148 | $24,019 | $25,240 |
| Personal Consumer Expenditure | $17,288 | $17,368 | $17,591 | $17,727 | $18,554 | $19,993 | $21,527 | $20,222 | $22,163 | $25,421 |
Source: Puerto Rico Planning Board – Income & Product 2022
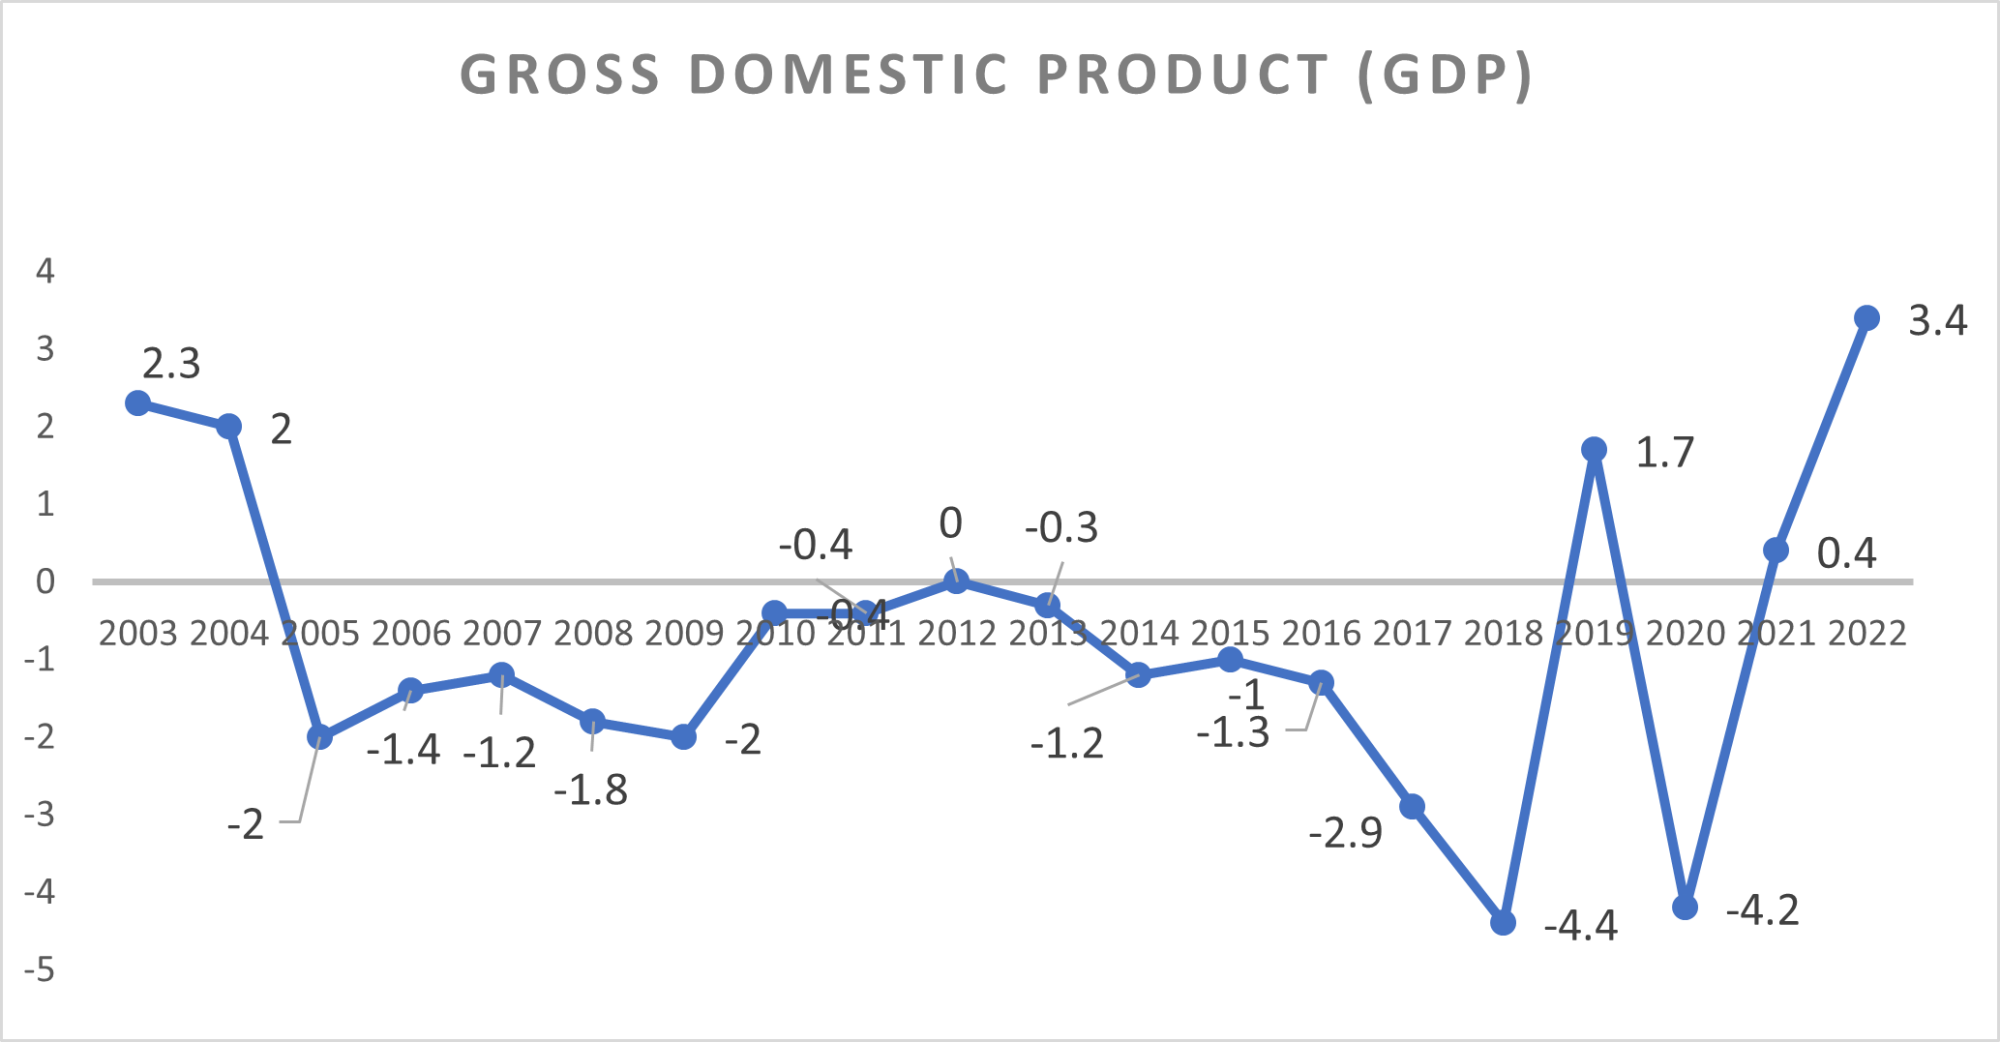
To visualize these effects in detail, we present the 2.
Graph 2. GPD Growth from 2000 to 2021

Source: www.estadisticapr.gov
As shown, growth took several turns, but it was not until 2005, when it had negative growth and continued negatively until 2018. In 2019, it had a brief recovery (1.7%), but in 2020, it fell again to -4.4% because of the effects of the COVID-19 pandemic. In 2022, a positive recovery of 3.4% was observed.
- Gross National Product (GNP)
Gross National Product (GNP), like GDP, is a macroeconomic indicator that is highly considered in terms of economic development and sustainability. Below, you will find the trajectory of Puerto Rico's GNP from 2003 to 2022:
Graph 3. Gross National Product from 2003 to 2022
Source: DEDC. Resumen de Cuentas Sociales AF 2022
The Gross National Product for fiscal year 2022 totaled $77,953.5 million in current terms, representing an increase of 6.9%. At constant prices, it reached $5,937.8 million, an increase of 3.7%.
The following table shows the behavior of exports for the period from 2000 to 2022. The percentage that exports represent in the GDP represents more than 60% of the GDP except for the years 2012, 2021 and 2022. This is one of the economic variables promoted by the government, which is included in the strategies of the Purpose project, which seeks economic development and sustainability.
- Exports
Table 3. Puerto Rico Exports (2000-2022):
| Year | Billions in US $ | % of GDP |
|---|---|---|
| 2000 | 38.47 | 62.34 |
| 2001 | 46.9 | 67.77 |
| 2002 | 47.17 | 65.86 |
| 2003 | 55.18 | 73.74 |
| 2004 | 55.08 | 68.57 |
| 2005 | 56.54 | 67.38 |
| 2006 | 60.12 | 68.88 |
| 2007 | 60.01 | 67.03 |
| 2008 | 63.95 | 68.3 |
| 2009 | 60.81 | 63.09 |
| 2010 | 61.66 | 62.67 |
| 2011 | 64.28 | 64.05 |
| 2012 | 58.35 | 57.45 |
| 2013 | 62.36 | 60.87 |
| 2014 | 62.31 | 60.82 |
| 2015 | 69.46 | 67.19 |
| 2016 | 71.74 | 68.76 |
| 2017 | 71.09 | 68.72 |
| 2018 | 60.53 | 59.95 |
| 2019 | 63.68 | 60.58 |
| 2020 | 62.24 | 60.35 |
| 2021 | 57.92 | 54.45 |
| 2022 | 59.79 | 52.71 |
Source: macrotrends.net/countries/PRI/puerto-rico/exports
Below is a comparison of exports of the main industries for the years 2020 and 2022.
Table 4. Top Puerto Rico Exports by Trade Dollar Value, 2020 and-2022
In Billions
| Industries | 2020 | 2022 | Difference | Change % |
|---|---|---|---|---|
| Pharmaceutical and Medical Manufacturing | $12.90 | $16.30 | $3.40 | 26.36 |
| Medical Equipment and Support Manufacturing | $1.10 | $1.30 | $0.20 | 18.18 |
| Basic Chemical Manufacturing | $0.70 | $0.70 | $- | - |
| All Other Manufacturing | $1.90 | $2.40 | $0.50 | 26.32 |
Source: US Census Bureau, Foreign Trade Statistics: https://www.bls.gov/mxp/publications/regional-publications/puerto-rico-exports.pdf
Certain businesses, such pharmaceuticals and medical manufacturing, saw development in Puerto Rico's export sector; this could be a sign of a strategic advantage or rising demand for these products worldwide. Nonetheless, during the analysis, exports' overall GDP contribution has decreased, which may indicate that the economy is diversifying or that other sectors are expanding more quickly. The drop in exports as a proportion of GDP after 2017 may possibly be the result of more general economic difficulties or changes in the international market that Puerto Rico must adjust to. Even if exports as a percentage of GDP have generally decreased, the manufacturing sector is growing, which may offer opportunity for focused economic policies to promote and strengthen these high-growth industries.
- Economic Activity Index (EAI)
EAI is another macroeconomic indicator in which trade dynamics are visualized at a given time to promote economic development. This indicator consists of energy consumption, cement sales, the number of non-agricultural wage earners employed and gasoline consumption. Next, the average behavior of this indicator from 2000 to 2023 is presented (the last data point represents the average of the data from July 2022 to February 2023).
Graph 4. Economy Activity Index from 2000 to 2023
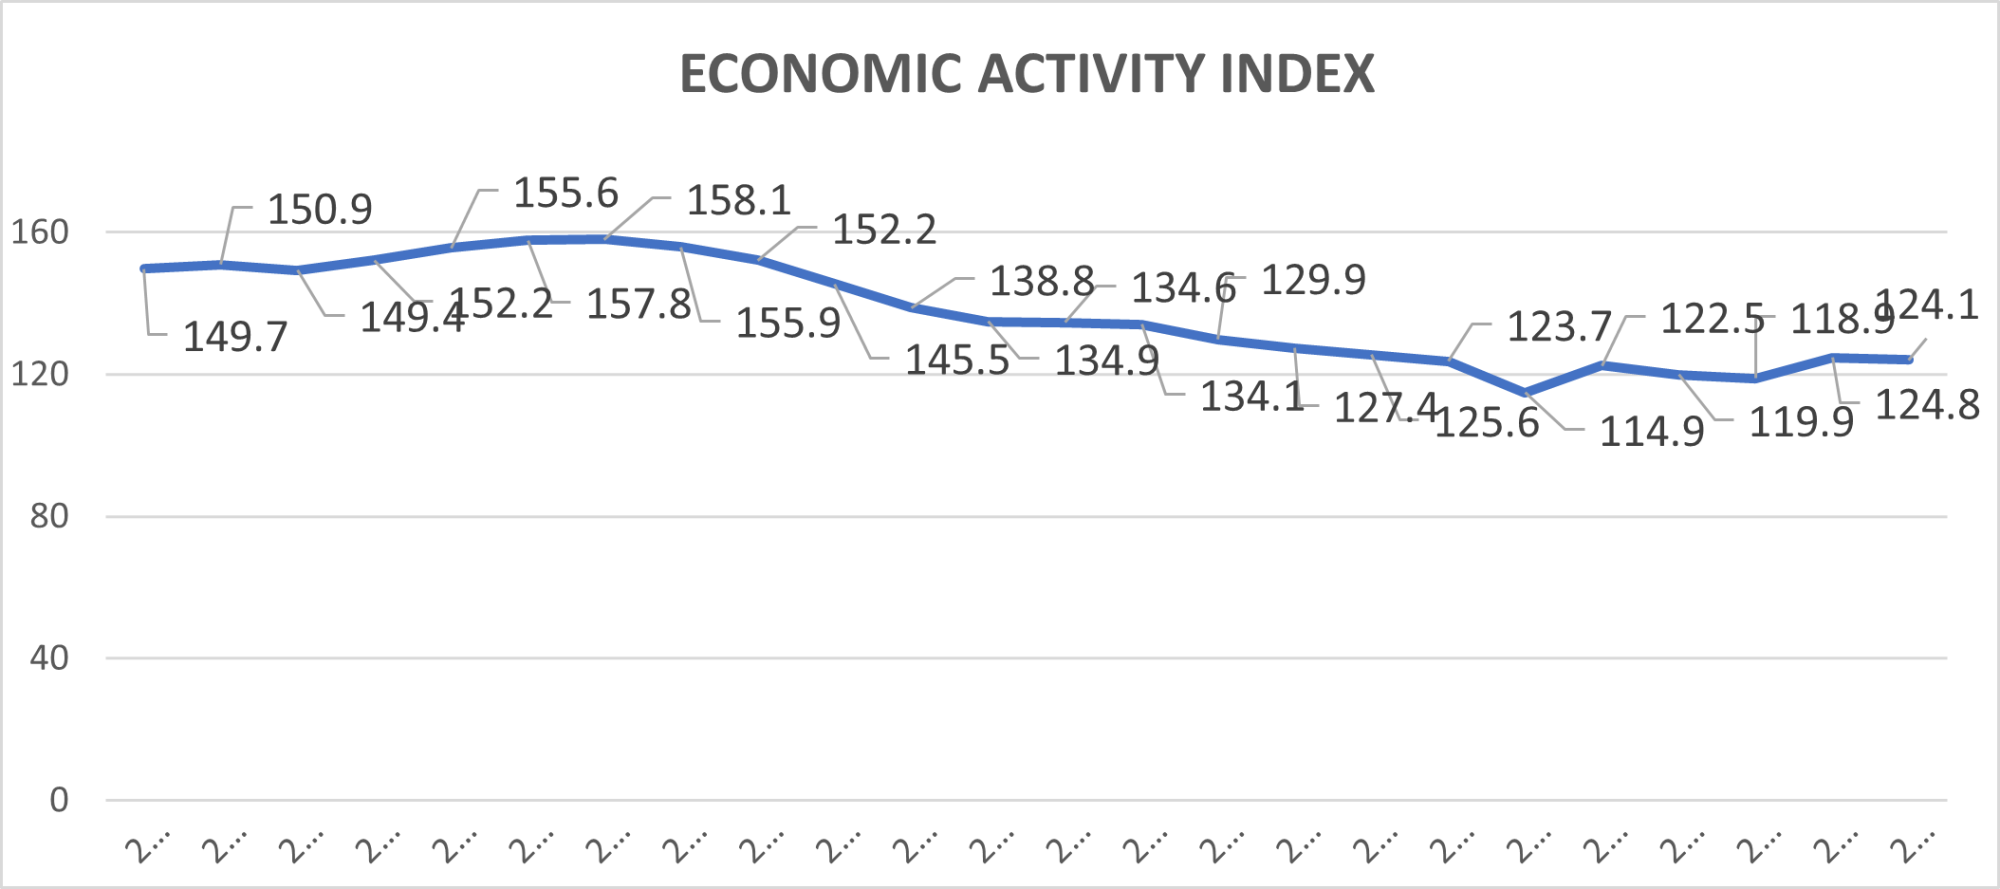
Source: www.estadísticaspr.gov
If we visualize the movement of the index in the previous graph, it shows a reduction in economic activity from 2005, which continues at a decreasing rate until 2018. In 2019, this indicator improved, but in 2020, it fell again (COVID-19). It showed positive performance from 2021 to 2023, although it was from 2000 to 2004. This behavior coincides with the behavior discussed above regarding the GDP.
In general, EAI was significantly affected during this century. Some of the exogenous events that contributed to their behavior were as follows:
- The United States Congress terminated the advantageous tax status for American businesses operating in Puerto Rico in 2006; consequently, it is anticipated that future support for these industries will be reduced. As a result, some may decide to go back to the United States or, in another scenario, move their industries or manufacturing lines to different Latin American nations.
- In September 2017, Irma and Maria made landfall in Puerto Rico. The entire economy was impacted by this. Normalizing economic activity has proven to be a very difficult task. We continue to get assistance today to repair or lessen the harm the hurricanes have inflicted.
- COVID-19 had an impact on the entire planet in 2020, including Puerto Rico. This incident affected the world economy, but it also made virtual labor more accessible and changed people's perspectives about it. This modality offered a fresh perspective on how market systems, particularly the labor market, may be changed as needed. It has also encouraged the development of novel corporate practices.
- In 2022, the U.S. economy experienced the highest inflation rate in the last 50 years, which resulted in a transfer to the Puerto Rican economy. The reason for this event is the different economic stimuli used to address the impact of COVID-19.
- Population
The Population variable is another important economic indicator since it is the main component of the elaboration, development, and growth of a sustainable economy. The population behavior of Puerto Rico from 2016 to 2023 is shown below.
Graph 5. Population in Thousands of Millions from 2016 to 2021
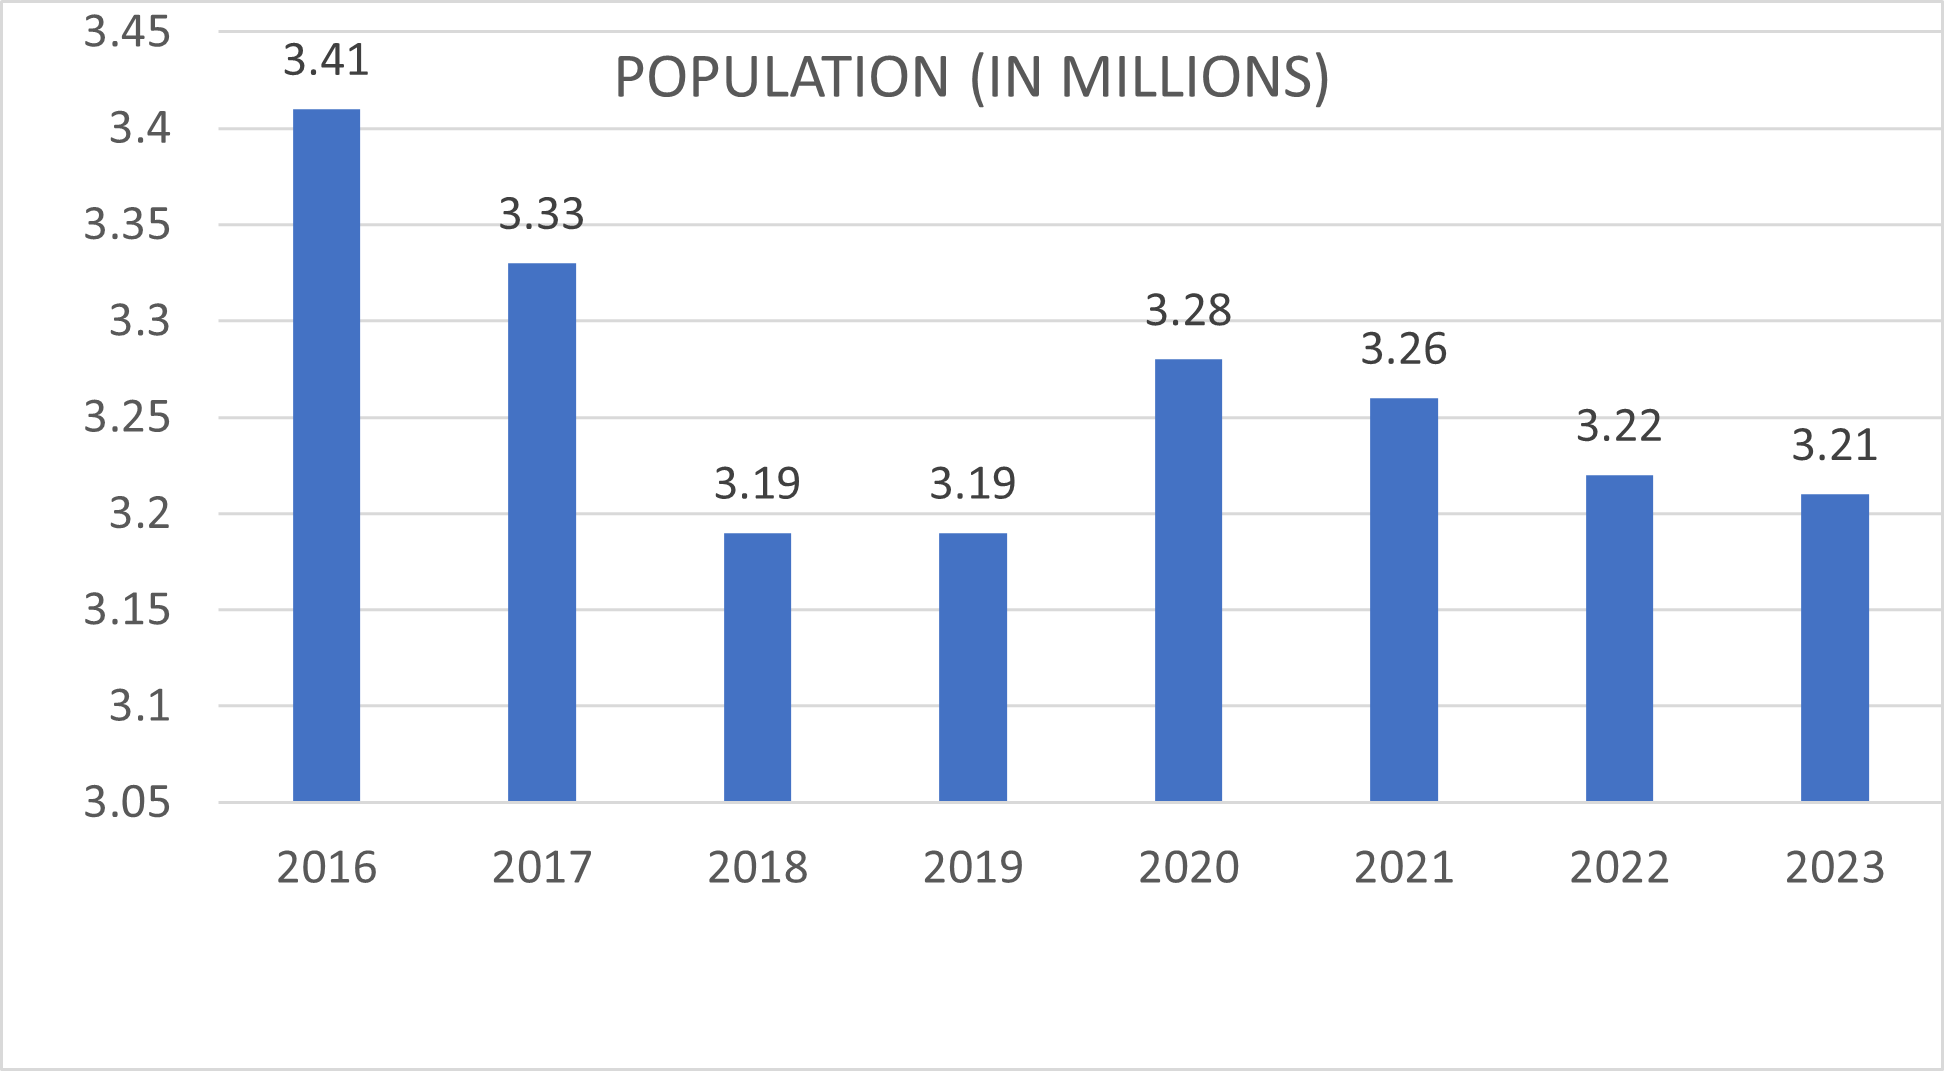
Source: www.estadísticaspr.gov
The behavior of the population also has a negative impact. Since 2016, the population has decreased from just over 3.4 million inhabitants to just over 3.3 million inhabitants by 2017. In 2018, the population of Puerto Rico experienced a sharp reduction of less than 3.2 million inhabitants, influenced by the effects of Hurricane Maria, which continued for the next three years. This situation caused many Puerto Ricans to emigrate to the US, which caused them to settle outside Puerto Rico, thus affecting the Puerto Rican labor market. This also caused a drop in students, affecting our education system because of parents' decisions to emigrate to the US. Starting in 2020, the population begins to decrease at least until 2023. (The years 2021, 2022 and 2023 are estimates).
Migration effects are an important factor for economic development since most of them are part of the country's workforce. Below is a distribution of the country's migration effect, for the years 2010 to 2023. Starting in 2010, the net migration rate has been increasing until 2020. From 2021 to 2023, this Migration rate begins to decrease. This is in part due to established government programs such as Purpose and 21 Century among others. The retention of workers is important to meet the strategies, objectives and goals established by the government.
Table 5. Puerto Rico Net Migration Rate Data (2010-2023)
| Year | Net Migration Rate % | Growth Rate % |
|---|---|---|
| 2010 | -10.173 | 14.11 |
| 2011 | -11.43 | 12.36 |
| 2012 | -12.688 | 11.01 |
| 2013 | -13.946 | 9.91 |
| 2014 | -17.436 | 25.03 |
| 2015 | -20.925 | 20.01 |
| 2016 | -24.415 | 16.68 |
| 2017 | -27.904 | 14.29 |
| 2018 | -31.394 | 12.51 |
| 2019 | -23.728 | -24.42 |
| 2020 | -16.061 | -32.31 |
| 2021 | -8.395 | -47.73 |
| 2022 | -0.728 | -91.33 |
| 2023 | 6.938 | -1053.02 |
Source: macrotrends.net/countries/PRI/puerto-rico/net-migration
Continuing with the significant effects and impacts on the workforce the working group with the greatest impact was those aged 20–64 years. The population changes in this group were as follows:
Graph 6. Population Data from 1980 to 2020
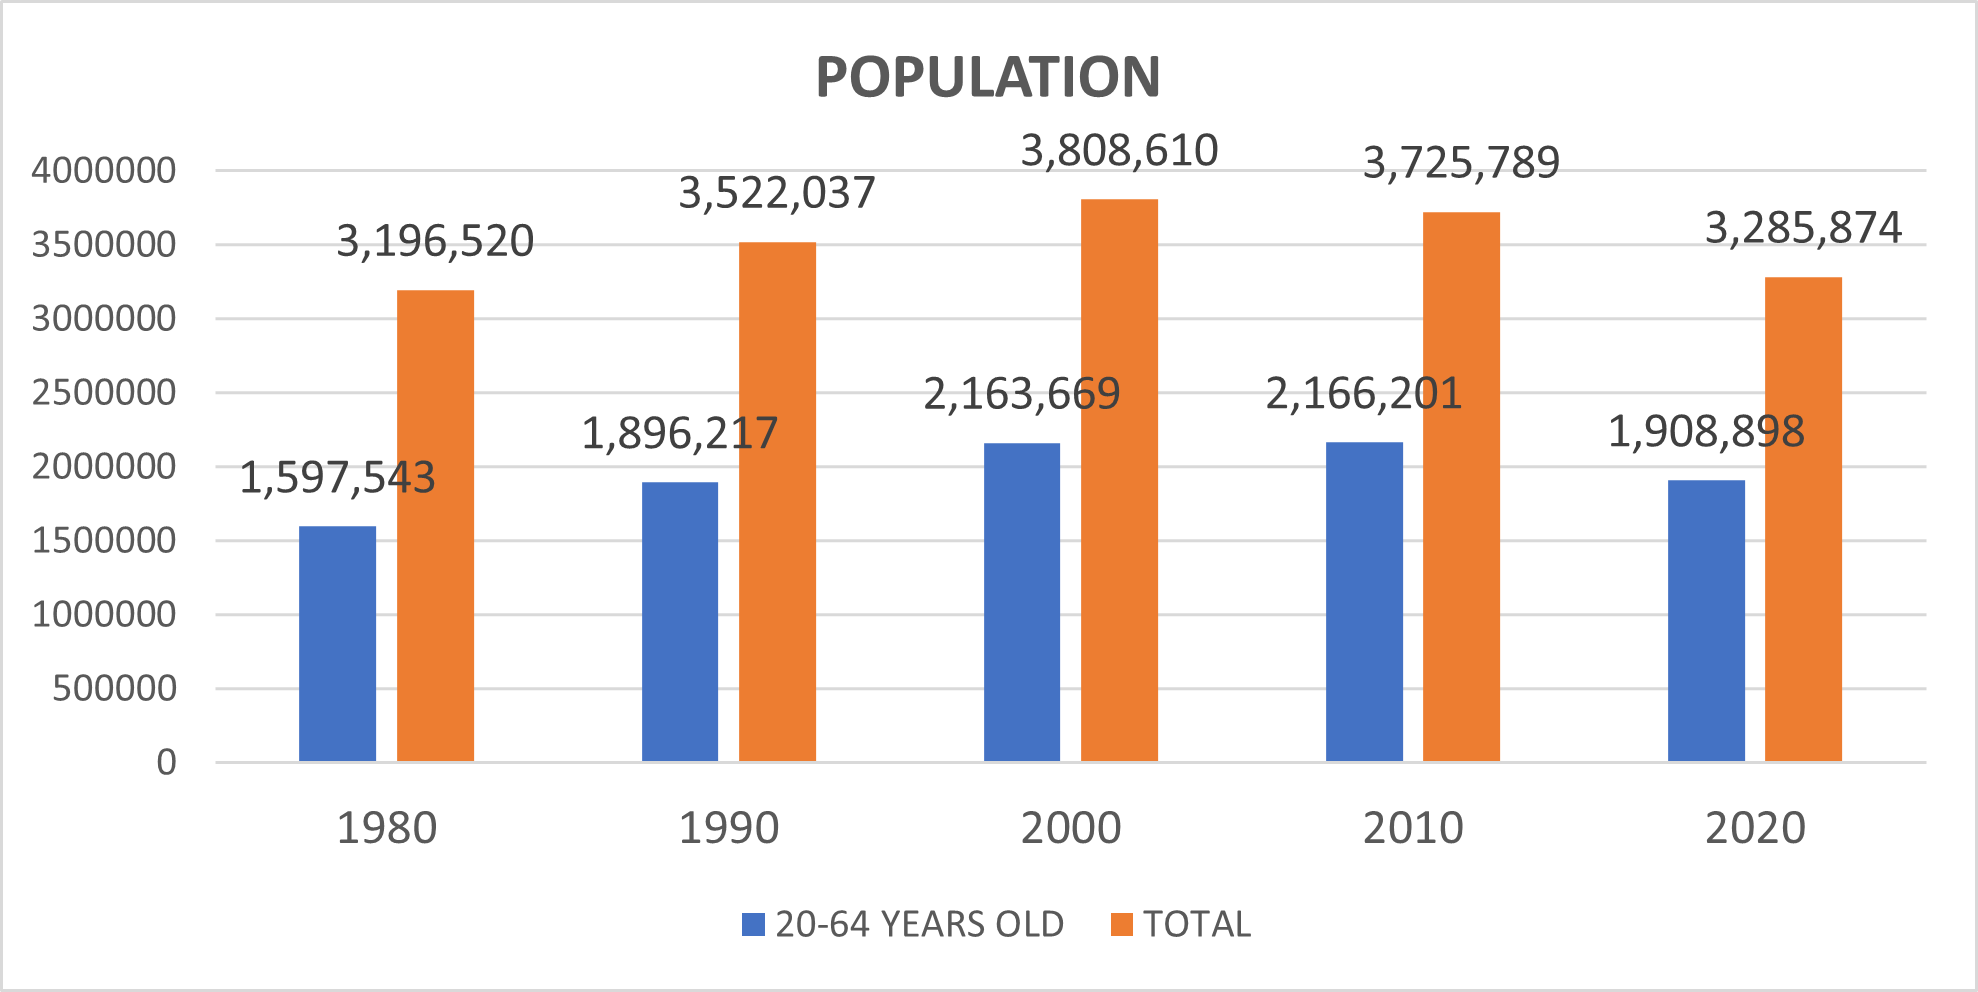
Source: www.estadisticaspr.gov
Population data from the 1980 Census to 2010 continued to grow or have a positive impact. However, for the 2020 census, it was reduced to -11.9% compared to the 2010 census. This was the result of hurricanes Irma and Maria, which occurred in 2017.
- Labor market
The Labor Market is another vital component, as it is the main engine for structuring a sustainable economy. Below are data on the labor market in Puerto Rico:
Table 6. Mean Total Employment, Seasonally Adjusted and Percentage Change;
Fiscal Year 2019-2023:
| Year | Total Employment | Change% |
|---|---|---|
| 2019 | 995 | 2.7 |
| 2020 | 994 | -0.1 |
| 2021 | 1039 | 4.5 |
| 2022 | 1115 | 7.3 |
| 2023 | 1116 | 0.1 |
Source:ResumenEconómicodePuertoicoAgosto2023/Vol.III,Num.8stadisticas.pr/files/inventario/resumen_economico/2023-09-18/Revista-Resumen-Economico-ago-2023.pdf
Jobs begin to increase from 2020 to 2023. In 2021 the growth rate compared to 2020 was 4.5%, while for 2023 compared to 2022 it was 7.3%.
The working force is presented from the year 2019 to the year 2023. The working force for the years 2021 and 2022 had significant growth compared to the previous year. For the year 2021 it obtained a growth rate of 4.6%, while for the year 2022 it was 5.4%.
Table 7. Work Group, Seasonally Adjusted and Percentage Change; Fiscal Year 2019-2023
| Year | Worker Group | Change% |
|---|---|---|
| 2019 | 1087 | 0.6 |
| 2020 | 1086 | -0.1 |
| 2021 | 1136 | 4.6 |
| 2022 | 1197 | 5.4 |
| 2023 | 1187 | -0.8 |
Source:ResumenEconómicodePuertoicoAgosto2023/Vol.III,Num.8stadisticas.pr/files/inventario/resumen_economico/2023-09-18/Revista-Resumen-Economico-ago-2023.pdf
The agricultural wage employment presented from 2019 to 2023 had a decrease until 2021 by -0.8%. Then, for the years 2021 and 2022 they obtained an increase of 6.7% and 3.4% respectively.
Table 8. Agricultural Wage Employment: State Government, Seasonally Adjusted and
Percentage Change; Fiscal Year 2019-2023:
| Year | Agricultural Wage Employment | Change% |
|---|---|---|
| 2019 | 873.7 | 1.9 |
| 2020 | 857 | -1.9 |
| 2021 | 850 | -0.8 |
| 2022 | 906.8 | 6.7 |
| 2023 | 938 | 3.4 |
Source:ResumenEconómicodePuertoicoAgosto2023/Vol.III,Num.8stadisticas.pr/files/inventario/resumen_economico/2023-09-18/Revista-Resumen-Economico-ago-2023.pdf
The next table presents the 10 occupations with the highest salaries. The three occupations with the highest salaries are Physicians, All Other ($162,260); Chief Executive ($130,250) and Advertising and Promotions Managers ($122,700).
Table 9. Top 10 Occupations with Highest Salary (May 2022):
| Occupation Code | Occupation Title | Employment # | Mean Hourly Wage | Annual Mean Wage |
|---|---|---|---|---|
| 11-1011 | Chief Executive | 3290 | $62.62 | $130,250.00 |
| 11-2011 | Advertising and Promotions Managers | 140 | $58.99 | $122,700.00 |
| 11-2021 | Marketing Managers | 810 | $47.90 | $99,640.00 |
| 11-3051 | Industrial Production Managers | 1150 | $53.90 | $112,120.00 |
| 11-9041 | Architectural and Engineering Managers | 970 | $53.14 | $110,530.00 |
| 23-1023 | Judges, Magistrate Jusdges, and Magistrate | 540 | $48.54 | $100,960.00 |
| 29-1218 | Obstetricians and Gynecologists | 60 | $58.68 | $122,060.00 |
| 29-1221 | Pediatricians, General | 80 | $50.25 | $104,520.00 |
| 29-1229 | Physicians, All Other | 840 | $78.01 | $162,260.00 |
| 29-1051 | Pharmacists | 2170 | $46.40 | $96,500.00 |
Sources: U.S. Bureau of Labor Statistics: bls.gov/oes/current/oes_pr.htm
The next table presents the 10 occupations with the lowest salaries. The three occupations with the highest salaries are Physicians, All Other ($162,260); Chief Executive ($130,250) and Advertising and Promotions Managers ($122,700). The three occupations with the lowest salaries are Massage Therapists ($20,240); Childcare Workers ($20,520) and Food Preparation Workers ($20,550).
Table 10. Top 10 Occupations with the Lowest Salary (May 2022):
| Occupation Code | Occupation Title | Employment # | Mean Hourly Wage | Annual Mean Wage |
|---|---|---|---|---|
| 31-1132 | Orderlies | 520 | $10.00 | $20,800.00 |
| 31-9011 | Massage Therapists | 140 | $9.73 | $20,240.00 |
| 31-9091 | Dental Assistants | 2600 | $10.05 | $20,910.00 |
| 35-2021 | Food Preparation Workers | 6160 | $9.88 | $20,550.00 |
| 37-2012 | Maids and Housekeeping Cleaners | 3110 | $10.10 | $21,000.00 |
| 39-9011 | Childcare Workers | 1060 | $9.87 | $20,520.00 |
| 41-2011 | Cashiers | 30230 | $10.17 | $21,140.00 |
| 45-2099 | Agricultural Workers, All Other | 140 | $9.90 | $20,580.00 |
| 47-2061 | Construction Laborers | 8720 | $10.12 | $21,050.00 |
| 47-3012 | Helpers-Carpenters | 1090 | $10.25 | $21,320.00 |
Sources: U.S. Bureau of Labor Statistics: bls.gov/oes/current/oes_pr.htm
The labor market for the past five years has remained at a stable pace despite the events of Hurricane Maria and the COVID-19 pandemic.
A study conducted by the DOL indicated that the occupations of greatest demand for 2021 without a baccalaureate are as follows:
- Retailers
- Cashiers
- Customer Service Representatives
- Fast Food Preparation Workers and Sample Clerks
- Medical Secretaries
- Janitors and Housekeepers, Except Domestic Employees and Housekeepers in Private Homes
- Dental Assistants
- Workers and Day Laborers Agriculture, Cultivation, Food and Greenhouse
- Order Repositors and Preparers
- Meal Preparation Workers
On the other hand, the occupations of greater demand with minimum education of the baccalaureate are as follows:
- Retailers
- Medical Secretaries
- Customer Service Representative
- Executive Secretaries and Executive Administrative Assistants
- Registered Nurses
- Office Employees, General Tasks
- Accountant and Auditors
- Secretary and Administrative Assistants, Except Legal, Medical and Executive
- Medical and Clinical Laboratory Technologists
- Lawyers
For the next ten years, labor trends are aimed at the following (DOL, 2021):
- Jobs focused on advanced technology, such as the Security or Protection of Computer Systems, Robotics, Scientists and AI.
- Jobs related to the management of Information such as "Big Data” (BD), Engineers, Communications, Information Systems and Statistics, among others.
- Jobs focused on health, including Nurses, Speech Therapists, Physical Therapists, Nutritionists, Doctors, Radiologists and Laboratory Technicians.
- Jobs focused on seniors such as Caregivers, Therapists, Social Workers, Nutritionists, Transportation, Medical Services and Personal Care.
It is important to bear in mind that many occupations with the highest demand today could tend to be eliminated or reduced considerably because technological advances in both access to information and robotics have gradually replaced human capital.
In addition, we must consider the effects of the pandemic on structure and work functions. Many of these employers had to structure and allow virtual work, so this modality, taking advantage of the available technology, anticipated what was expected to happen in the next ten years.
The projection of specialized occupations in the labor force towards the year 2030 with greater opportunities to integrate into economic development. Some of these occupations are as follows:
Table 11. Projected Job Growth (2020-2030):
| Occupation | PR Employment | Projected Job Growth Rate (2020-2030) | Projected Job (2020-2030) | Mean Annual Salary | Education Level |
|---|---|---|---|---|---|
| Industrial Engineers | 2,866 | 22% | 3,497 | $72,300 | Bachelor’s degree |
| Civil Engineers | 2,069 | 17% | 2,421 | $62,180 | Bachelor’s degree |
| Computer Systems Analysts | 1,339 | 13% | 1,513 | $54,560 | Bachelor’s degree |
| Chemists | 1,173 | 14% | 1,337 | $68,470 | Bachelor’s degree |
| Psychologists, All Other | 889 | 14% | 1,013 | $82,820 | Master’s degree |
| Mechanical Engineers | 711 | 23% | 875 | $69,800 | Bachelor’s degree |
| Art Directors | 455 | 22% | 555 | $59,490 | Bachelor’s degree |
| Computer Network Architects | 414 | 15% | 476 | $71,090 | Bachelor’s degree |
| Electronics Engineers | 322 | 19% | 383 | $65,410 | Bachelor’s degree |
| Microbiologists | 288 | 10% | 317 | $52,590 | Bachelor’s degree |
| Computer Hardware Engineers | 188 | 12% | 211 | $87,840 | Bachelor’s degree |
| Chemical Engineers | 141 | 15% | 162 | $81,680 | Bachelor’s degree |
| Epidemiologists | 74 | 24% | 92 | $52,980 | Master’s degree |
| Actuaries | 46 | 24% | 57 | $62,610 | Bachelor’s degree |
Resource: 21st Century Workforce Project Phase 1 Deliverable. January 2023.
F.1 Non-agricultural employment
The following graph shows the number of employees in the economic sectors (non-agricultural), which are composed of Mining and Construction, Manufacturing, Commerce, Information, Finance, Professional Services, Educational Services, Recreation, Government and Other Services. The distribution of jobs in these economic sectors has been exposed over the last five years (2018–2023).
Graph 7. Total Non-Agricultural Employment:

Source: www.estadísticaspr.gov
In addition, the non-agricultural wage employment, from year 2019 to year 2023, is shown with percentage changes.
Table 12. Non-Agricultural Wage Employment: State Government, Seasonally Adjusted and Percentage Change; Fiscal Year 2019-2023:
| Year | Non-Agricultural Wage Employment | Change % |
|---|---|---|
| 2019 | 138.2 | -5.2 |
| 2020 | 132.4 | -4.2 |
| 2021 | 128.3 | -3.1 |
| 2022 | 127.3 | -0.8 |
| 2023 | 127.5 | 0.2 |
Source:ResumenEconómicodePuertoicoAgosto2023/Vol.III,Num.8stadisticas.pr/files/inventario/resumen_economico/2023-09-18/Revista-Resumen-Economico-ago-2023.pdf
The economic development of Puerto Rico is based on economic sectors, which are the main forces for the movement of employees and for maintaining sustainable economic development. In the graph, the economic sectors with 100,000 jobs or more are Commerce, Professional Services, Educational Services and Government. Some sectors, such as Mining and Construction, Manufacturing and Finance, have had steady growth rates over the past five years. Although they have had a positive pace, the truth is that many capital investments have resulted in the replacement of human capital.
F.2 Unemployment Rate
Unemployment is an economic destabilizer. For Labor Force consideration, unemployed individuals must be 16 years of age or older, unemployed, and actively seek employment. The unemployment rates for 2018–2023 are as follows:
Graph 8. Unemployment Rate from 2018 to 2022:

Source: Department of Labor and Human Resources: Employment and Unemployment: December 2023.
In the graph presented on the unemployment rate from 2019 to 2023, an increase was observed for 2018 (effects of Hurricane Maria) and 2020 (effects of the pandemic or COVID-19). However, the unemployment rate has decreased since 2020, implying greater economic stability. The year 2023 was the lowest unemployment rate for the last five years with 5.7%. This coincides with the behavior of other indicators such as GDP and SAI.
Conversely, the labor participation rate presented for the years 2019 to 2023 shows a -.02% decline in percentage terms from 2019 to 2020. After that, it started to rise, but for the year 2023, it fell in comparison to the year before (2022). However, although 2023 reflected a slight percentage decrease compared to the previous year, its participation rate in 2023 is one of the highest in the last seven years.
Table 13. Participation Rate, No Seasonally Adjusted and Percentage Change; Fiscal Year 2019-2023
| Year | Participation Rate | Change% |
|---|---|---|
| 2019 | 40.7 | 0.6 |
| 2020 | 40.5 | -0.02 |
| 2021 | 41.2 | 0.7 |
| 2022 | 43.5 | 2.3 |
| 2023 | 43.3 | -0.2 |
Source: Resumen Económico de Puerto Rico Agosto 2023/Vol. III, Num. 8 estadisticas.pr/files/inventario/resumen_economico/2023-09-18/Revista-Resumen-Economico-ago-2023.pdf
- Gross Internal Investment of Fixed Capital
Investment in fixed capital is a key component in sustainable economic development. Therefore, construction plays a vital role in this sector. Below, this variable shows the percentage change in real prices in Puerto Rico:
Graph 9. Gross Internal Investment of Fixed Capital from 2001 to 2022:
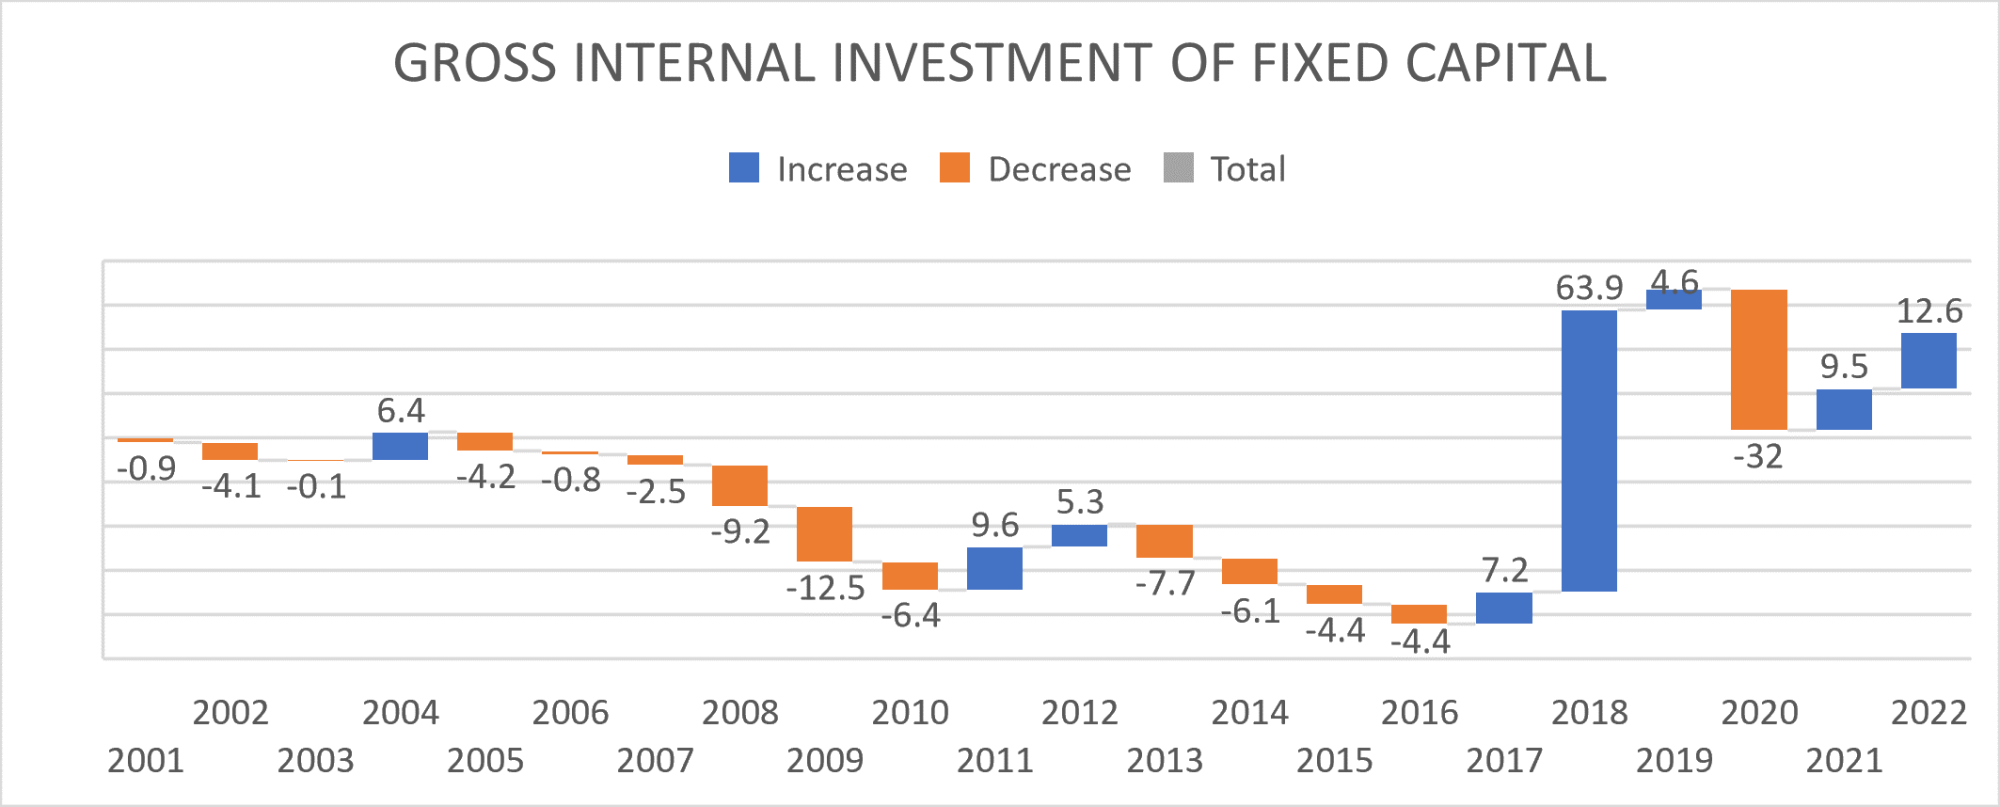
Source: DEDC. Resumen de Cuentas Sociales AF 2022
Table 14. Net Income to General Fund; Fiscal Year 2019-2023:
| Year | Net Income | Change % |
|---|---|---|
| 2019 | $ 10,234,191.00 | 25.3 |
| 2020 | $ 8,551,318.00 | -16.4 |
| 2021 | $ 10,312,148.00 | 20.6 |
| 2022 | $ 11,483,390.00 | 11.4 |
| 2023 | $ 11,162,520.00 | -2.8 |
Source: Resumen Económico de Puerto Rico Agosto 2023/Vol. III, Num. 8 estadisticas.pr/files/inventario/resumen_economico/2023-09-18/Revista-Resumen-Economico-ago-2023.pdf
Construction investment amounted to $4,846 million for the fiscal year 2022, showing an increase of 7.5%. At constant prices, there was an increase of 1.5% ($392.4 million).
- Machinery and Equipment Investment
Investment in machinery and equipment is important as it supports long-term economic management. The percentage behavior from 2001 to 2022 is as follows:
Graph 10. Machinery and Equipment Investment
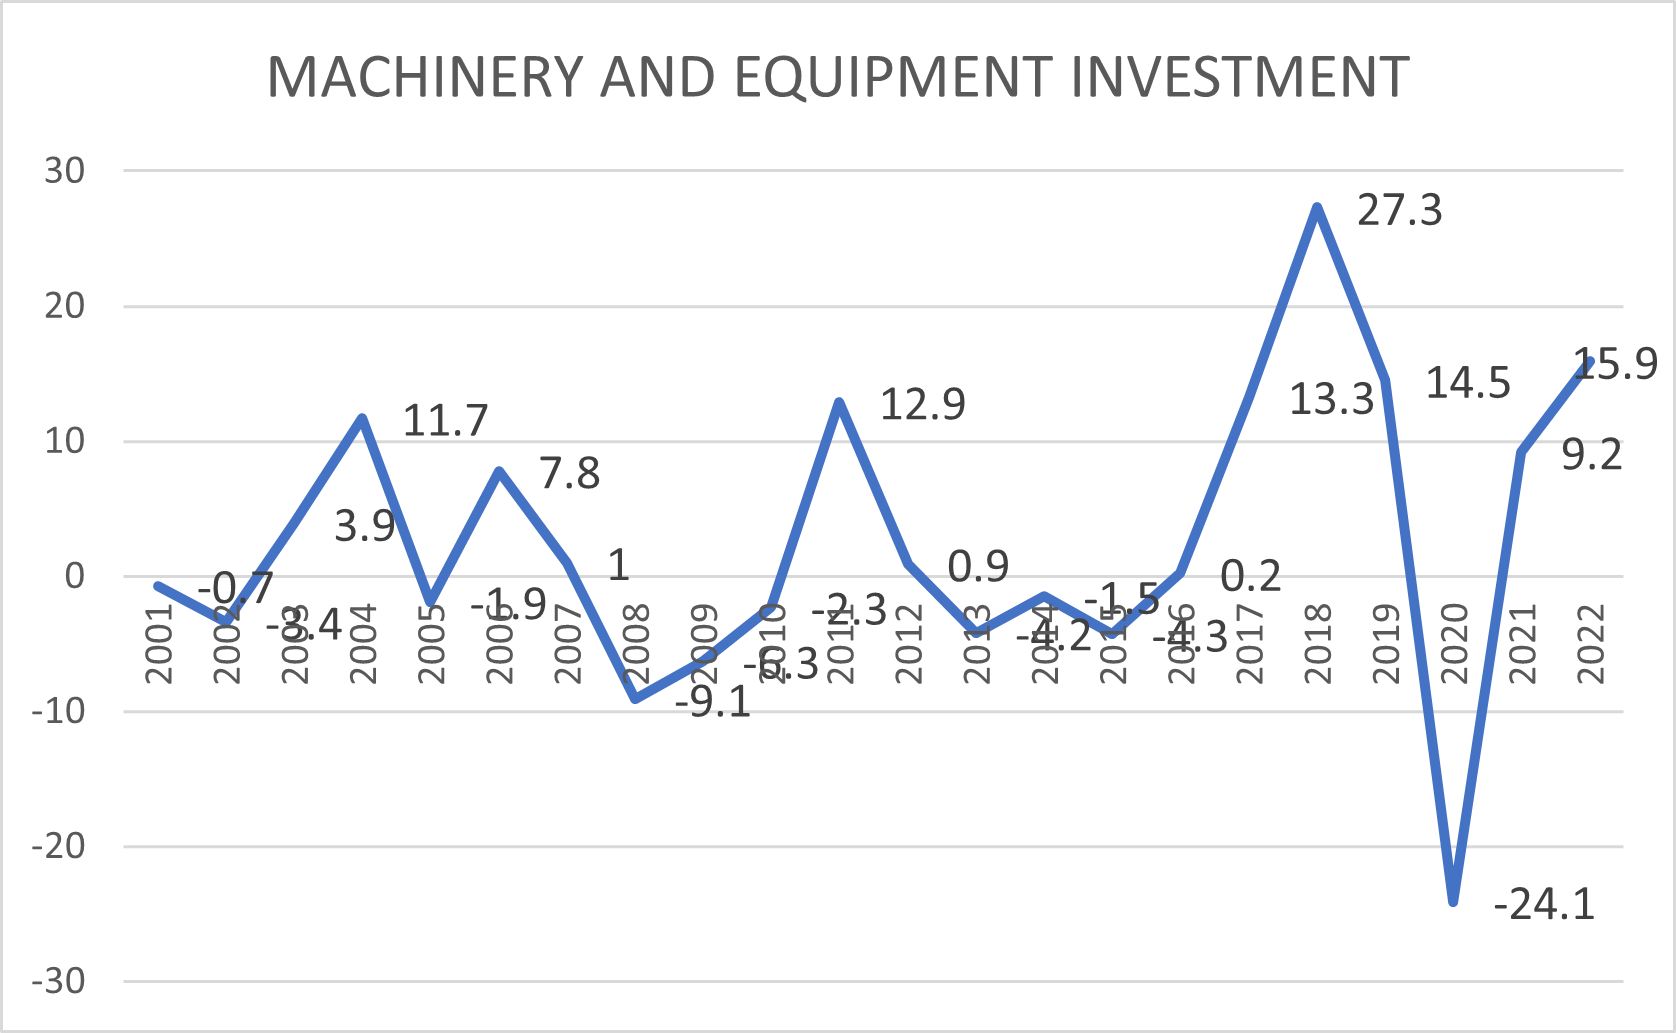
Source: DEDC. Resumen de Cuentas Sociales AF 2022
Investment in Machinery and Equipment increased by 15.7% ($9,431.6 million) in fiscal year 2022, showing an increase of 12.2%. At constant prices, there was an increase of 15.9%. ($1,490.3 million).
- Personal Consumption Expenditure
Personal Consumption Expenditure is an important variable because it is the main component of the consumption variable, and its behavior supports the growth of GDP. The behavior of disposable personal income from 2003 to 2022 is as follows:
Graph 11. Personal Consumption Expenditure from 2003 to 2022
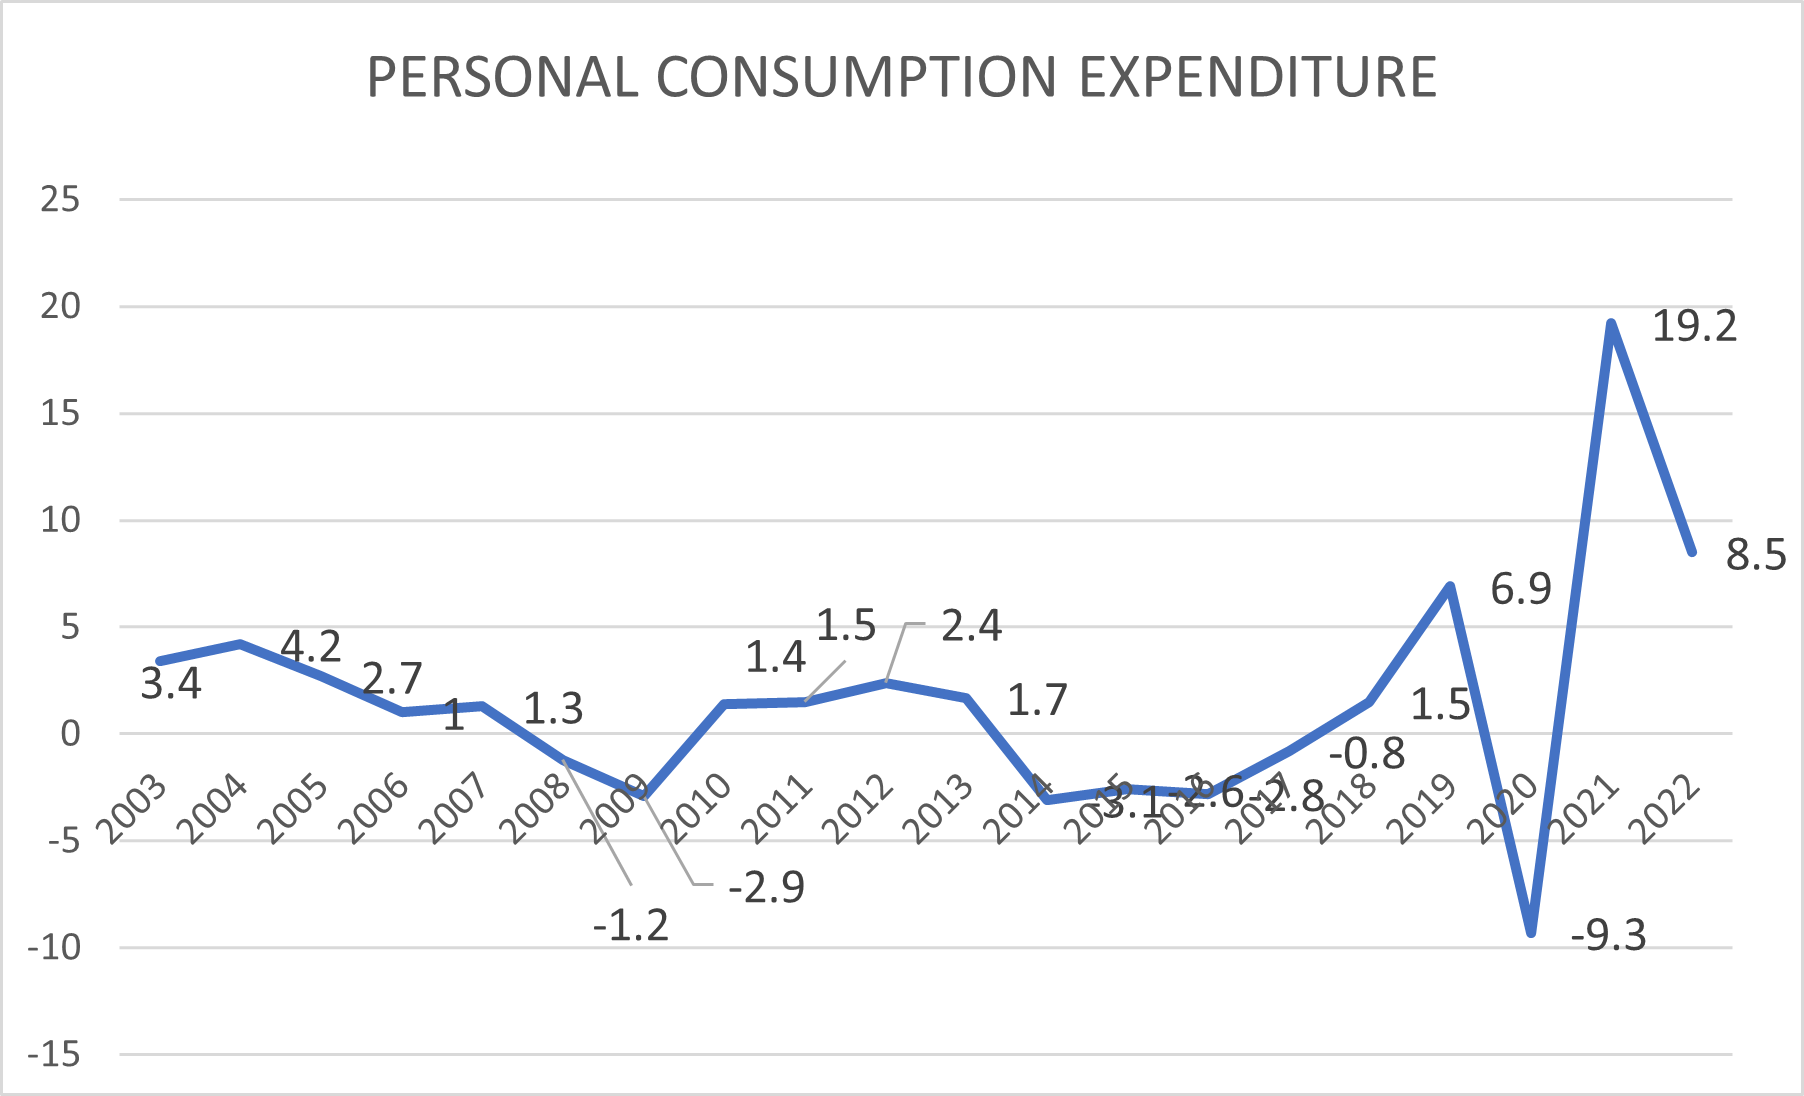
Source: DEDC. Resumen de Cuentas Sociales AF 2022
Personal consumption spending will increase by $82,415.5 million in fiscal year 2022, an increase of 13.6%. At constant prices, prices increased by 8.5%.
- Government Consumption Expenditure
The economic role of the government is to lead in terms of actions, expenditures, and investments aimed at improving society’s quality of life. Your contribution supports the efforts established for the development and sustainability of Puerto Rico’s economy. The percentage of consumer spending from 2003 to 2022 is as follows:
Graph 12. Government Consumption Expenditure from 2003 to 2022:

Source: DEDC. Resumen de Cuentas Sociales AF 2022
In fiscal year 2022, Government Consumer Spending was $7,794.5 million, up 2.7% from fiscal year 2021. At constant prices, a decrease of 0.2% was observed. For the Central Government, Consumer Expenditure amounted to $5,272.3 million, reflecting an increase of 2.9%. At constant prices, an increase of 0.2% was observed.
i. Existing Demand Industry Sectors and Occupation
This provides an analysis of the industries and occupations in which demand exists.
EXISTING OCCUPATIONS OF GREATER DEMAND IN THE INDUSTRIAL SECTOR
The world of work changes continuously according to the needs and demands of society. The effects of globalization and technological changes make society learn to avoid labor lag and adapt to the new work environment in which it faces. Puerto Rico, who is not exempt from these situations or economic fluctuations, identifies jobs or occupations that, according to economic activities, are in greater demand in the industrial sector. The occupations that saw the highest demand in Puerto Rico in 2020 included the following:
Graph 13. Occupation with Major Demand 2020:

Source: estadísticas.pr
According to the above graph, retailers (8.5%) represent the group with the highest demand for 2020, followed by cashiers (5.8%). These two occupations are operationally related, as they share the same work environment. This was followed by secretaries and administrative assistants (5%), medical secretaries (4.6%) and customer service representatives (4.1%). Although these occupations are in high demand, they must be constantly reviewed to see how they adapt to uncontrollable exogenous changes, such as the environment and technology, among others.
Other occupations reflected an increase in jobs from 2012 to 2022. Despite the events of Hurricanes Irma, Maria and Fiona, tremors, and the COVID-19 pandemic, the industries with the greatest increase in new jobs are (mercadolaboral.pr.gov).
- Local government, excludes Education and Hospitals
- Wholesale of Non-Durable Goods
- Social assistance
- Health and Personal Care Stores
- Professional and Technical Services
- General Merchandise Stores
- Outpatient Health Services
- Food Services and Beverage Venues
- Hospitals (Public and Private)
- Administrative Services
Considering that these occupations have been increasing, many are oriented toward the fields of health and food. Another crucial factor to consider for these higher in-demand positions is income. The occupations with the highest increase in hourly wages from 2012 to 2022 were as follows (mercadolaboral.pr.gov):
- Customer Service Representatives ($10.88)
- Garden and Green Areas Workers ($8.79)
- Food Preparation and Service Workers ($8.16)
- Secretaries and Administrative Assistants ($10.03)
- Personal Care Aides ($8.10)
- ATMs ($8.31)
- Security Guards ($8.34)
- Janitors and Housekeeping ($8.66)
- Registered Nurses ($16.22)
- Retail Sellers ($9.01)
These occupations could change because of the effects of a change in minimum wage, which could become a positive call.
ii. Emerging Demand Industry Sectors and Occupations
Provide an analysis of industries and occupations for which demand is emerging.
EMERGING OCCUPATIONS OF GREATER DEMAND IN THE INDUSTRIAL SECTOR
Changes in globalization and the world of technology have led to the emergence of new business strategies. The development of digital technology is one of the main causes for the disappearance of jobs, as the creation or development of others takes advantage of job opportunities that arise to meet the needs of society and even employers.
According to experts in this field, the occupations that will have the greatest opportunity in the labor field are those focused on the Digital Field, Business, Science, Technology, Engineering and Math (STEM) items, Green Economy, and Education. Some of the emerging profiles considered are as follows:
- AI Specialist – Responsible for making operational improvements based on machine learning and developing new processes, objects, or services to solve problems or conduct functions independently.
- Data Scientist (DS) – Responsible for extracting and analyzing huge volumes of data or information from multiple sources to transform them into valuable information.
- Data Analyst (DA) – Collects, manages, and interprets data sets to make strategic decisions in a company or organizations in any sector.
- Cloud Engineer (CE) – The CE is the specialist in designing, planning, implementing, and maintaining cloud systems in an organization.
- Cybersecurity Specialist (CS) – It is responsible for the privacy and data protection of companies and organizations to avoid or anticipate cyberattacks.
- "Community Manager" (CM) – It is a specialist in communication and "marketing" in digital environments.
- Sustainability Consultant (SC) – Analyzes the environmental impact of a company and proposes strategies to improve it.
- Logistics Expert (LE) - Manages and supervises all activities related to coordination, transport, and distribution of goods from origin to destination, both nationally and internationally.
- Experts in digital transformation (EDT) – They are responsible for leading innovation and technological transformation processes in organizations in any sector.
- Renewable Energy Expert (REE)– Specialist in designing, managing, and directing electricity generation projects based on renewable energy.
- Wellness and Health Coordinator (WHC) – Consists of organizing and developing prevention measures to protect the mental and physical health of workers.
- Expert in Edtech (EE) – Specialist in educational technology and digital skills that advises teachers and management teams in the proper implementation of technology in the educational center.
According to these labor trends, occupations are directed toward technology and STEM programs. This will promote greater operational flexibility as it facilitates remote or "blended" work. This will also represent a challenge for employers, who are responsible for identifying functions aimed at meeting the demands of society.
These emerging jobs will be able to share unique characteristics of adjusting and assimilating the changes demanded by media. Some key aspects that characterize these jobs in the future are as follows:
- Need for continuous training – The updating of knowledge is essential to maintain the job and respond to the challenges that arise.
- Development of transversal competences – These competences will have a lot of value in the professional profile. Competencies such as critical thinking, adaptability, proactivity, and teamwork will be highly valued.
- Adaptation and flexibility – These traits will facilitate adaptation to demanding changes and enable configuration in the ever-evolving labor field.
- Development of digital skills – Technology will be the fundamental basis for developing new guides and will help accommodation or permanence in the business world.
- Language proficiency – Many positions require the knowledge of two or more languages.
- New ways of working – Flexible jobs such as teleworking will emerge.
- Replacement of human labor by machines – The development of technological innovation causes employees to be replaced. This is also where developers of computer programs and information systems have come in.
- Productivity and orientation – It is challenging for employees to have the ability to organize and manage tasks to achieve established objectives.
- Proactivity and initiative – Companies value employees’ attitudes to meet the objectives of companies.
- Complex problem-solving – This will facilitate employees to immerse themselves in technology and train them to solve complex problems.
iii. Employer Employment Needs - The industry sectors and occupations identified in (A), (i), and (ii) provide an assessment of the employment needs of employers, including a description of the knowledge, skills, and abilities required, including credentials and licenses.
EMPLOYER NEEDS
The labor market is a dynamic one, where the constant changes in globalization, technology, and fiscal and monetary policy decisions, among others, make employers look for ways to reinvent themselves and promote new horizons to recruit the best possible talent and stay competitive. This work environment creates a continuous challenge for employers to maintain a balance between their costs and the expected productive performance to meet established objectives. Employers need to identify talent and provide the necessary tools for employees to develop the skills and training necessary to increase productivity for the benefit of the company. The following are some characteristics that the employer looks for in employees:
- Assessment
- Competence
- Achievement of objectives
- Stimulation
- Freedom and Flexibility
Employers should have a continuous seminar structure to reinforce their skills or provide new competitive tools to employees. In general, the employer must be flexible when selecting employees, as many of them do not necessarily have competitive skills. However, the reality is that human beings do not have the necessary tools for the positions connected, especially when the tasks relate to technology.
Operational strategies depend significantly on employees’ talent, knowledge, and capabilities. To remain competitive, employers must focus their efforts on the following:
- Funds for identifying and recruiting talent.
- Management of labor market data to understand and identify new business development opportunities.
- Analyze the productivity of employees and compare estimated production with actual production. With this, we can analyze the potential causes and effects of decision-making.
- Create and strengthen incentive programs for employers to offer on-the-job training.
- Possess labor tools and human resources where employees are motivated, thus increasing their labor productivity.
These are actions that employers must formalize as part of their strategies to get the right personnel, whose talents and knowledge can be exposed in the operational functions to achieve the objectives of the company.