
Located in:
- II. Strategic Elements
The Unified or Combined State Plan must include a Strategic Planning Elements section that analyzes the State’s current economic environment and identifies the State’s overall vision for its workforce development system. The required elements in this section allow the State to develop data-driven goals for preparing an educated and skilled workforce and to identify successful strategies for aligning workforce development programs to support economic growth. Unless otherwise noted, all Strategic Planning Elements apply to Combined State Plan partner programs included in the plan as well as to core programs. Where requirements identify the term “populations”, these must include individuals with barriers to employment as defined at WIOA Section 3. This includes displaced homemakers; low-income individuals; Indians, Alaska Natives, and Native Hawaiians; individuals with disabilities, including youth who are individuals with disabilities; older individuals; ex-offenders; homeless individuals, or homeless children and youths; youth who are in or have aged out of the foster care system; individuals who are English language learners, individuals who have low levels of literacy, and individuals facing substantial cultural barriers; farmworkers (as defined at section 167(i) of WIOA and Training and Employment Guidance Letter No. 35-14); individuals within 2 years of exhausting lifetime eligibility under the Temporary Assistance for Needy Families program; single parents (including single pregnant women); and long-term unemployed individuals. Additional populations include veterans, unemployed workers, and youth, and others that the State may identify.
- a. Economic, Workforce, and Workforce Development Activities Analysis
The Unified or Combined State Plan must include an analysis of the economic conditions, economic development strategies, and labor market in which the State’s workforce system and programs will operate.
- a. Economic, Workforce, and Workforce Development Activities Analysis
II. a. 1. A. Economic Analysis
The Unified or Combined State Plan must include an analysis of the economic conditions and trends in the State, including sub-State regions and any specific economic areas identified by the State. This must include—
i. Existing Demand Industry Sectors and Occupations
Provide an analysis of the industries and occupations for which there is existing demand.
ii. Emerging Demand Industry Sectors and Occupations
Provide an analysis of the industries and occupations for which demand is emerging.
iii. Employers’ Employment Needs
With regard to the industry sectors and occupations identified in (A)(i) and (ii), provide an assessment of the employment needs of employers, including a description of the knowledge, skills, and abilities required, including credentials and licenses.
Current Narrative:
ECONOMIC, WORKFORCE, AND WORKFORCE DEVELOPMENT ACTIVITIES ANALYSIS
The High-Level Numbers Look Good
Washington’s economy is strong overall, but an uneven prosperity reveals challenges to consider as policymakers, employers and labor leaders work to implement Talent and Prosperity for All (TAP) the next four-year workforce strategic plan.
While the pandemic in 2020 was traumatic in many ways, including the unexpected shuttering of businesses and loss of jobs, the state’s economy has recovered well since then.
Figure 1
National and State GDP
2005-2023, Quarterly
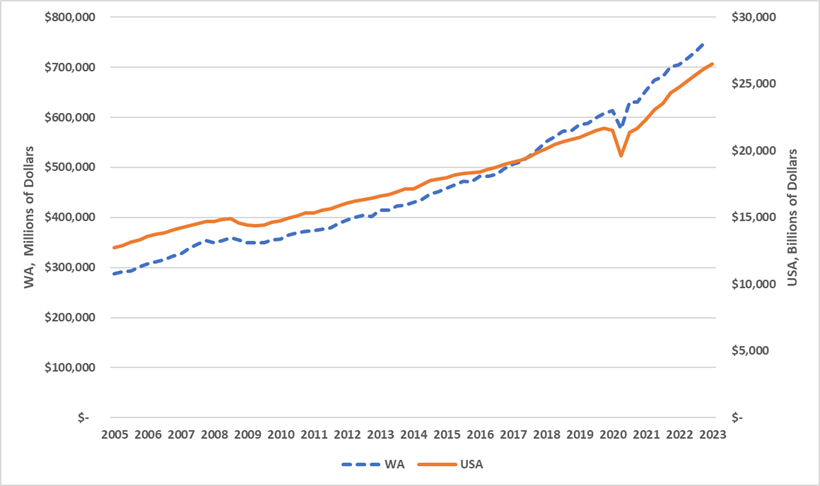
Source: U.S Bureau of Economic Analysis
Washington’s high-level economic data has been very good, especially since the end of the Great Recession in 2009. Figure 1 shows how the state’s economic output expressed as gross domestic product (GDP) has accelerated faster than that of the nation. As of 2022, only four states had a higher per capita GDP than Washington, and only five states had higher per capita personal income.
Figure 2
National and State Employment Levels
1990-2023, Monthly
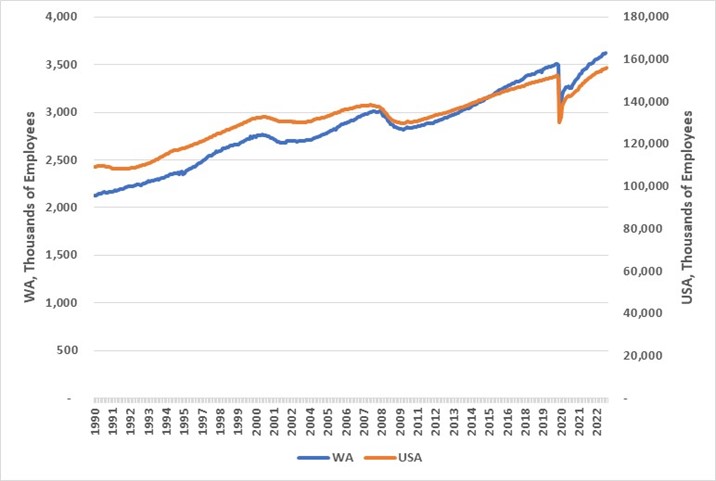
Source: U.S. Bureau of Labor Statistics
Similarly, Washington state employment levels have recovered and moved beyond pre-pandemic levels (see Figure 2). The earnings of these workers in 2022 were on average just under $84,000. This was 20% higher than the national average of about $67,000 and higher than all but three other states. So, on average things are relatively great in the Evergreen State.
Prosperity Not Equally Shared
Average is the key word though – as we know the average income in a given room jumps to millions when Bill Gates enters it. The state’s average wage is driven by the exceptional earnings of workers in King County where, on average, workers earned just shy of $114,000 in 2022. This is 35% higher than the state’s average wage. However, when King County—the state’s most populous and highest-earning county—is removed, then Washington’s average earnings plummet to $62,800, with five counties well below $50,000. That would drop us to 24th highest earning state—at the middle of the pack—just below North Carolina.
Figure 3
Average Annual Pay 2022
Highest and lowest counties in Washington State
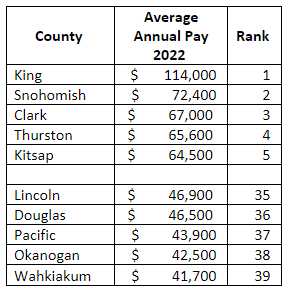
Source: U.S. Bureau of Labor Statistics
*Rounded to nearest hundred
Figure 3 depicts Washington’s top five earning counties in 2022 along with the bottom five earning counties. No surprise, King County is the highest earner, followed distantly by Snohomish, then Clark County. Note that King County was the only county with above average earnings. The bottom five counties are a mix of rural counties from across the state with the lowest earner being Wahkiakum at $41,700. King County workers earned nearly three times as much on average as Wahkiakum workers, although of course Seattle area workers also faced significantly higher cost of living challenges, particularly in housing.
There are likely several causes for these geographic disparities. One is the differing demographics in race, ethnicity, education level, employment history, and other factors. In the next chapter we explore demographics. For now, we will focus on other causes, in particular industry composition.
Industry Composition
The information industry notched both the highest average wage as well as the most total wages paid out in Washington in 2021—see Figure 5. Nearly one in seven dollars paid out by state firms was done so by firms in the information industry. Other high-paying industries in Washington include: management of companies and enterprises; professional, scientific, and technical services; and finance and insurance industries. They were respectively the 2nd, 3rd, and 4th best paying industries.
Figure 4
Average Industry Wages and Employment 2021
Highest and Lowest in Washington State, 2-digit NAICS

Source: Washington State Employment Security Department
Quarterly Census of Employment & Wages
The Accommodation and Food Service industry had the lowest average wage statewide; followed by agriculture; then arts, entertainment, and recreation. The average annual wage in the Information industry was nearly 10 times as high as wages paid to workers in Accommodation and Food Service.
King County has far and away the most employment in the state, accounting for 41% of the states’ total employment in 2021. Many of those workers were also concentrated in relatively higher wage industries, with King County accounting for 86% of the information industry employment, 70% of the management of companies and enterprises, and 63% of the professional and business services. At the same time, Washington’s most populated county accounted for 35% of statewide accommodation and food service employment.
Regionalization of Industries
This concentration of high paying industries and relative dearth of low-paying industries in King County goes a long way in explaining the disparity between its relative prosperity when compared with the rest of the state.
Relative industry concentrations of employment can be determined by region through a tool called Location Quotients. It is a ratio of how big a given industry is in a particular area (West Urban for example) compared to how big it is in a larger area (Washington state). For example, in Figure 5, see that the employment location quotient (LQ) for Accommodation and Food Services in the Rural East region equaled 1.00. This means that employment there as a portion of all employment is equal to that industry’s share of employment at the state level. In other words, its share of the regional employment is exactly equal to its share of statewide employment. Less than 1.0 means comparatively low share and above 1.0 means comparatively high share.
Figure 5
2022 Employment Location Quotients by Region
2-digit NAICS broken out by 4-regions
| Industry Title | Rural1 West | Rural2 East | Urban3 East | Urban4 West |
|---|---|---|---|---|
| Agriculture, Forestry, Fishing & Hunting | 1.23 | 6.04 | 3.68 | 0.21 |
| Mining, Quarrying, & Oil & Gas Extraction | 5.12 | 1.81 | 1.08 | 0.76 |
| Utilities | 1.81 | 3.35 | 1.42 | 0.78 |
| Construction | 1.00 | 0.72 | 0.96 | 1.02 |
| Manufacturing | 1.05 | 1.50 | 0.89 | 1.00 |
| Wholesale Trade | 0.69 | 0.87 | 1.00 | 1.02 |
| Retail Trade | 0.95 | 0.65 | 0.79 | 1.06 |
| Transportation and Warehousing | 1.04 | 0.75 | 0.95 | 1.02 |
| Information | 0.16 | 0.17 | 0.14 | 1.26 |
| Finance and Insurance | 0.60 | 0.42 | 0.97 | 1.05 |
| Real Estate and Rental and Leasing | 0.73 | 0.58 | 0.72 | 1.09 |
| Professional, Scientific, & Tech. Services | 0.41 | 0.35 | 0.66 | 1.13 |
| Management of Comp. & Enterprises | 0.21 | 0.08 | 0.65 | 1.15 |
| Admin. & Support & Waste Mgmt., & Remediation Services | 0.68 | 0.43 | 0.94 | 1.05 |
| Educational Services | 1.19 | 1.95 | 1.10 | 0.93 |
| Health Care and Social Assistance | 1.13 | 0.86 | 1.29 | 0.94 |
| Arts, Entertainment, and Recreation | 1.49 | 0.63 | 0.86 | 1.02 |
| Accommodation and Food Services | 1.53 | 1.00 | 1.11 | 0.95 |
| Other Services | 1.28 | 0.68 | 0.76 | 1.05 |
| Public Administration | 1.99 | 1.25 | 1.08 | 0.93 |
Source: Washington State Employment Security Department, QCEW
The Information Industry, the highest paying in the state, shows the most regional distinction with LQs. For the Rural West, Rural East, and Urban East regions the information LQ was 0.17 or lower, whereas it was 1.26 for the Urban West region. Similar patterns emerge for the “White Collar” type industries of Finance and Insurance; Real Estate and Rental and Leasing; Professional, Scientific, & Tech. Services; and Management of Comp. & Enterprises. Conversely, agriculture and mining industries have very low LQs for Urban West but are high for the other regions.
This LQ analysis shows that the high-paying industries like information and Management of Companies & Enterprises are disproportionately found in King County (and other Western Urban Counties). On the other hand, the lower-paying industries of Agriculture and Accommodation industries are disproportionately found outside of King County.
Occupations
What a person does is often as important if not more important than who they work for in determining labor market outcomes. Washington state is projected to see growth in occupations that pay well, as well as those that pay well below average. Figure 6 shows the top 25 fastest growing occupations in the state. This is defined as those with the most projected openings due to growth (as opposed to openings due strictly to job turnover or movement from similar occupation to similar occupation).
Figure 6
Occupations with most Growth 2022
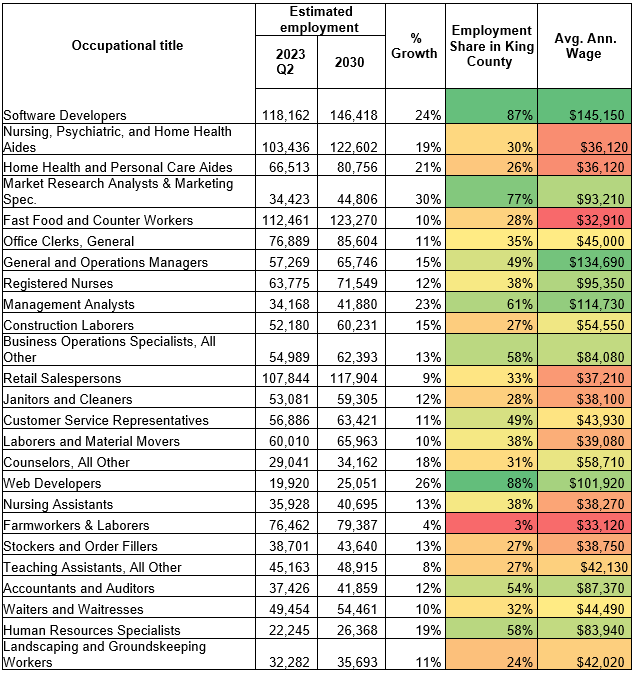
Source: Washington State Employment Security Department, OES & Occupational Projections
Outside of General and Operations Managers, of which just under half were in King County, most high-paying occupations were predominate in King County. Typical of this trend were Software Developers, Market Research Analysts and Marketing Specialists, and Web Developers. In essence what this data is telling us is that while growth occupations are geographically dispersed, high-paying ones are not.
In addition, we have seen falling labor force participation rates. As of October 2023, 64.3% of the state’s population (age 16 and over) was in the labor force (meaning working or looking for and able to work). This is down from a recent high of 66.2% in April 2020 and was as high as 69.9% in December 1998.
Business Characteristics
Employers are the critical other half of the state’s workforce equation, and their financial health and overall economic conditions are critical to labor markets. Dun and Bradstreet, a company that provides business intelligence and analytics through proprietary software, makes data available looking at the relative health/outlook (distress) for businesses. Figure 7 shows this broken out by characteristics of the business owner as well as by Workforce Development Area. There are 12 workforce regions in Washington.
[1] For information on how WDCs are defined see: Local Workforce Development Boards - Washington Workforce Association
Figure 7
Business Characteristics 2023
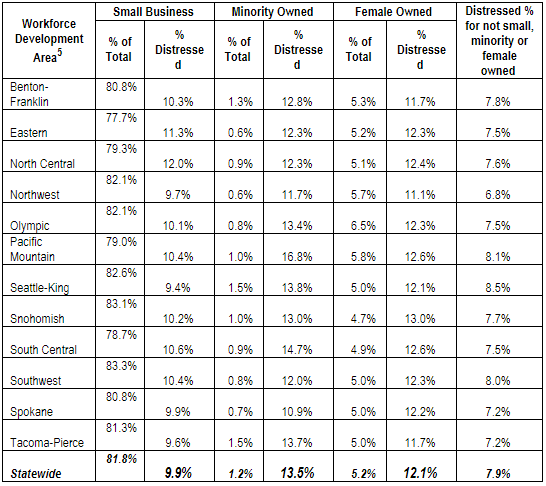
Source: Dun & Bradstreet
According to this data source, there is not a strong level of difference in distressed level when looking at it by area, however the owner characteristics see real differences. Companies that are not owned by a minority, a female or are small had just 7.9 % of firms considered to be distressed. Conversely nearly 14% of minority-owned businesses and just over 12% over female-owned were distressed. Additionally small businesses were also more likely to experience distress (0.9 percent).
Hiring Gaps
It is well known that since the pandemic Washington's employers, like those across the nation, have struggled to find workers. However, it is not always an easy thing to measure and much of the information on hiring gaps is anecdotal. There is however federal survey data collected on Job Openings, JOLTS (Job Openings and Labor Turnover Survey) that collects some information. The table below compares job opening and quit rates for various industries. Industries with the highest number of openings were Accommodation and Health Care, whereas industries with the highest quit levels were Accommodation and Retail. While this data is not available at the state level, it would likely be mirrored locally.
Comparing Rates for Jobs Openings and Quits
USA, 2022
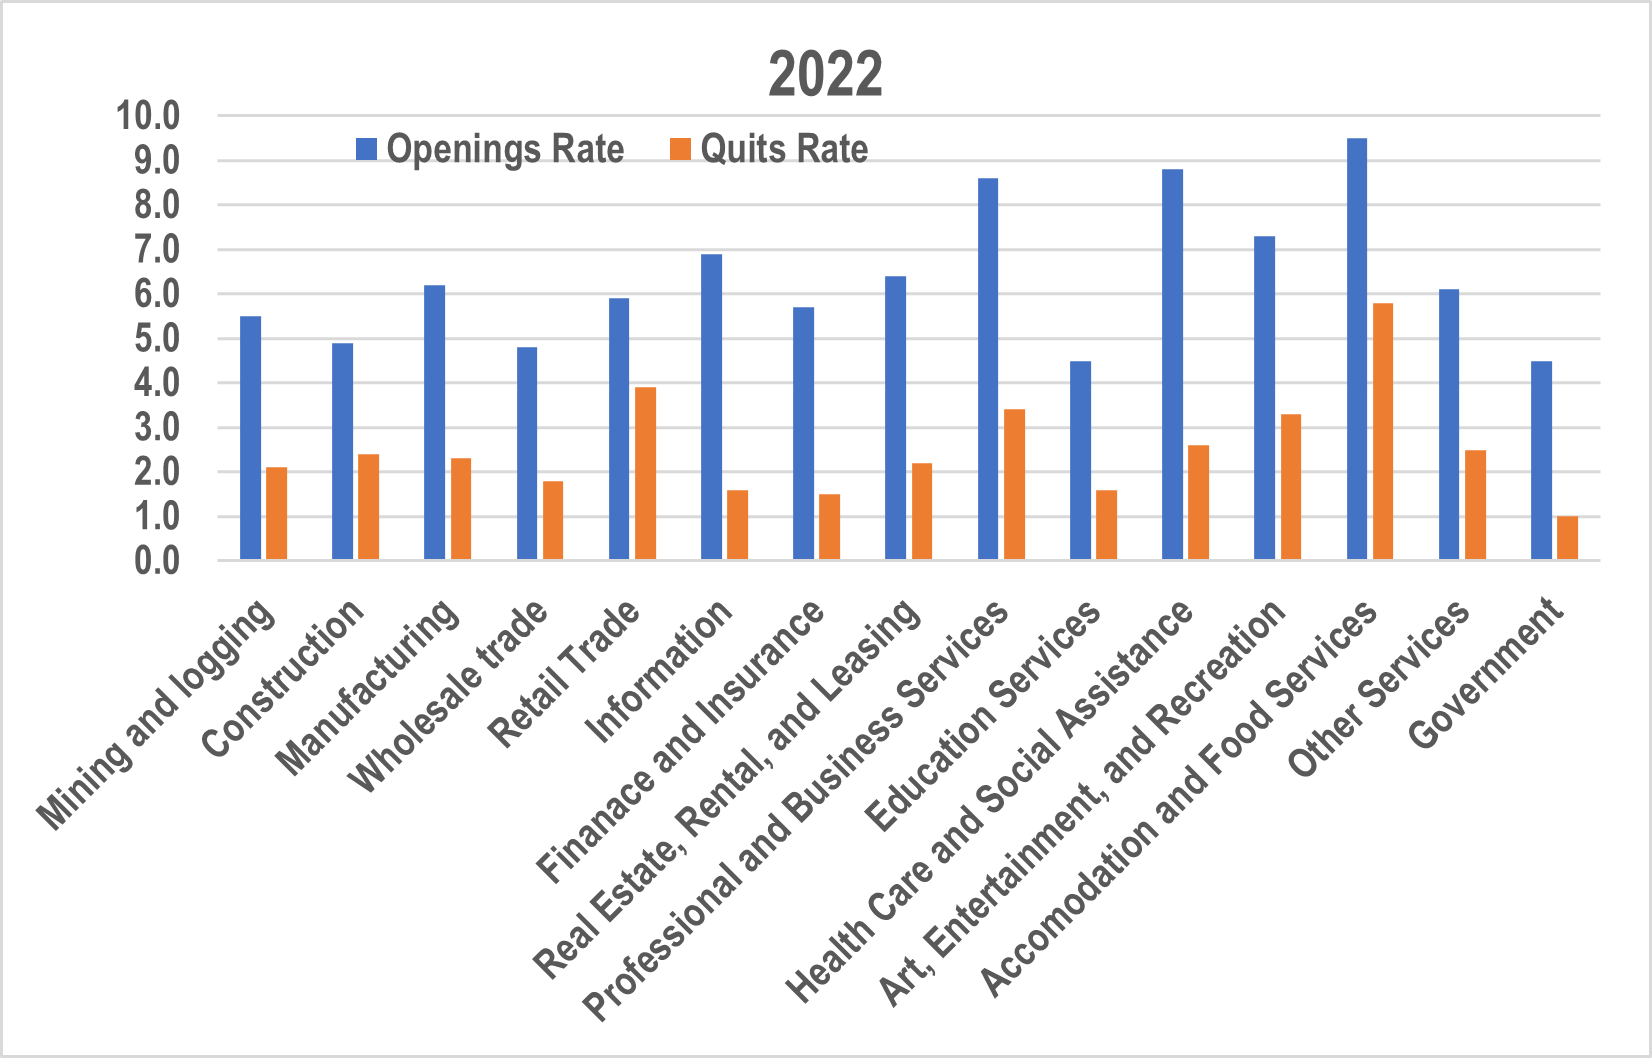
Source: U.S. Bureau of Labor Statistics, JOLTS
Data does allow us to get estimates of the numbers of unemployed persons relative to the number of job openings. The below chart shows the trend in this comparative measure from 2006 to 2023. The data shows that in weak labor markets (like the Great Recession and the Pandemic) the number of unemployed is high relative to job openings – seven unemployed Washingtonians per job opening in the Great recession and slightly over that during the pandemic. In the current tight labor market, there is less than one unemployed person per job opening.
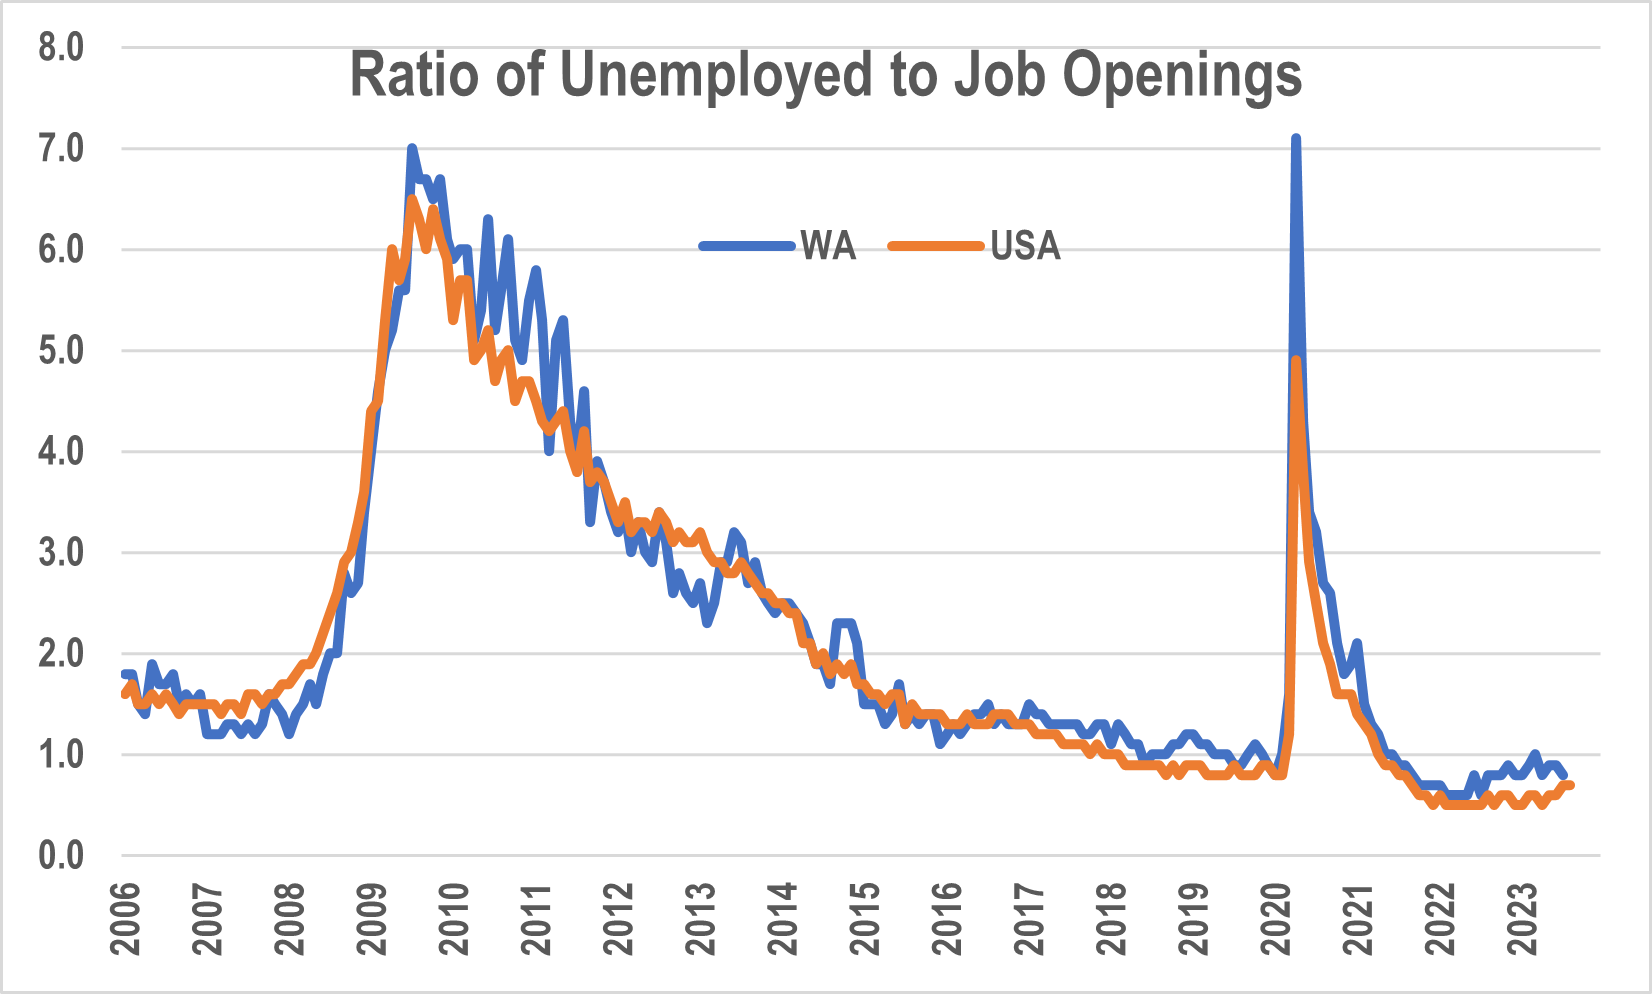
Source: U.S. Bureau of Labor Statistics, JOLTS
The Employer Workforce Needs and Practices and Satisfaction Survey
The Employer Survey is a scientific survey designed to identify employer needs and practices, as well as employer satisfaction with workforce system services to better meet the needs of its customers. The findings, which are generalizable to employers on average in the state, helps clarify the workforce system’s value proposition, customer pain points, areas of improvement, and domains of strength, as well as estimates for employer awareness of these services. The primary research objectives are:
- Assess the difficulty Washington employers have in finding qualified applicants
- Estimate future needs for skilled employees
- Identify types of training that employers provide themselves
- Assess employer awareness and engagement with the Workforce System
The Employer Survey uses a combination of mail, phone, and online collection. The latest survey sample included 30,000 records and achieved a 6.5% response rate. A sufficiently large number of survey mail-outs were required to reliably sample from all 12 workforce development areas. Several factors were identified as contributing to lower response rates in the past, including survey length, bad address data, and lack of an explicit survey follow-up strategy. Past improvements that boosted survey response rates included reduced survey length, supplemental web-survey options, telephone follow-ups, and a cover letter within the mailed-out survey package indicating co-sponsorship supported by the Association of Washington Business (AWB) and Washington Chamber of Commerce Executives (WCCE). These past improvements were applied for the redesign and administration of the 2020 survey.
Local Workforce Boards and State agencies charged with administering Workforce Development Programs were consulted on the questionnaire development. The survey is used in the preparation of strategic state-level workforce development plans and in the strategic plans of the Workforce Development Councils serving 12 local workforce areas in Washington. The governor and state legislature have used past survey estimates to prepare the budget related to workforce development in the state.
Project Budget was approximately $200,000, with an additional estimated 480 FTE staff hours allocated to the project at a cost of about $33,600.
The 2020 Employer Survey yielded key insights regarding opportunities for improvement in service delivery:
- 70% of Washington employers claimed that finding qualified talent was their biggest workforce challenge.
- Manufacturers are 12% more likely than all other employers to report recruitment as their biggest challenge.
- Small employers (less than 20 employees) make up 90% of businesses and employ 20% of the Washington labor force.
- Small employers are 10% more likely than larger employers to report recruitment as their biggest workforce challenge.
- 17% of small employers that reported recruitment as their biggest workforce challenge also reported having to turn down new business opportunities because of that challenge. Only 2% of larger businesses turned down new business opportunities because of recruitment challenges.
- Larger employers have access to more recruitment tools.
- 70% of employers that increased recruitment efforts reported successful outcomes to address recruitment challenges.
- 30% of larger employers use WorkSourceWA, whereas only 9% of small employers do.
- 80% of employers that automated certain job functions reported successful outcomes to address recruitment challenges.
- 70% of employers that lowered job requirements reported successful outcomes to address recruitment challenges.
- 36% of Washington employers are unaware of the state’s workforce system services.
- 26% of employers claimed to not use state workforce system services because they think the services do not fit their needs.
- 12% of employers claim job candidates from the state workforce system would be the wrong fit for their organization.
- Larger employers are 13% more likely to report turnover and retention as their biggest workforce challenge.
- 11% of employers that report turnover and retention as their biggest challenge also report having turned down new business opportunities because of that challenge.
- 7% of employers reported training and professional development as their biggest workforce issue.
The complete employer survey report is thorough and includes a full description of the technical methodology and in-depth findings. The report is available through the WTB website: https://wtb.wa.gov/employer-survey/.
Conclusion
The data shows that when taken in aggregate our economy and labor markets are performing very well, with Washington considered a national leader. However, when drilling down by geographic area and industry we begin to see a very different and more challenging picture, with considerable differences among different regions of the state.