Located in:
- Senior Community Service Employment Program (SCSEP)
(OMB Control No. 1205-0040)
a. 1. Discuss long-term projections for jobs in industries and occupations in the State that may provide employment opportunities for older workers. (20 CFR 641.302(d)) (May alternatively be discussed in the economic analysis section of strategic plan.)
Current Narrative:
According to the United States Census Bureau, West Virginia’s population totaled 1,829,054 during the last conducted census in 2020. The total number of West Virginians aged 55 and older totaled 617,395, comprising 41.23% of the state’s total population (an 10.89% increase since 2010 census). Table 1-SCSEP illustrates the total population categorized by age ranges.
Table 1- SCSEP
| West Virginia Population By Age Group | |||
|---|---|---|---|
| Age group | United States | West Virginia | Percent Total WV |
| 15 to 19 years | 21,880,801 | 112,676 | 7.52% |
| 20 to 24 years | 22,239,579 | 113,691 | 7.59% |
| 25 to 34 years | 45,388,153 | 210,919 | 14.08% |
| 35 to 44 years | 42,810,359 | 215,117 | 14.36% |
| 45 to 54 years | 41,087,357 | 228,098 | 15.23% |
| 55 to 59 years | 21,535,299 | 120,980 | 8.08% |
| 60 to 64 years | 21,042,176 | 129,971 | 8.68% |
| 65 to 74 years | 32,260,679 | 219,725 | 14.67% |
| 75 to 84 years | 15,966,862 | 107,203 | 7.16% |
| 85 years and over | 6,510,107 | 39,516 | 2.64% |
(Source: Table 1 - SCSEP; US Census Bureau ACS 5-Year Estimates 2018-2022)
According to the Quarterly Workforce Indications (QWI), out of the twenty industries, the industry sectors that represented the largest numbers of employed seniors during 2019-2022 were Health Care and Social Assistance, Education Services, Retail Trade and Manufacturing. These sectors were the top four employers for older workers 55+ during 2019-2022. Table 2- SCSEP illustrates the industries during 2019-2022 that had the largest number of older workers.
Table 2- SCSEP
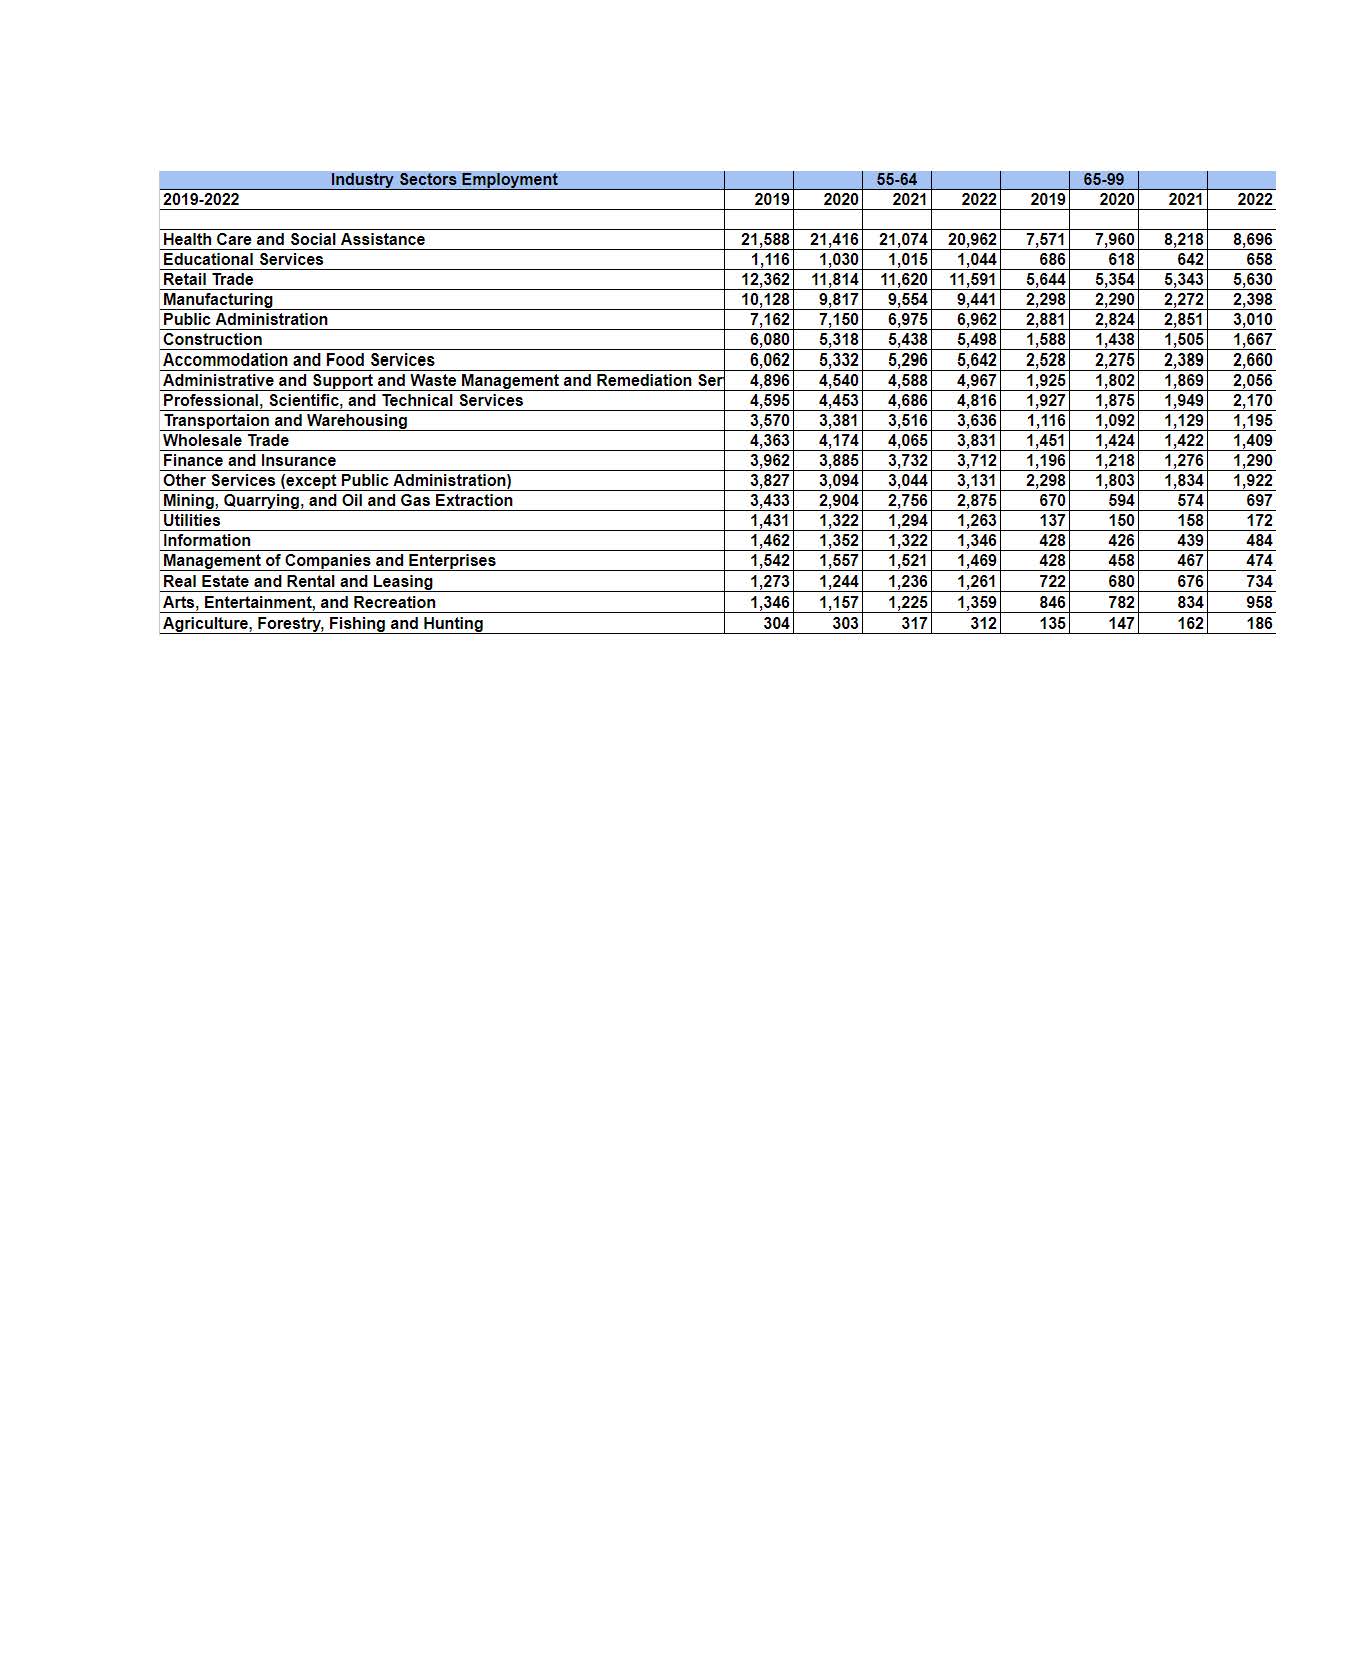
(Source: Table 2 - SCSEP; QWI, NAICS Sectors, 2019-2022)
Information from the QWI was narrowed down to display which of the 20 Industry Sectors had the highest number of hiring older workers (55+). Industry Sectors with the largest number of hires of older workers during 2019-2022 for age range 55-64 were Health Care and Social Assistance, Construction, Administrative and Support and Waste Management and Remediation Services, Retail Trade. For the age range of 65-99 the results varied. Similar to the age range 55-64, Health Care and Social Assistance was also the top employer for the age range 65-99. Educational Services, Retail Trade, Accommodation and Food Service were the remaining top employers that had the highest number of employed seniors for the age range 65-99 . Table 3 - SCSEP illustrates the industries during 2019-2022 that had the largest number of 55+ seniors hired.
Table 3- SCSEP
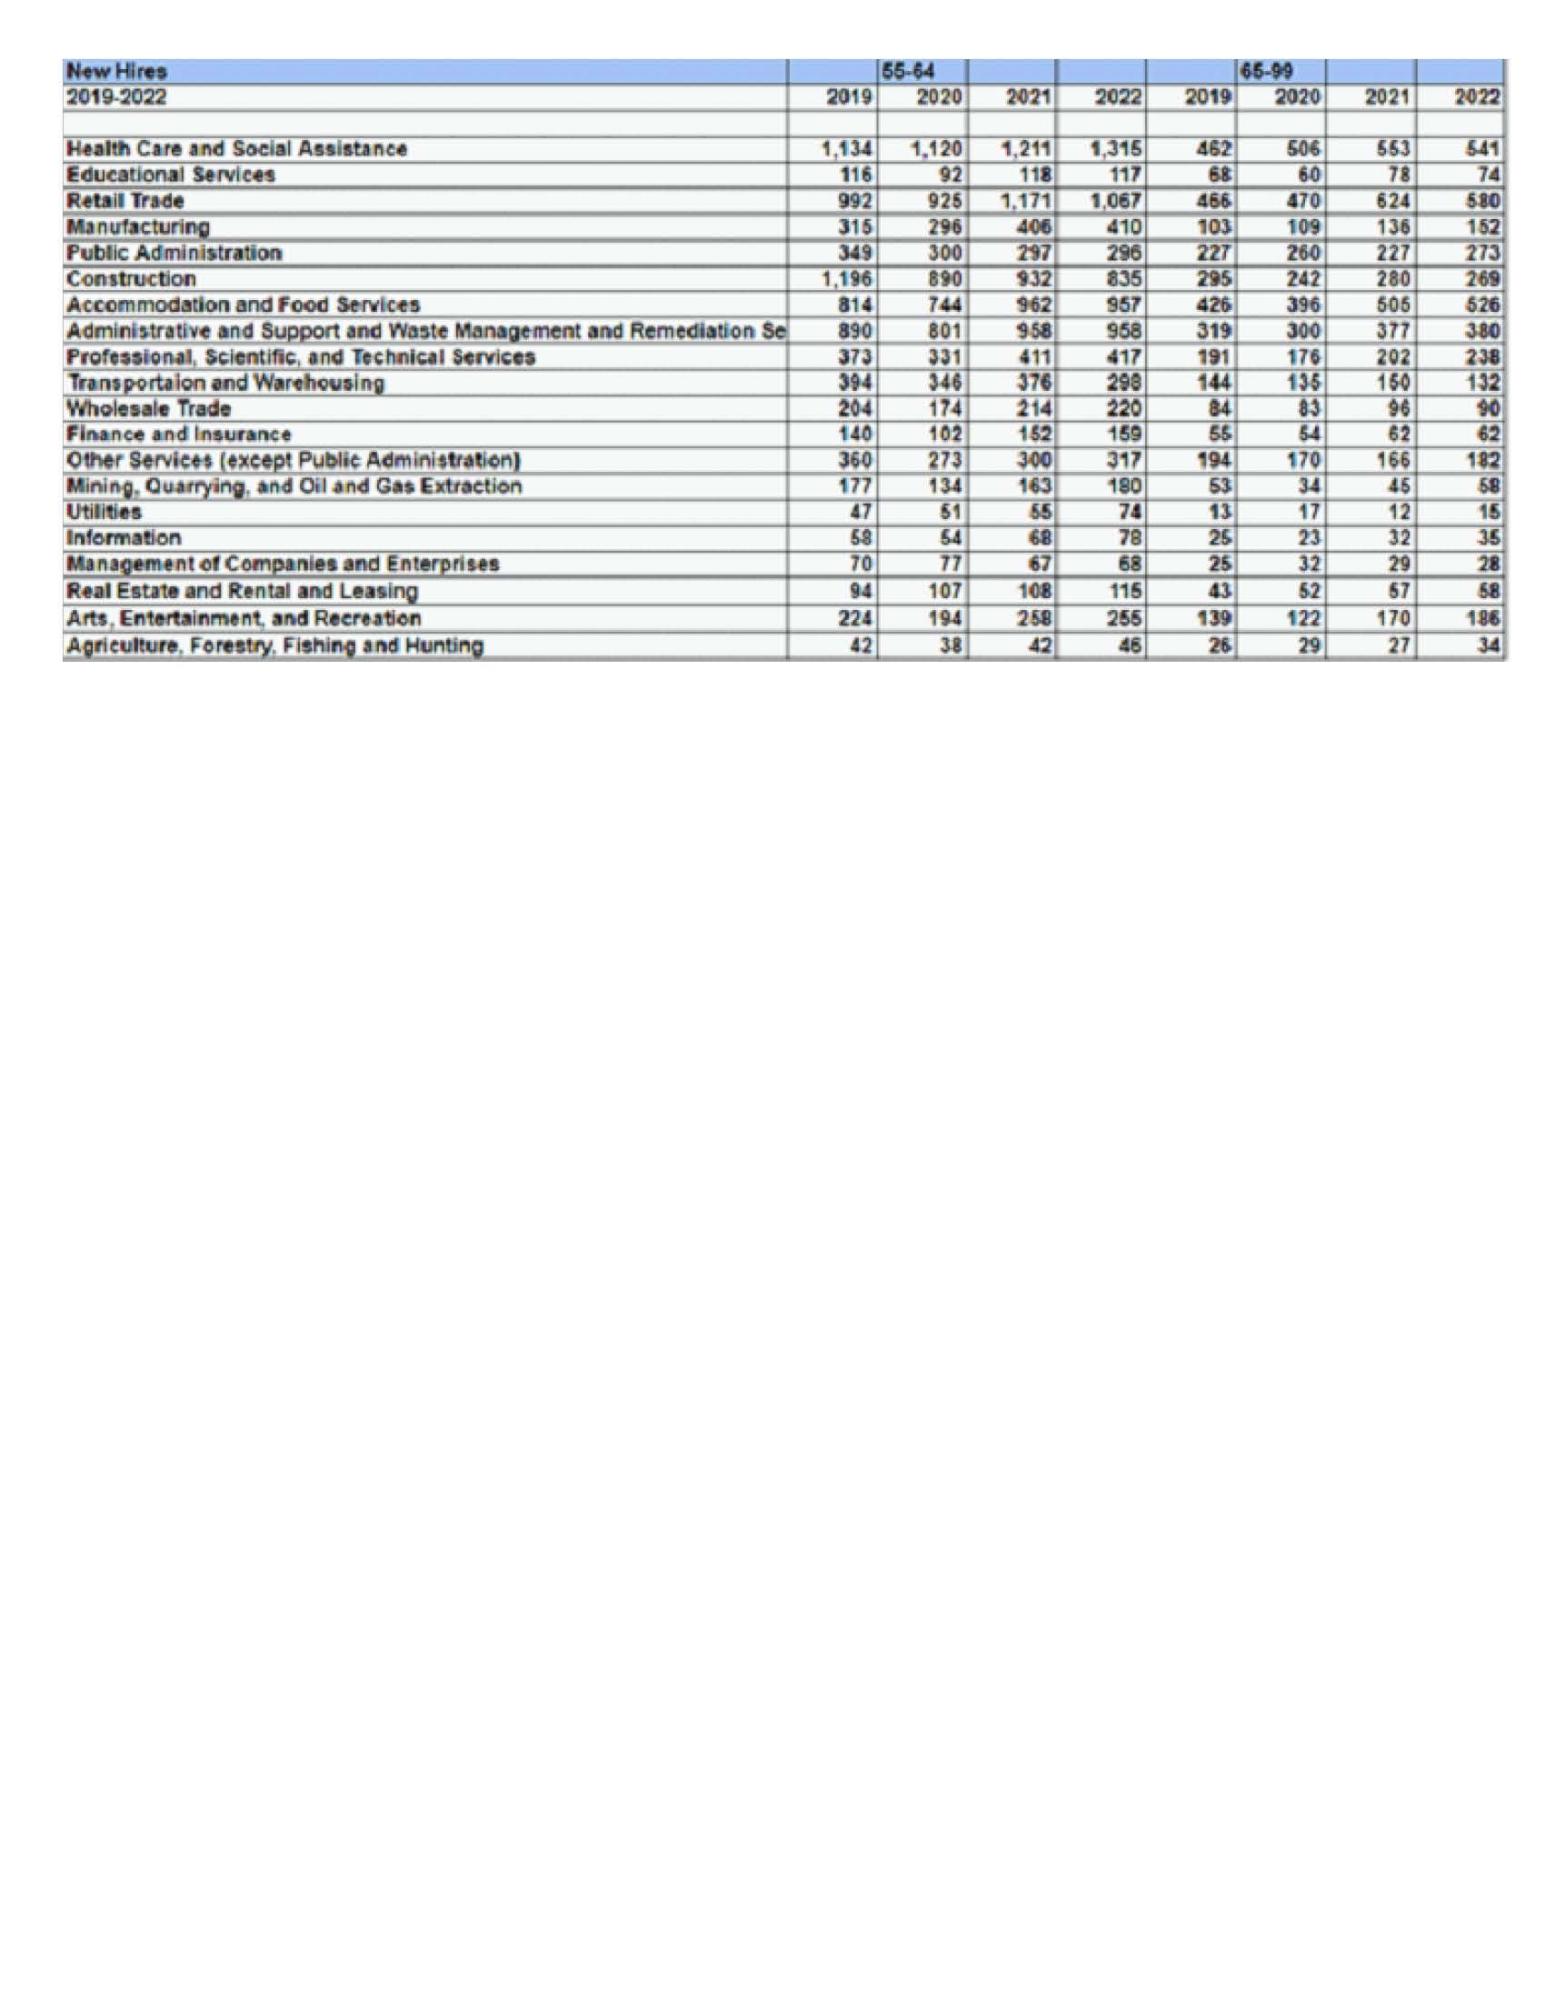
(Source: Table 3 - SCSEP; QWI, NAICS Sectors, 2019-2022)
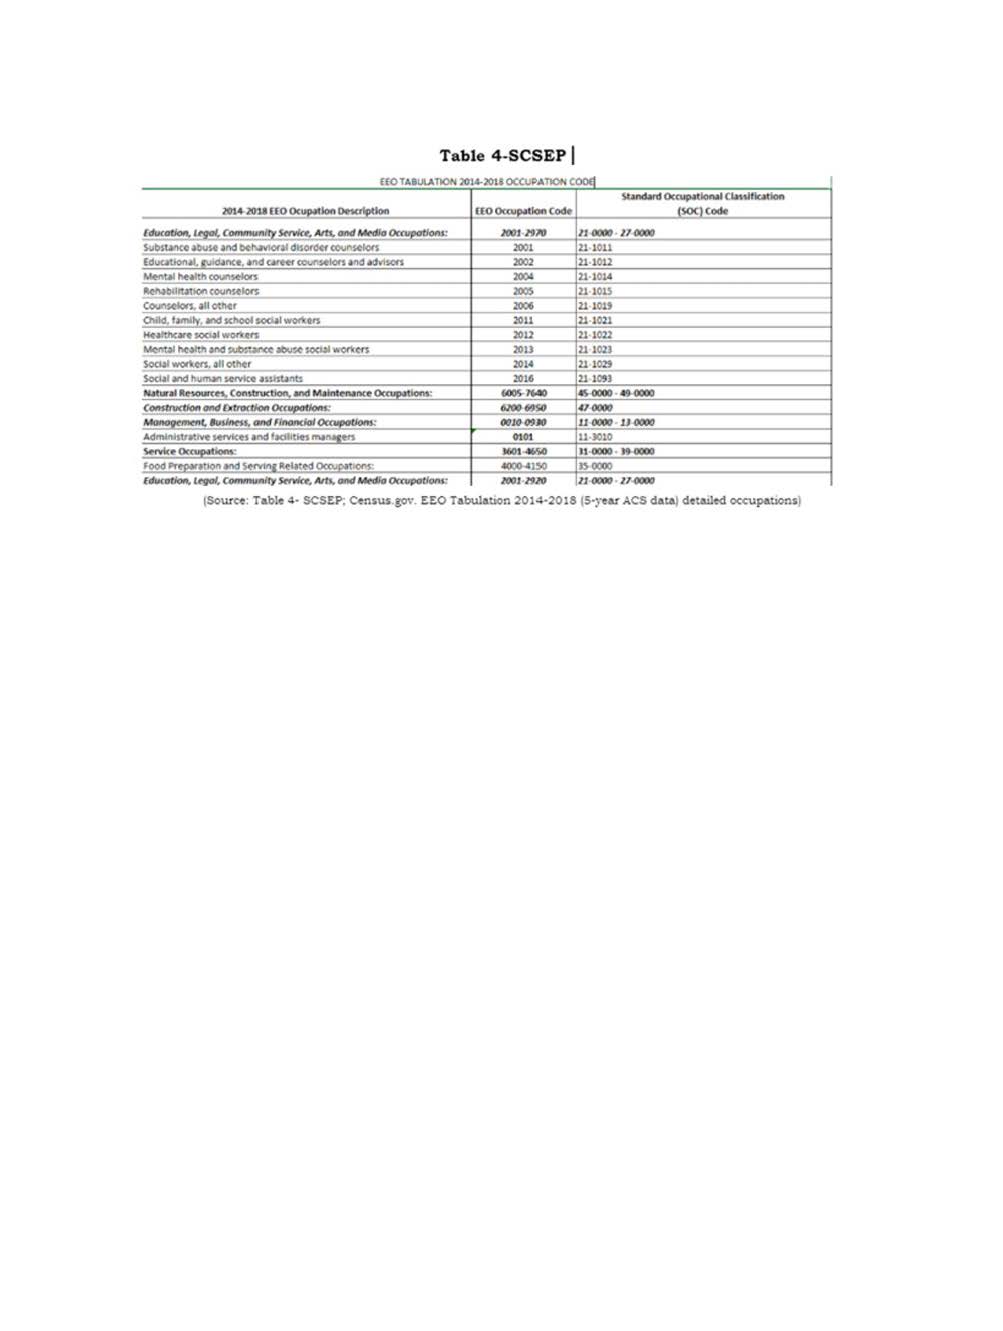
From the information gathered in Table 3-SCSEP, the staffing patterns from the top three Industry Sectors of New Hires show employment in Healthcare and Social Assistance, Administration and Support Waste Management and Remediation Services, Construction, Accommodations and Food Services, Educational Services and Retail Trade . We can predict that these industries will continue to hire older workers, thus providing employment opportunities in the following Equal Employment Opportunities (EEO) Occupations Groups based off the Industry Sector of New Hires: Transportation, Natural Resources, Construction & Maintenance Occupations, Sales and Office Occupations, Service Occupations, Education, Legal, Community Service, Arts & Media Occupations, Management, Business & Science. EEO Occupational Groups are categorized into 14 groups and further categorized into nine job categories. Table 4-SCSEP illustrates the twelve Occupational Groups that were narrowed down from the top Industries.
Table - 4 SCSEP