


Located in:
- II. Strategic Elements
The Unified or Combined State Plan must include a Strategic Planning Elements section that analyzes the State’s current economic environment and identifies the State’s overall vision for its workforce development system. The required elements in this section allow the State to develop data-driven goals for preparing an educated and skilled workforce and to identify successful strategies for aligning workforce development programs to support economic growth. Unless otherwise noted, all Strategic Planning Elements apply to Combined State Plan partner programs included in the plan as well as to core programs.
- a. Economic, Workforce, and Workforce Development Activities Analysis
The Unified or Combined State Plan must include an analysis of the economic conditions, economic development strategies, and labor market in which the State’s workforce system and programs will operate.
- a. Economic, Workforce, and Workforce Development Activities Analysis
II. a. 1. A. Economic Analysis
The Unified or Combined State Plan must include an analysis of the economic conditions and trends in the State, including sub-State regions and any specific economic areas identified by the State. This must include—
i. Existing Demand Industry Sectors and Occupations
Provide an analysis of the industries and occupations for which there is existing demand.
ii. Emerging Demand Industry Sectors and Occupations
Provide an analysis of the industries and occupations for which demand is emerging.
iii. Employers’ Employment Needs
With regard to the industry sectors and occupations identified in (A)(i) and (ii), provide an assessment of the employment needs of employers, including a description of the knowledge, skills, and abilities required, including credentials and licenses.
Current Narrative:
West Virginia’s economy can be divided into 11 major sectors: mining and logging; construction; manufacturing; trade, transportation and utilities; information; financial activities; professional and business services; educational and health services; leisure and hospitality; other services; and total government. Between 2016 and 2026, many of these sectors will see strong employment declines while others will experience moderate growth.
Figure 1: Projected Employment for the Natural Resources and Mining Sector
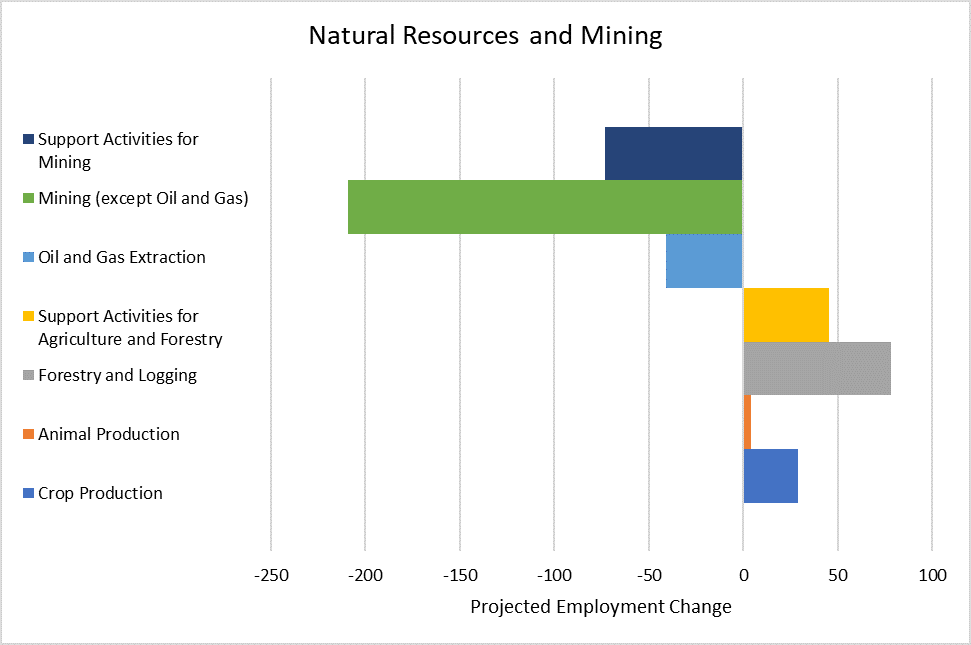
Several industries in the mining and logging sector are forecasting declines, with the most notable employment declines expected in Mining (except oil and gas) and Support Activities for Mining.
Figure 2: Projected Employment for the Construction Sector
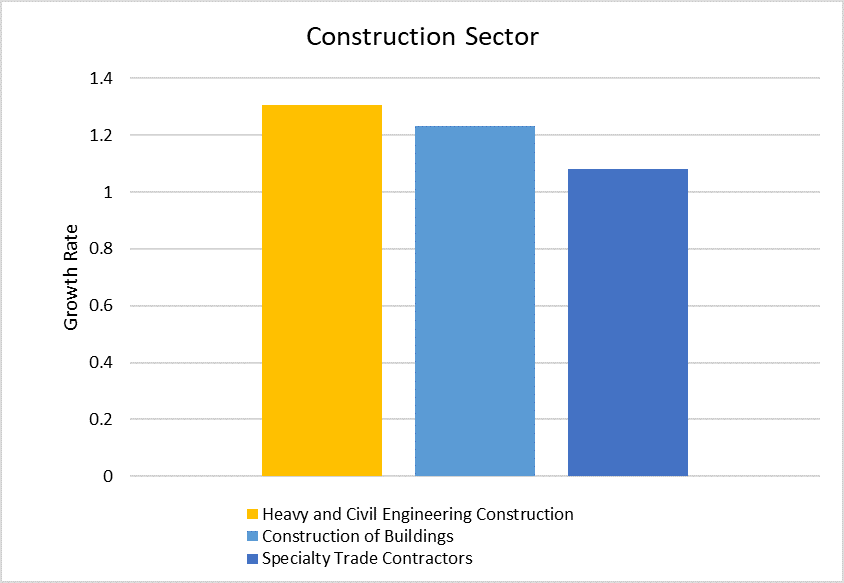
All industries of the construction sector are forecasting growth, the greatest in Heavy and Civil Engineering Construction.
Figure 3: Projected Employment for the Manufacturing Sector
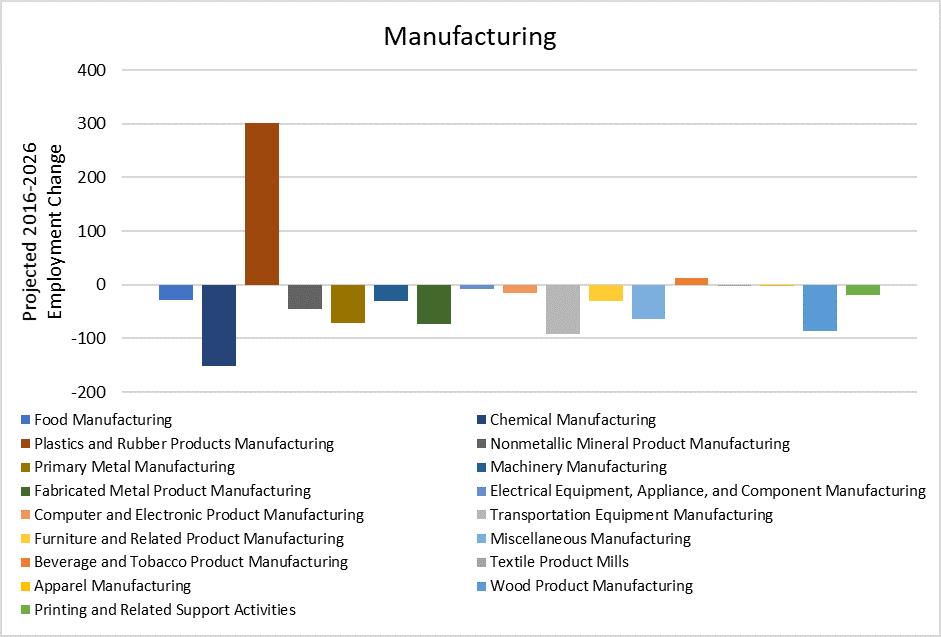
Employment in most manufacturing industries in the state is expected to continue declining through 2026, with the most considerable loss in Chemical Manufacturing. Employment in Plastics and Rubber Products manufacturing is projected to show sizeable growth, with only slight growth in Beverage and Tobacco Product manufacturing through 2026.
Figure 4: Projected Employment for the Trade, Transportation and Utilities Sector
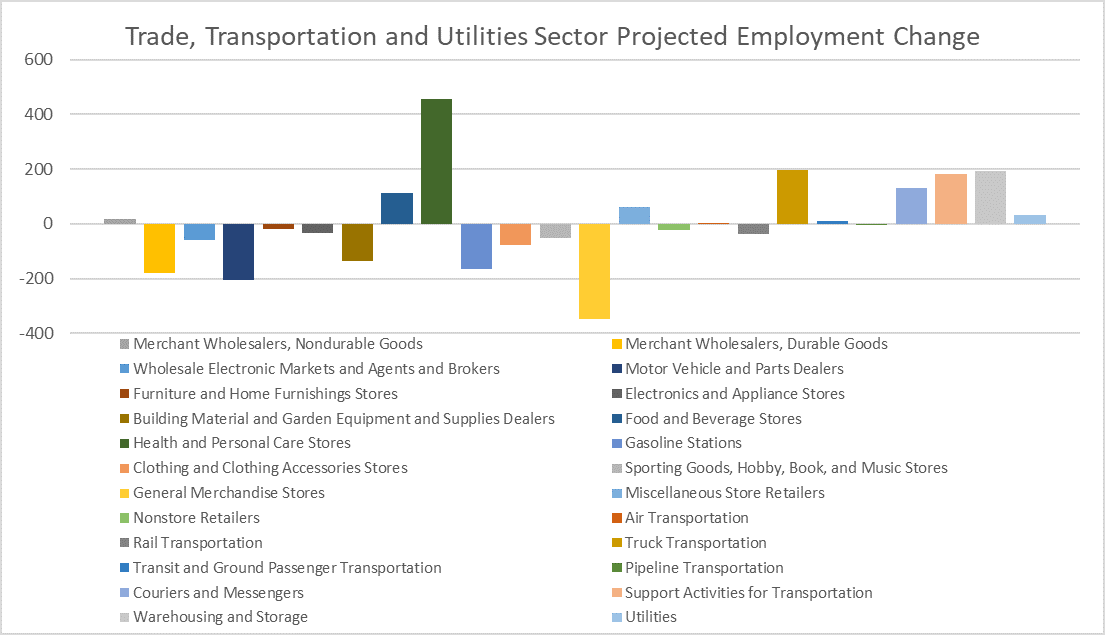
The major sector of trade, transportation and utilities appears a mixed bag of employment growth and decline. The strongest growth is anticipated in Health and Personal Care Stores, with lesser growth in Truck Transportation; Warehousing and Storage; Support Activities for Transportation; and Couriers and Messengers. The most notable employment declines are projected for General Merchandise Stores; Motor Vehicle and Parts Dealers; Merchant Wholesalers, Durable Goods; and Gasoline Stations.
Figure 5: Projected Employment for the Information Sector
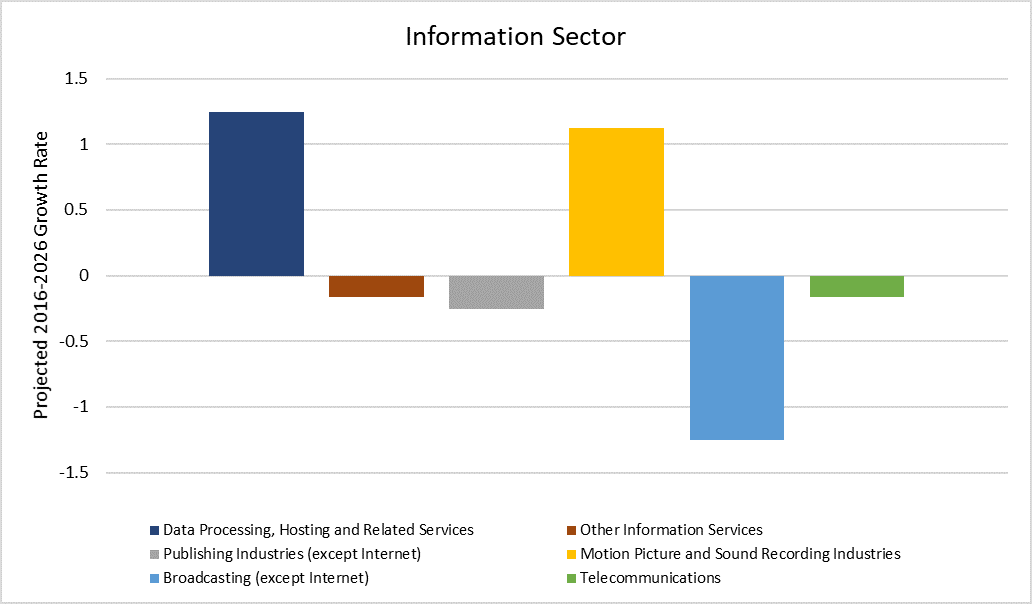
The information sector should see minor employment growth in both Motion Picture and Sound Recording Industries and Data Processing, Hosting, and Related Services. Employment declines are expected in Publishing Industries (except internet), Broadcasting (except internet), Telecommunications, and Other Information Services.
Figure 6: Projected for the Financial Sector
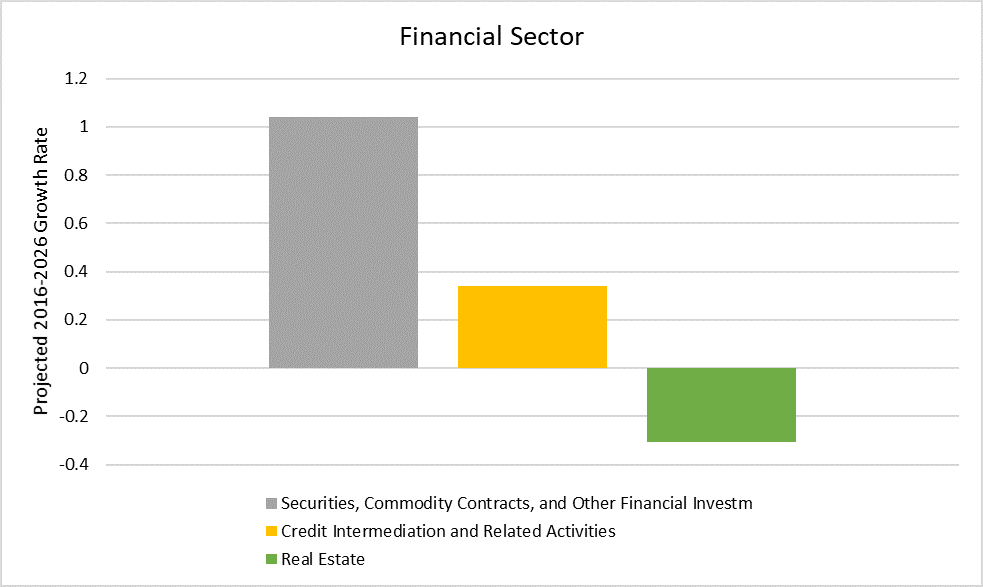
Within the financial services sector, employment growth is projected for Securities, Commodity Contracts, and Other Financial Investment; and Credit Intermediation and Related Activities. Real Estate employment is projected to decline.
Figure 7: Projected Employment for the Professional and Business Sector
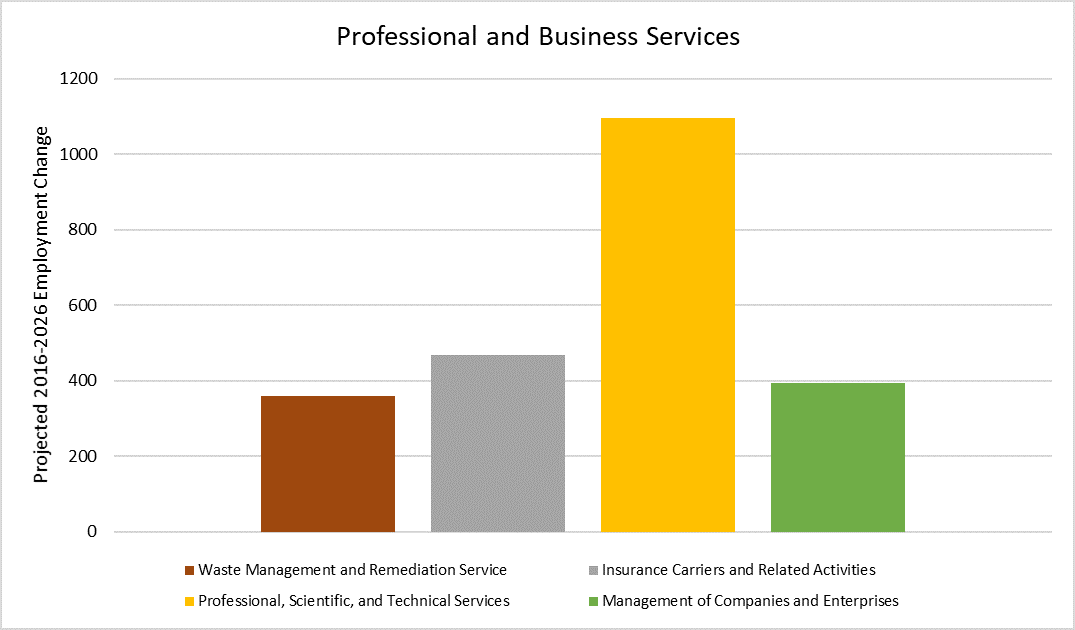
The professional and business services sector should see steady growth through 2026, particularly within Professional, Scientific, and Technical Services.
Figure 8: Projected Employment for the Education and Health Services Sector
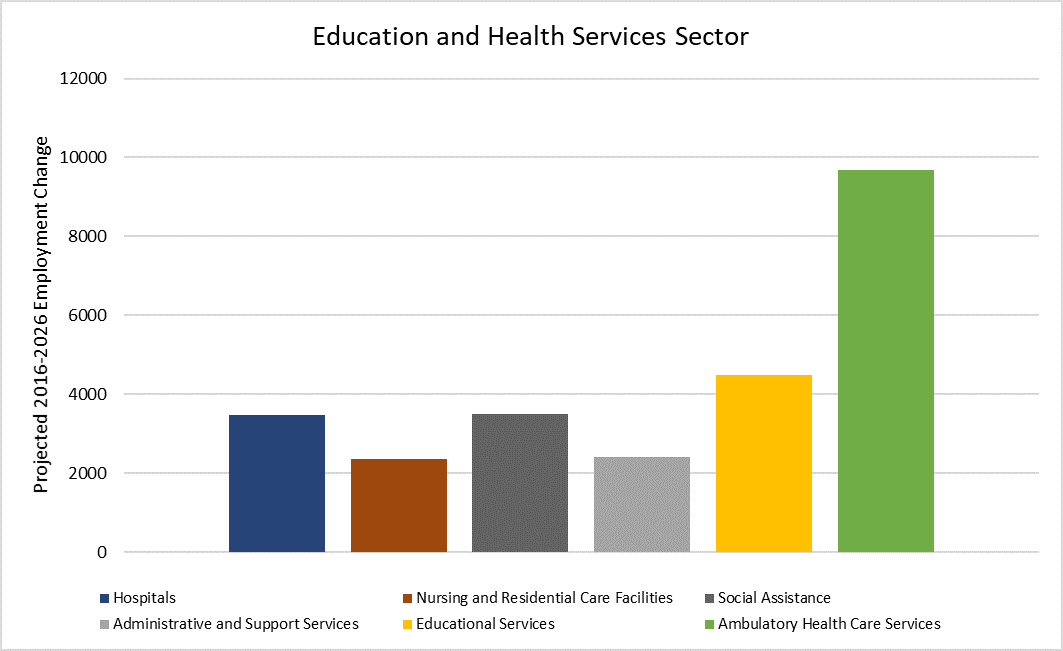
The education and health services sector overall will see growth through 2026, with most employment growth in Ambulatory Health Care Services, followed by Educational Services. West Virginia’s aging population as well as the opioid epidemic solidify the need for additional healthcare workers. Also, college enrollment numbers have increased since the state has legislated free tuition for some post-secondary education.
Figure 9: Projected Employment for the Leisure and Hospitality Sector
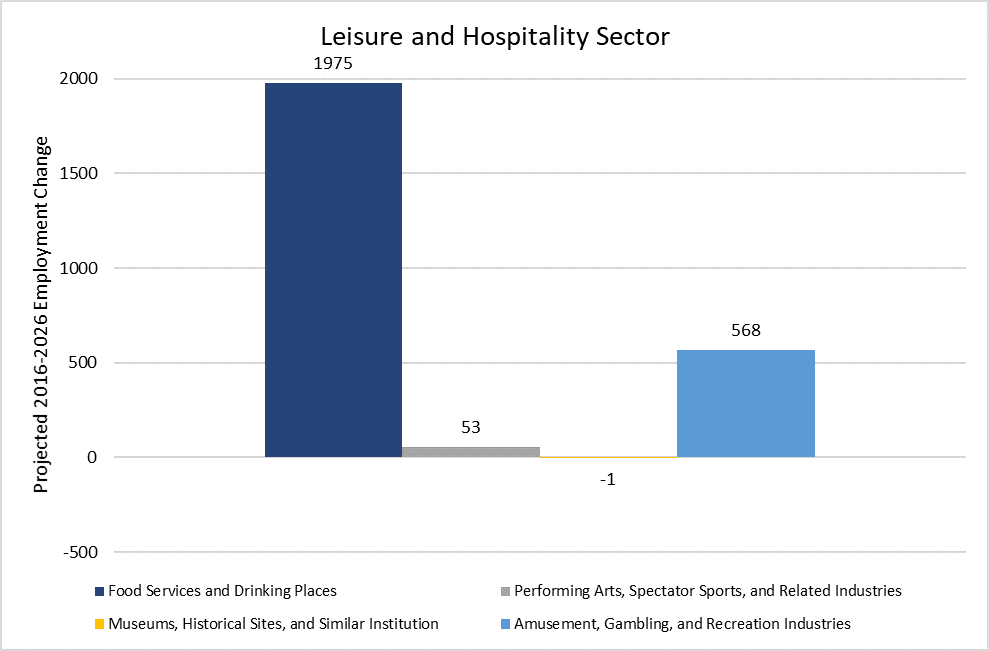
Within the leisure and hospitality sector, the strongest growth is anticipated in Food Services and Drinking Places, with lesser growth in Amusement, Gambling, and Recreation Industries through 2026.
Figure 10: Projected Employment for the Other Services Sector
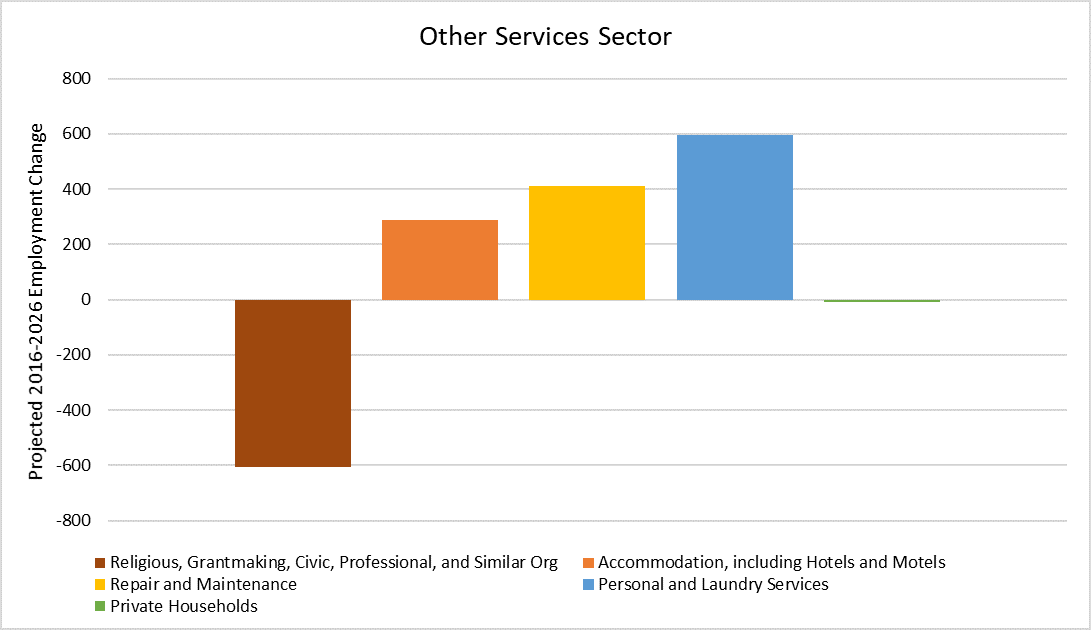
The other services sector should see notable growth in Personal and Laundry Services. Repair and Maintenance, and Accommodation, including Hotels and Motels. Religious, Grantmaking, Civic, Professional and Similar Organizations employment is projected to decline.
Figure 11: Projected Employment for the Government Sector
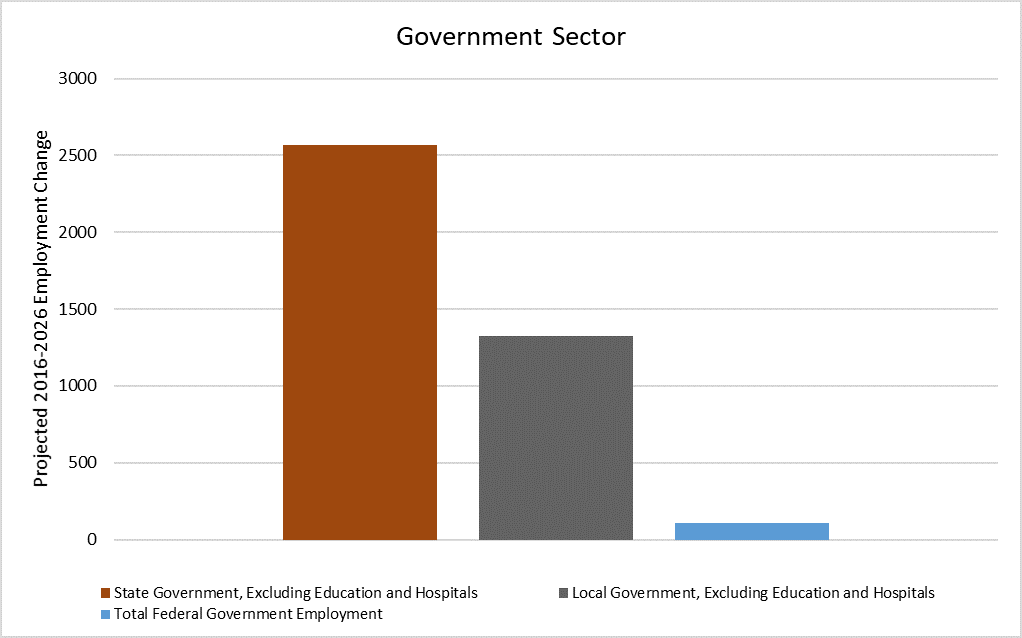
Employment growth is expected in all major sectors of government through 2026, particularly in the State and local sectors.
Figure 12: Map of WIOA Regions in West Virginia

The Division of Research, Information and Analysis of WorkForce West Virginia produces both short-term and long-term occupational and industry projections. Short-term projections are produced annually, and long-term projections are produced biennially.
Figure 13: WIOA Region 1 Industry Projections 2016-2026
(Contains growing and declining industries by Annual Growth Rate.)
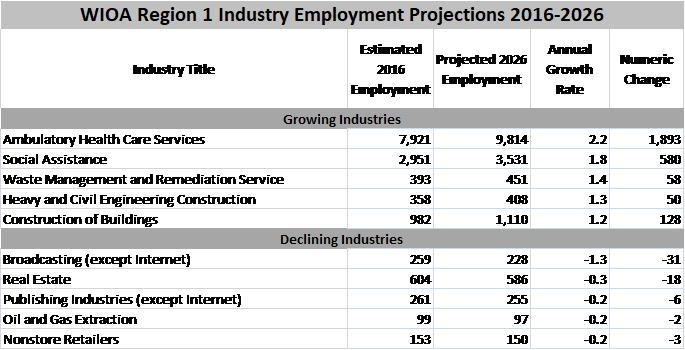
Based on an annual growth rate, four of the top five growing industries in Workforce Innovation and Opportunity Act (WIOA) Region 1 are found within healthcare and construction. The health services sector contains the greatest numeric growth of the industries on the list and includes Ambulatory Healthcare Services, and Social Assistance Other growing industries include Waste Management and Remediation Service, Heavy and Civil Engineering Construction, and Construction of Buildings. The greatest declines in WIOA Region 1 are found in Broadcasting (except Internet), Real Estate, Publishing Industries (except Internet), Oil and Gas Extraction, and Nonstore Retailers.
Figure 14: WIOA Region 2 Industry Projections 2016-2026
(Contains growing and declining industries by Annual Growth Rate.

Based on an annual growth rate, growing Industries in WIOA Region 2 are contained largely within healthcare and construction. The health services sector contains the greatest numeric growth of industries on the list and includes Ambulatory Health Care Services, and Social Assistance. Other growing industries include Waste Management and Remediation Service, Heavy and Civil Engineering Construction, and Construction of Buildings. The greatest declines in the WIOA 2 region are found in Broadcasting (except Internet), Real Estate, Publishing industries (except Internet), Oil and Gas Extraction, and Telecommunications.
Figure 15: WIOA Region 3 Industry Projections 2016-2026
(Contains growing and declining industries by Annual Growth Rate.)
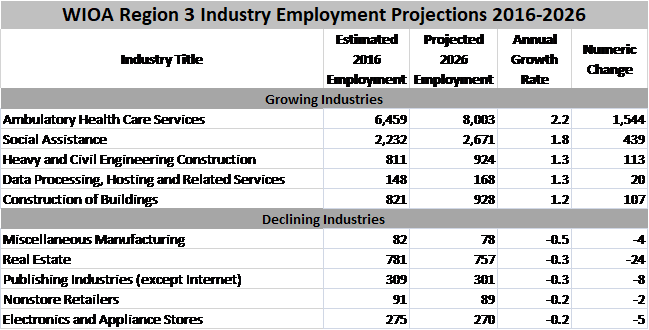
The top five growing Industries in WIOA Region 3 based on an annual growth rate are contained largely in health care and construction. The health care sector contains the greatest numeric growth of industries on the list and includes Ambulatory Health Care Services and Social Assistance. Other growing industries include Heavy and Civil Engineering Construction, Data Processing, Hosting and Related Services, and Construction of Buildings. The greatest declines in the WIOA 3 region are found in Miscellaneous Manufacturing, Real Estate, Publishing Industries (except Internet), Nonstore Retailers, and Electronics and Appliance Stores.
Figure 16: WIOA Region 4 Industry Projections 2016-2026
(Contains growing and declining industries by Annual Growth Rate.)
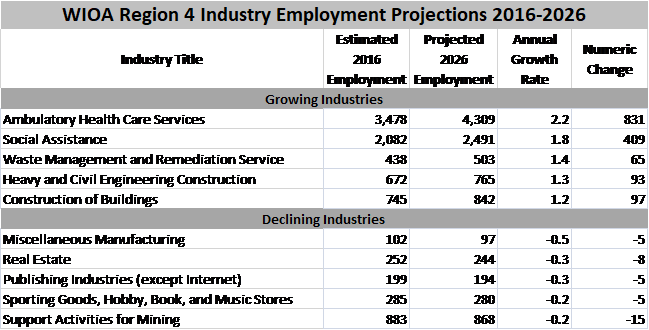
The top five growing Industries in WIOA Region 4 are contained largely within health care and construction. The health care sector contains the greatest numeric growth of industries on the list and includes Ambulatory Health Care Services, and Social Assistance. Other growing industries include Waste Management and Remediation Service, Heavy and Civil Engineering Construction, and Construction of Buildings. The greatest declines in the WIOA 4 region are found in Miscellaneous Manufacturing, Real Estate, Publishing Industries (except Internet), Sporting Goods, Hobby, Book, and Music Stores, and Support Activities for Mining.
Figure 17: WIOA Region 5 Industry Projections 2016-2026
(Contains growing and declining industries by Annual Growth Rate.)
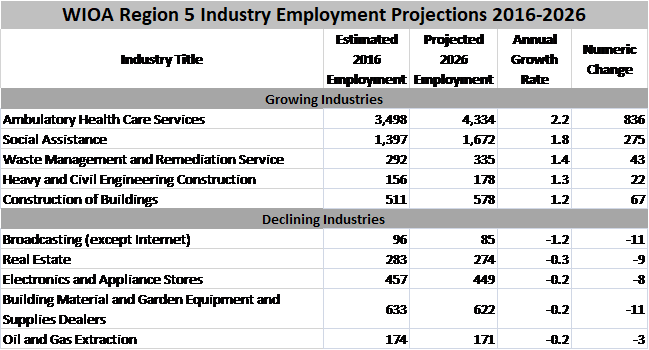
The top five growing Industries in WIOA Region 5 are contained largely within health care and construction. The health care sector contains the greatest numeric growth of industries on the list and includes Ambulatory Health Care Services, and Social Assistance. Other growing industries include Waste Management and Remediation Service, Heavy and Civil Engineering Construction, and Construction of Buildings. The greatest industry declines in the WIOA 5 region include Broadcasting (except Internet), Real Estate, Electronics and Appliance Stores, Building Material and Garden Equipment and Supplies Dealers, and Oil and Gas Extraction.
Figure 18: WIOA Region 6 Industry Projections 2016-2026
(Contains growing and declining industries by Annual Growth Rate.)
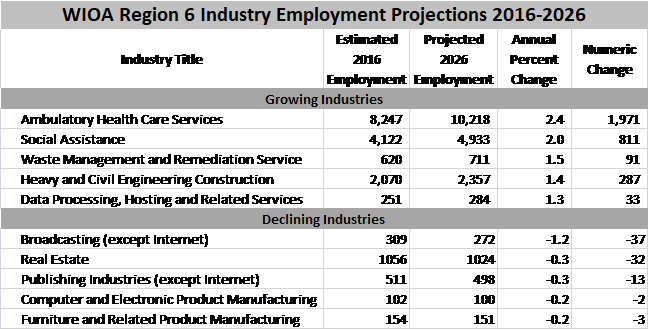
The Industries in WIOA Region 6 projecting the greatest growth are found largely within the Service- Providing Sector. These include Ambulatory Health Care Services, Social Assistance, Waste Management and Remediation Service, Heavy and Civil Engineering Construction, and Data Processing, Hosting and Related Services. Declining industries include Broadcasting (except Internet), Real Estate, Publishing Industries (except Internet), Computer and Electronic Product Manufacturing, and Furniture and Related Product Manufacturing.
Figure 19: WIOA Region 7 Industry Projections 2016-2026
(Contains growing and declining industries by Annual Growth Rate.)
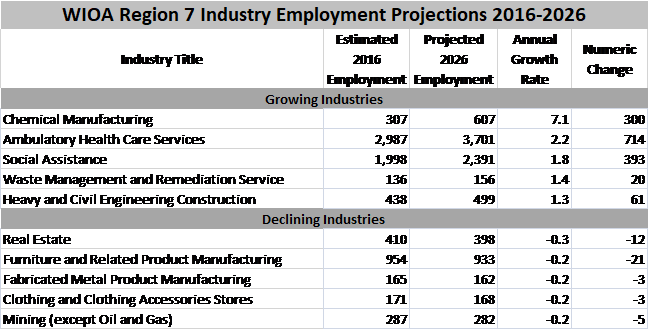
The top five growing industries in WIOA Region 7 are scattered throughout various economic sectors with the greatest increase within the Service-Providing sector. Chemical Manufacturing is projected to have the highest annual growth rate, while the health care sector contains the greatest numeric growth of industries on the list and includes Ambulatory Health Care Services and Social Assistance. Other growing industries include Waste Management and Remediation Service and Heavy and Civil Engineering Construction. The greatest declines in the WIOA 7 region are found in Real Estate, Furniture and Related Product Manufacturing, Fabricated Metal Product Manufacturing, Clothing and Clothing Accessories Stores, and Mining (except Oil and Gas).
Occupational Demand 2018-2020
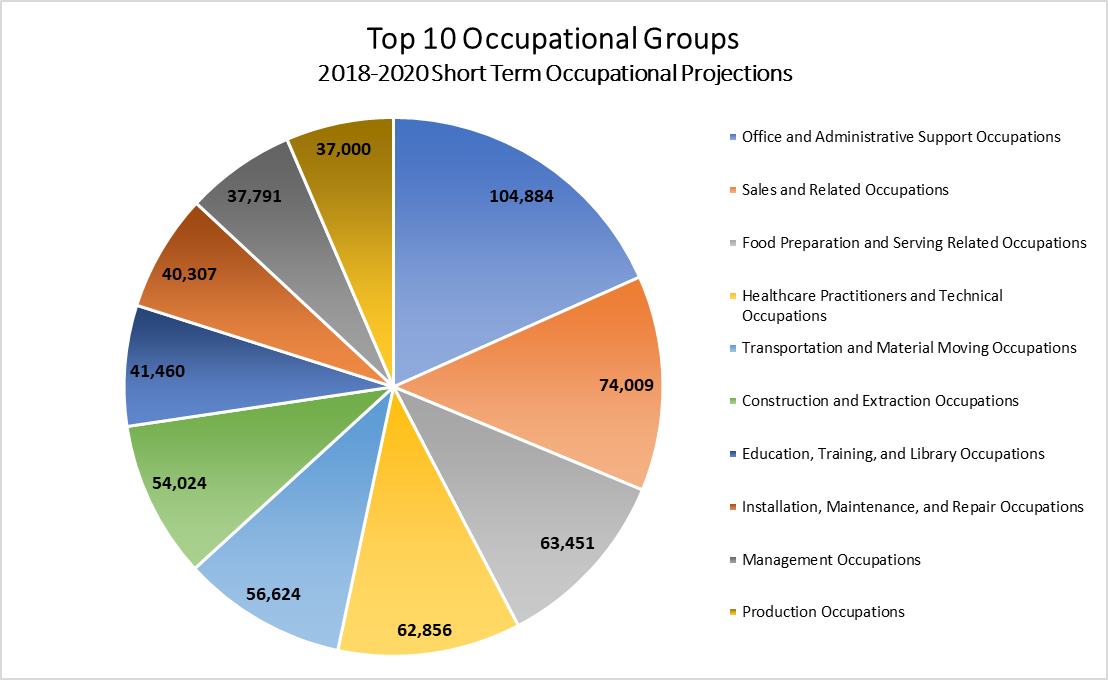
Many outside of our state erroneously believe that most West Virginia workers are employed in the coal-mining industry, but this is hardly the case. Coal mining and other extraction occupations make up only a small part of the entire labor force. As a matter of fact, Construction and Extraction Occupations rank sixth among the top ten employment groups during the 2018-2020 period. Figure 8 shows that the largest employment group is Office and Administrative Support Occupations (104,884). This is followed by Sales and Related Occupations (74,009), Food Preparation and Serving-Related Occupations (63,451), Healthcare Practitioners and Technical Occupations (62,856), and Transportation and Material Moving Occupations (56,624) rounding out the top five.
Figure 20: Pie Chart of Top 10 Occupational Groups 2018-2020
(Pie chart is divided into ten sections and contains employment numbers for these largest occupational groups.)
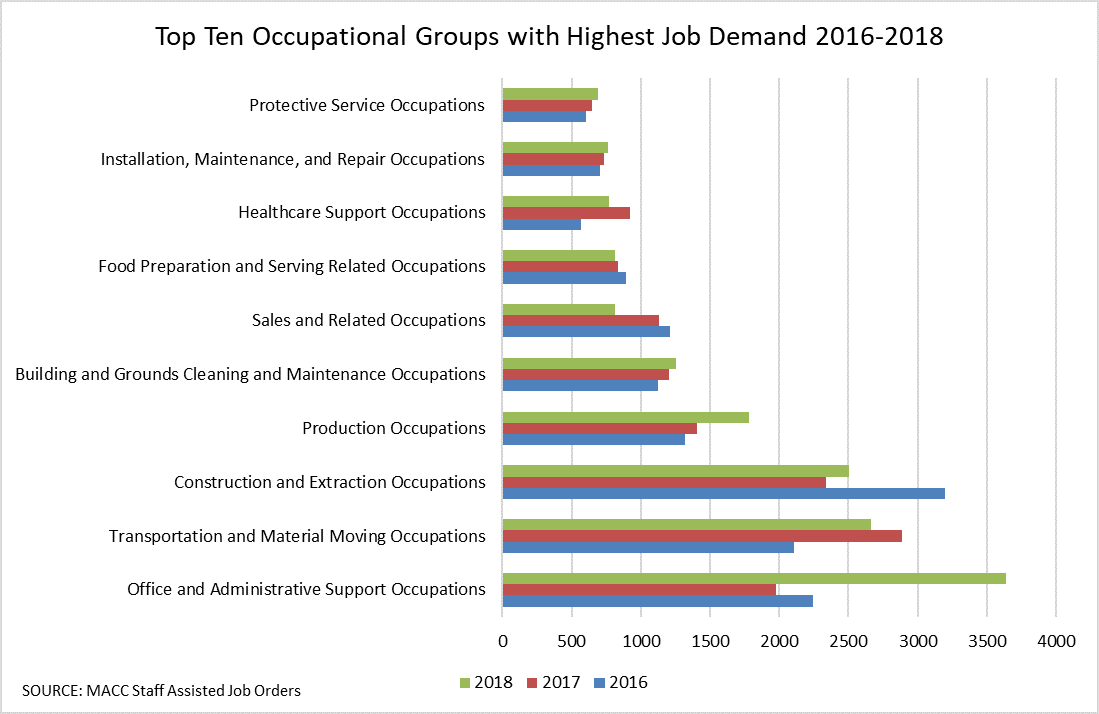
The years 2016 through 2018 have seen high demand for Office and Administrative Support Occupations (Customer Service Representatives, Stock Clerks,), Transportation and Material Moving Occupations (Driver/Sales Worker, Heavy and Tractor-Trailer Truck Drivers), and Construction and Extraction Occupations (Construction Laborers, Extraction Workers). Completing the list of top ten occupations with the highest demand are Production Occupations (Production Workers, Team Assemblers), Building and Grounds Cleaning and Maintenance Occupations (Maids and Housekeeping Cleaners, Landscaping and Groundskeeping Workers), Sales and Related Occupations (Retail Salespersons, Sales Representatives), Food Preparation and Serving-Related Occupations (Combined Food Preparation and Serving-Related Workers, Counter Attendants) , Healthcare Support Occupations (Medical Assistants, Nursing Assistants, Home Health Aides), Installation, Maintenance, and Repair Occupations (Maintenance and Repair Workers, Bus and Truck Mechanics and Diesel Engine Specialists), and Protective Service Occupations (Security Guards, First-Line Supervisors of Correctional Officers).
Figure 21: Occupational Groups with Highest Job Demand 2016-2018
(Bar graph reflecting demand for workers within Occupational Groups for the three-year period of 2016-2017-2018 according to MACC staff assisted job orders.)
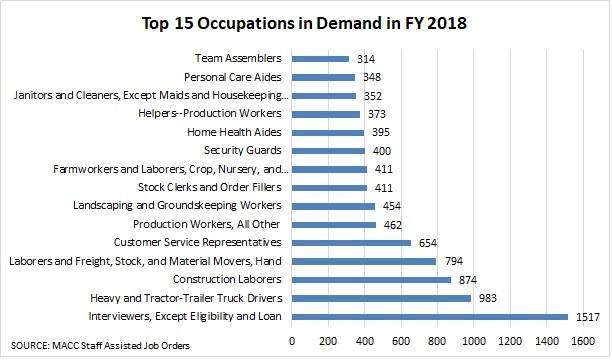
Breaking down the data into greater detail, Interviewers, Except Eligibility and Loan were in greatest demand in Fiscal Year 2018, with 1,517 openings, followed by Heavy and Tractor-Trailer Truck Drivers (983), Construction Laborers (874), Laborers and Freight, Stock, and Material Movers, Hand (794), Customer Service Representatives (654), Production Workers, All Other (462), Landscaping and Groundskeeping Workers (454), Stock Clerks and Order Fillers (411), Farmworkers and Laborers, Crop, Nursery, and Greenhouse (411), and Security Guards (400). Rounding out the top 15 are Home Health Aides (395), Helpers-Production Workers (373), Janitors and Cleaners, Except Maids and Housekeeping (352), Personal Care Aides (348), and Team Assemblers (314).
Figure 22: Top 15 Demand Occupations in 2018
(Bar graph reflects the top 15 occupations requested by employers through WorkForce West Virginia in 2018.)
The top job openings by occupational group reported by WorkForce West Virginia in 2018 included Office and Administrative Support Occupations, Transportation and Material Moving Occupations, Construction and Extraction Occupations, Production Occupations, and Building and Grounds Cleaning and Maintenance Occupations. West Virginia employers were seeking workers to fill such positions as Customer Service Representatives, Stock Clerks, Tellers, Medical Secretaries, Drivers/Sales Workers, Heavy and Tractor-Trailer Truck Drivers, Construction Laborers, Team Assemblers, Maids and Housekeeping Cleaners, Landscaping and Groundskeeping Workers, and Janitors and Cleaners.
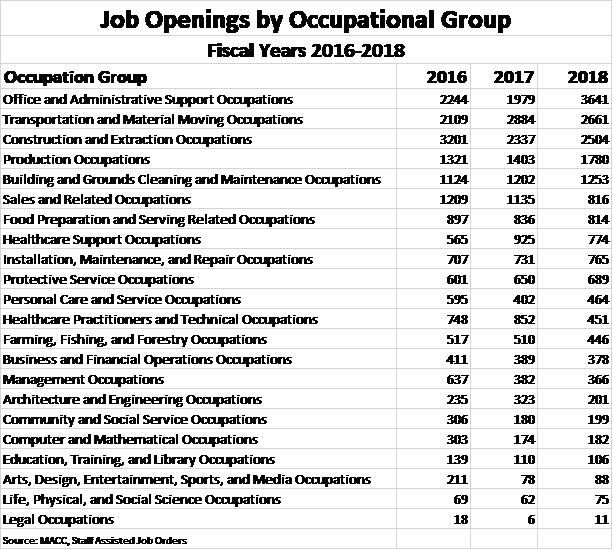
Figure 23: Job Openings by Occupation Group 2016-2018
(Table shows 22 Occupational Groups and the number of job openings within these groups for the years 2016-2017-2018.)
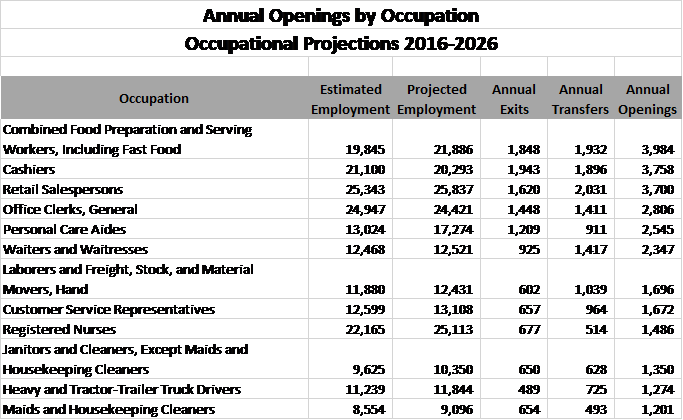
The top five occupations with the largest annual openings through 2026 include Combined Food Preparation and Serving Workers, including Fast Food; Cashiers; Retail Salespersons; Office Clerks, General, and Personal Care Aides.
Figure 24: Annual Openings by Occupation 2016-2026
Table displays occupations with a high number of Total Annual Openings between 2016 and 2026. Includes Estimated and Projected Employment.)
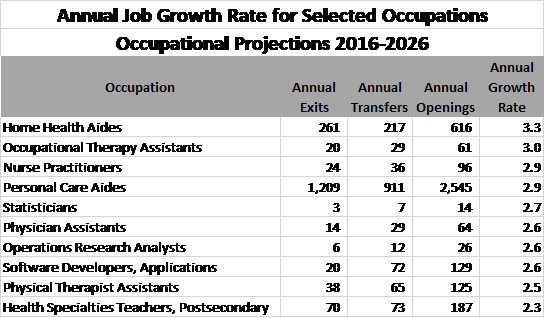
Nearly all of the top ten occupations (figure 13) ranked by annual growth rate are contained within three occupational clusters: Healthcare Support Occupations, Healthcare Practitioners and Technical Occupations, and Computer and Mathematical Occupations. These clusters include such occupations as Home Health Aides, Occupational Therapy Assistants, Nurse Practitioners, Personal Care Aides, Statisticians; Physician Assistants, and Operations Research Analysts.
Figure 25: Annual Job Growth Rate for Select Occupations 2016-2026
(Table contains top ten occupations by Annual Growth rate for the years 2016-2026.)
In general, employers assess employees based on three categories: Knowledge, Skills, and Abilities.
With fast growing technology and globalized trends dominating the workplace, knowledge is imperative. According to the late management guru Peter Drucker, “Today, knowledge has power. It controls access to opportunity and advancement.” It is always a basic need for everyone. If someone has a better knowledge base, he or she will acquire confidence and work more effectively. That’s why employers prefer their employees to be knowledgeable in order to perform a job properly.
Employers are also willing to send employees to advanced training classes, because “An investment in knowledge always pays the best interest” (Benjamin Franklin).
Figure 26: Model Knowledge, Skills, & Ability for Registered Nurse
(Figure 26 shows the top Knowledge, Skills, and Abilities needed for Registered Nurses.)
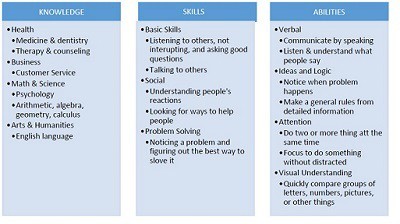
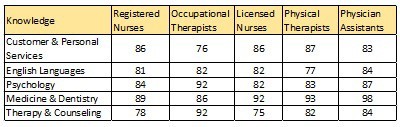
With the intensive growth of Healthcare and Social Assistance industries through 2022, the need for education and higher—skill workers is anticipated. Figure 26 shows, that for a nurse, therapist, or physician assistant, knowledge of medicine is a must (ranks 86 to 98 out of 100). Fluent English is necessary to understand medical terminology and communicate with patients and medical staff.
Customer and Personal Services knowledge is also important for Registered Nurses and Licensed practical nurse (86 of 100) and Physical Therapists (87 of 100) because of the close relationships formed between nurse and patient.
Figure 27: Knowledge Assessment for Top 5 Healthcare Occupations
(Figure 27 assesses the knowledge needed for the top five healthcare occupations.)
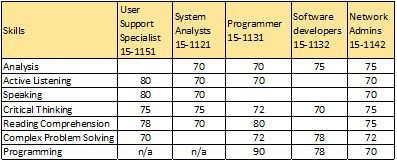
Similarly, figure 28 shows that Critical Thinking, Problem Solving, and Programming Skills are essential for people working in the computer science field (rank from 70—90 of 100). However, several skills in certain jobs are not evaluated depending on the field and skill value. Table 3 shows only the most required skills that rank from 70 to 100. The higher ranking, the more important the skill.
Figure 28: Skill Assessment for Top 5 Computer Occupations
(Figure 28 provides skills assessment for the top five computer-related occupations.)
Numerous occupations in West Virginia require licensing. This is to ensure the competency of those practicing these professions, and in many cases the safety of those utilizing their services. There are approximately 110 occupations that require licensure in the State of West Virginia, eleven of which are in-demand occupations. The majority of these In-demand occupations are found in the healthcare field, such as Physician Assistant, Registered Nurse, Licensed Practical Nurse, Pharmacist, Physical Therapy Assistant, Radiologic Technologist, and Dental Hygienist. The remaining in-demand occupations that require licensing include Accountant, Attorney, Elementary School Teacher, and Social Worker.