Located in:
- II. Strategic Elements
The Unified or Combined State Plan must include a Strategic Planning Elements section that analyzes the State’s current economic environment and identifies the State’s overall vision for its workforce development system. The required elements in this section allow the State to develop data-driven goals for preparing an educated and skilled workforce and to identify successful strategies for aligning workforce development programs to support economic growth. Unless otherwise noted, all Strategic Planning Elements apply to Combined State Plan partner programs included in the plan as well as to core programs.
- a. Economic, Workforce, and Workforce Development Activities Analysis
The Unified or Combined State Plan must include an analysis of the economic conditions, economic development strategies, and labor market in which the State’s workforce system and programs will operate.
- a. Economic, Workforce, and Workforce Development Activities Analysis
II. a. 1. B. Workforce Analysis
The Unified or Combined State Plan must include an analysis of the current workforce, including individuals with barriers to employment, as defined in section 3 of WIOA4. This population must include individuals with disabilities among other groups5 in the State and across regions identified by the State. This includes—
[4] Individuals with barriers to employment include displaced homemakers; low-income individuals; Indians, Alaska Natives, and Native Hawaiians; individuals with disabilities, including youth who are individuals with disabilities; older individuals; ex-offenders; homeless individuals, or homeless children and youths; youth who are in or have aged out of the foster care system; individuals who are English language learners, individuals who have low levels of literacy, and individuals facing substantial cultural barriers; farmworkers (as defined at section 167(i) of WIOA and Training and Employment Guidance Letter No. 35-14); individuals within 2 years of exhausting lifetime eligibility under the Temporary Assistance for Needy Families program; single parents (including single pregnant women); and long-term unemployed individuals.
[5] Veterans, unemployed workers, and youth, and others that the State may identify.
i. Employment and Unemployment
Provide an analysis of current employment and unemployment data, including labor force participation rates, and trends in the State.
ii. Labor Market Trends
Provide an analysis of key labor market trends, including across existing industries and occupations.
iii. Education and Skill Levels of the Workforce
Provide an analysis of the educational and skill levels of the workforce.
iv. Skill Gaps
Describe apparent ‘skill gaps’.
Current Narrative:
Employment and Unemployment
Labor Market Trends. Provide an analysis of key labor market trends, including across existing industries and occupations.
Demographics of the State’s Economy
Age
Figure 29: Population by Age Group
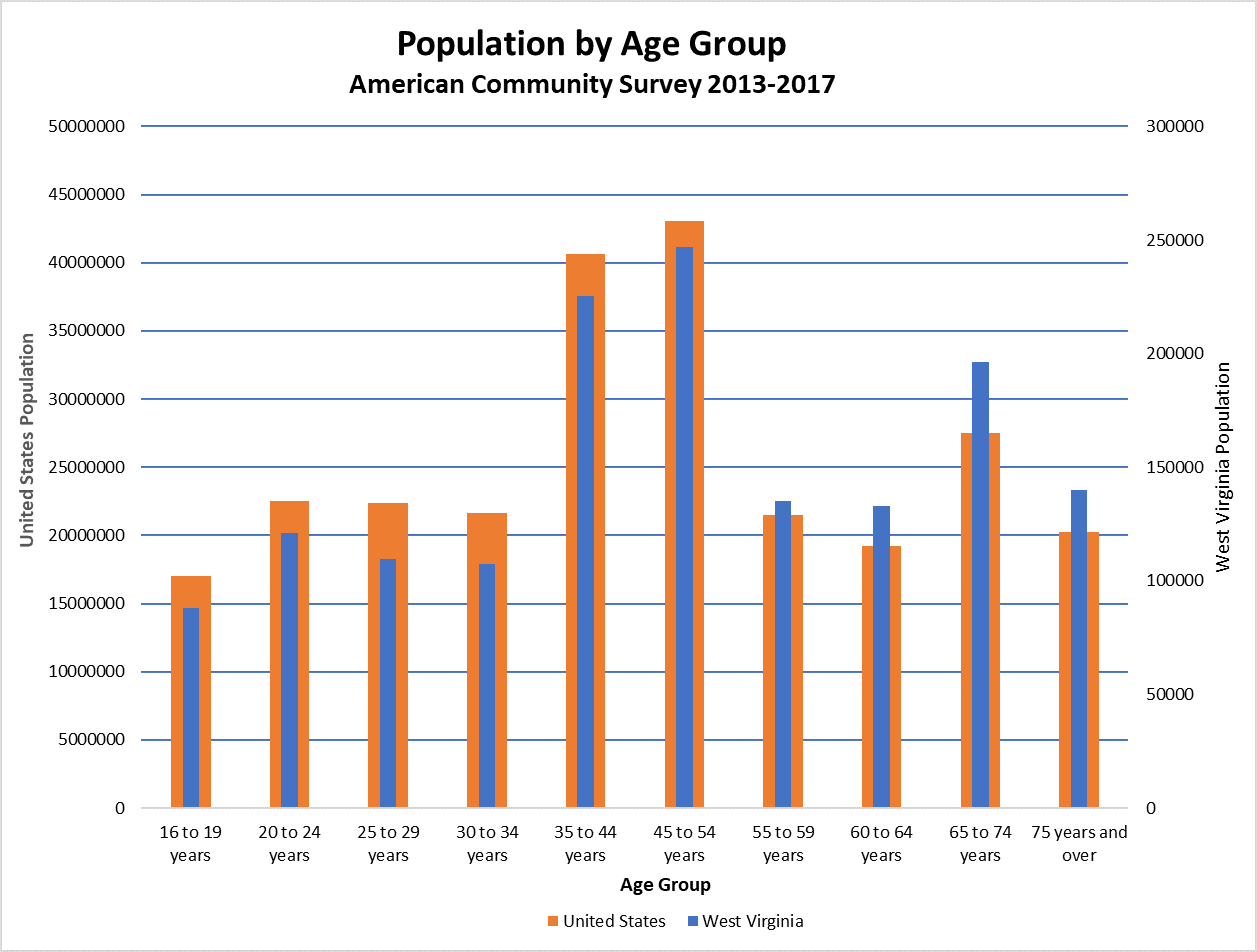
The U.S. Census Bureau’s 2017 5-year estimates American Community Survey lists West Virginia’s population 16 years of age and older at 1,503,051. Approximately 53.6 percent of this total is in the labor force. The employment to population ratio is 49.7 percent, while the unemployment rate for this population is 7.2 percent.
Figure 30:Labor Force Participation by Age Group
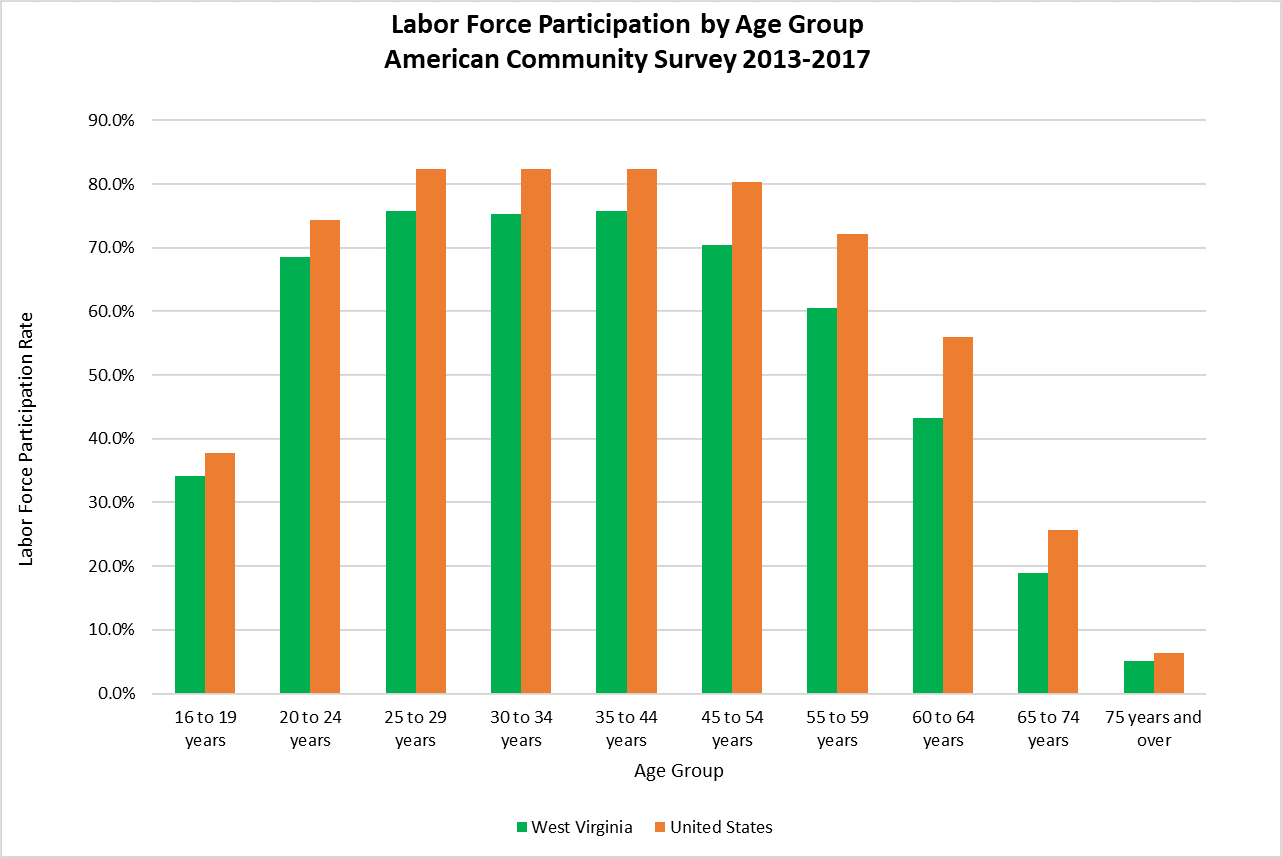
West Virginians aged 16 to 19 are estimated to number 88,215, 34.2 percent in the labor force. The employment to population ratio for this group is 26.3 percent, and the unemployment rate is 23.0 percent, the highest unemployment rate among all age groups. Many teenagers have difficulty finding or keeping employment because of lack of work experience, and because some employers are unwilling to hire teens due to labor laws and the inconvenience of scheduling around school functions and extracurricular activities. According to WorkForce West Virginia, in 2016, the number of unemployed in this age group who exhausted their benefits was 31.This number fell to 18 in 2017.
The group containing those 20 to 24 years of age is estimated at 121,171. Of these, 68.5 percent are in the labor force. The employment to population ratio for this group is 59.3 percent, while the unemployment rate is 13.4 percent. In 2016, 937 unemployed in this age group exhausted their unemployment benefits. In 2017, the number fell to 508.
The group containing residents 25 to 29 years old is estimated at 109,573. The labor force participation rate is 75.7 percent, tied with the 35 to 44 years age group for the highest among the established age groups. The employment to population ratio is 67.8 percent, while the unemployment rate for this group is 10.2 percent. In 2016, the number of unemployed in this age group who exhausted their benefits was 1,690. This number fell to 991 in 2017.
West Virginians aged 30 to 34 years are estimated at 107,256. The labor force participation rate is 75.3 percent, and the employment to population ratio is 69.3 percent. The unemployment rate is 7.6 percent. The number of unemployed in this age group who exhausted their benefits in 2016 was 1,791. This number fell to 1,141 in 2017.
The age group of those 35 to 44 years old contained 225,425 residents. The labor force participation rate is 75.7 percent. The employment to population ratio is 71.0 percent, the highest among the established age groups. The unemployment rate is 6.1 percent. The number of unemployed in this age group who exhausted their benefits in 2016 was 3,844. This number declined to 2,497 in 2017 but remained the highest among all age groups.
The group containing those ages 45 to 54 years is estimated at 247,043. The labor force participation rate is 70.5 percent, and the employment to population ratio is 67.1 percent. The unemployment rate for this age group is 4.7 percent. The number of unemployed in this age group who exhausted their benefits in 2016 was 3,617. This number fell to 2,479 in 2017.
The group containing residents ages 55 to 59 is estimated at 135,068. The labor force participation rate is 60.6 percent and the employment to population ratio is 58.3 percent. The unemployment rate is 3.8 percent. The number of unemployed in this age bracket who exhausted their benefits in 2016 was 1,677. This number fell to 1,169 in 2017.
West Virginians aged 60 to 64 years numbered 132,974, with a labor force participation rate of 43.3 percent. The employment to population ration is 41.8 percent, with an unemployment rate of 3.5 percent. The number of unemployed in this age group who exhausted their benefits in 2016 was 1,260. This number fell to 871 in 2017.
The group containing those ages 65 to 74 years of age is estimated at 196,401, with a labor force participation rate of 19.0 percent. The employment to population ratio is 18.4 percent, and the unemployment rate is 3.1 percent, the lowest among all the age groups. The number of unemployed in this age group who exhausted their benefits in 2016 was 692. This number fell to 545 in 2017.
The number of West Virginia residents ages 75 and over is estimated at 139,925. The labor force participation rate is 5.1 percent, and the employment to population ratio is 4.9 percent. The unemployment rate is 3.2 percent. The number of unemployed in this age group who exhausted their benefits in 2016 was 83. This number rose to 93 in 2017, the only age group to see an increase.
West Virginia’s Net Migration
Figure 31: West Virginia's Net Migration 2010-2018
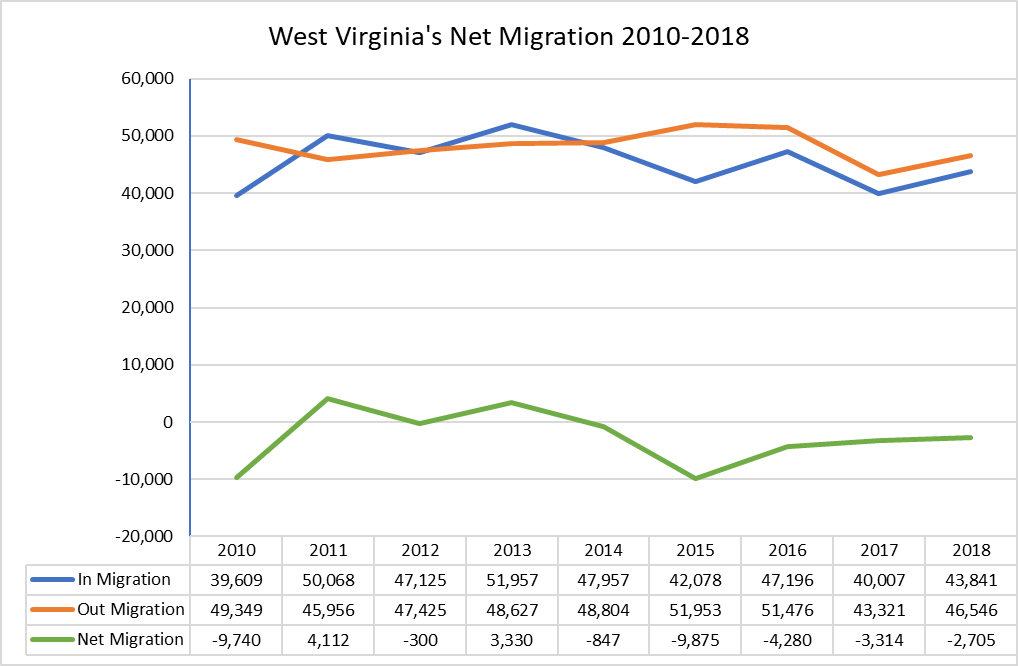
Between 2010 and 2018, West Virginia experienced an increase of 4,232 in in migration and a decline of 2,803 in out migration. Despite this positive statistic, in 2018, out migration (46,456) was still greater than in migration (43,841)., with a difference of 2,705., thus contributing to the state’s overall population decline.
Figure 32: West Virginia's Population Migration by Age
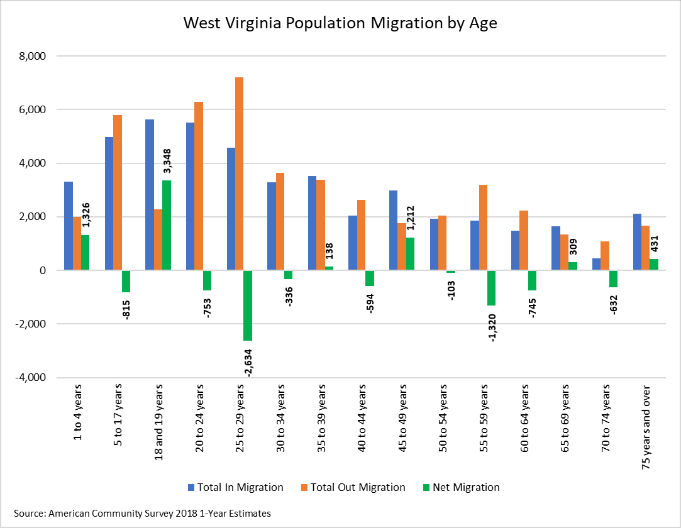
The age group of 25 to 29 year olds experienced the greatest out migration. It appears that many West Virginia residents leave the state to seek employment after completing their education.
Disability
According to the U.S. Census Bureau’s 2017 American Community Survey, West Virginia’s total civilian noninstitutionalized population 16 years of age and older is estimated at 1,474,814, with 337,478 having a disability and 1,137,336 having no disability. Of this total noninstitutionalized population, 50.6 percent are employed. The percentage of those with some form of disability who are employed is 17.9 percent. The percentage of those with no disability who are employed is estimated to be 60.4 percent.
The percent of the total civilian noninstitutionalized population not in the labor force is estimated at 45.4 percent. The percentage of those with some form of disability who are not in the labor force is 79.5 percent. The employed population age 16 and over is estimated to be 746,956. Of this number, 60,280 are estimated to have a disability, while 686,676 are estimated as having no disability.
The total number of West Virginians age 25 and older is 1,267,870, with 321,147 having a disability and 946,723 having no disability. The number of West Virginians age 25 and older holding less than a high school diploma or its equivalent is approximately 13.8 percent. The percentage of West Virginians with a disability who did not graduate from high school is estimated at 26.2 percent.
Figure 33: West Virginia Education Attainment by Disability
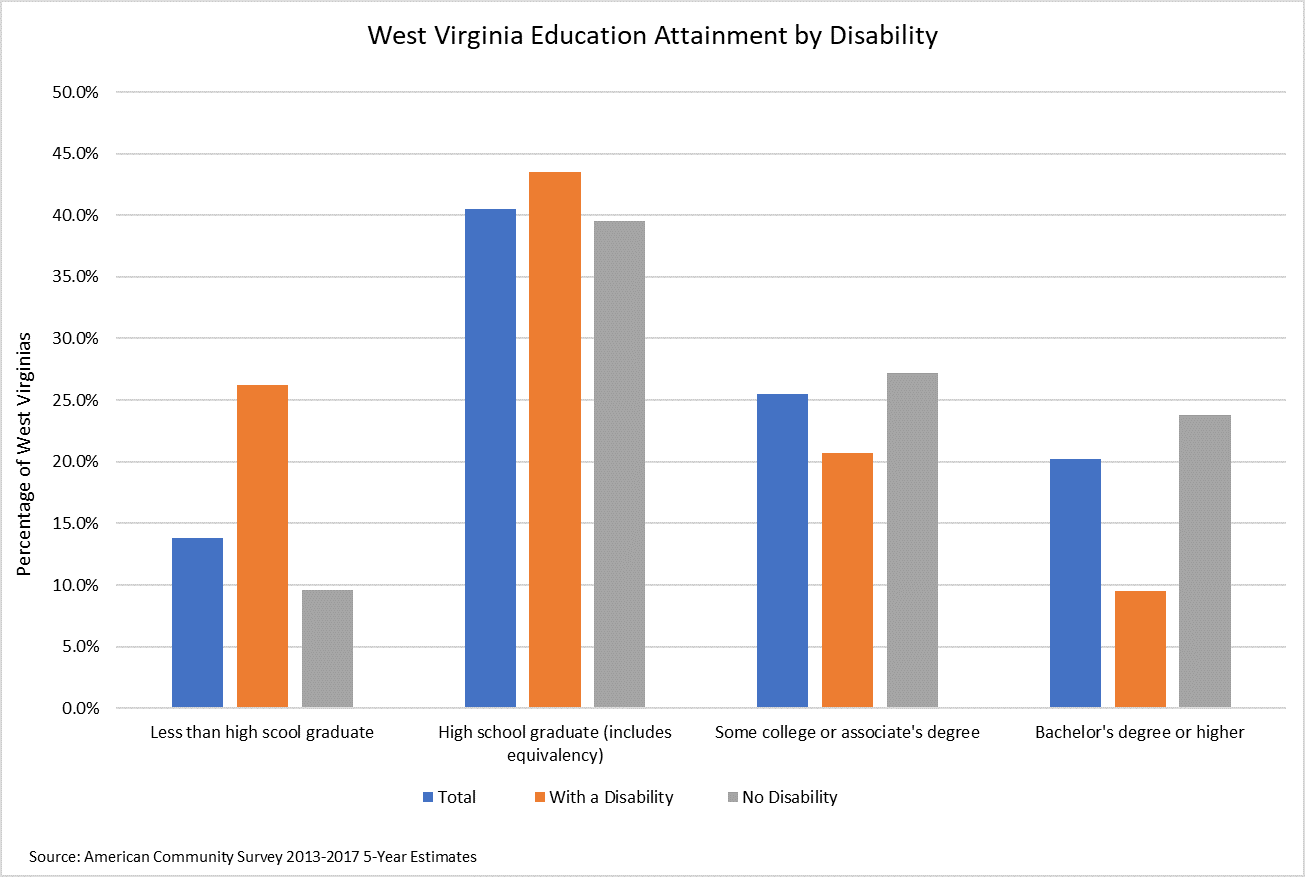
Those state residents age 25 and older with a high school diploma, GED, or alternative are estimated at 40.5 percent. An estimated 43.5 percent of residents with a disability are contained in this group. The percent of the population age 25 and over with some college or an associate’s degree is approximately 25.5 percent. An estimated 20.7 percent of residents with some college or an associate’s degree also has a disability. The portion of the population age 25 and older who hold a Bachelor’s degree or higher is 20.2 percent. An estimated 9.5 percent of West Virginians with a disability are contained within this group.
Figure 34: Poverty Level of West Virginians with a Disability
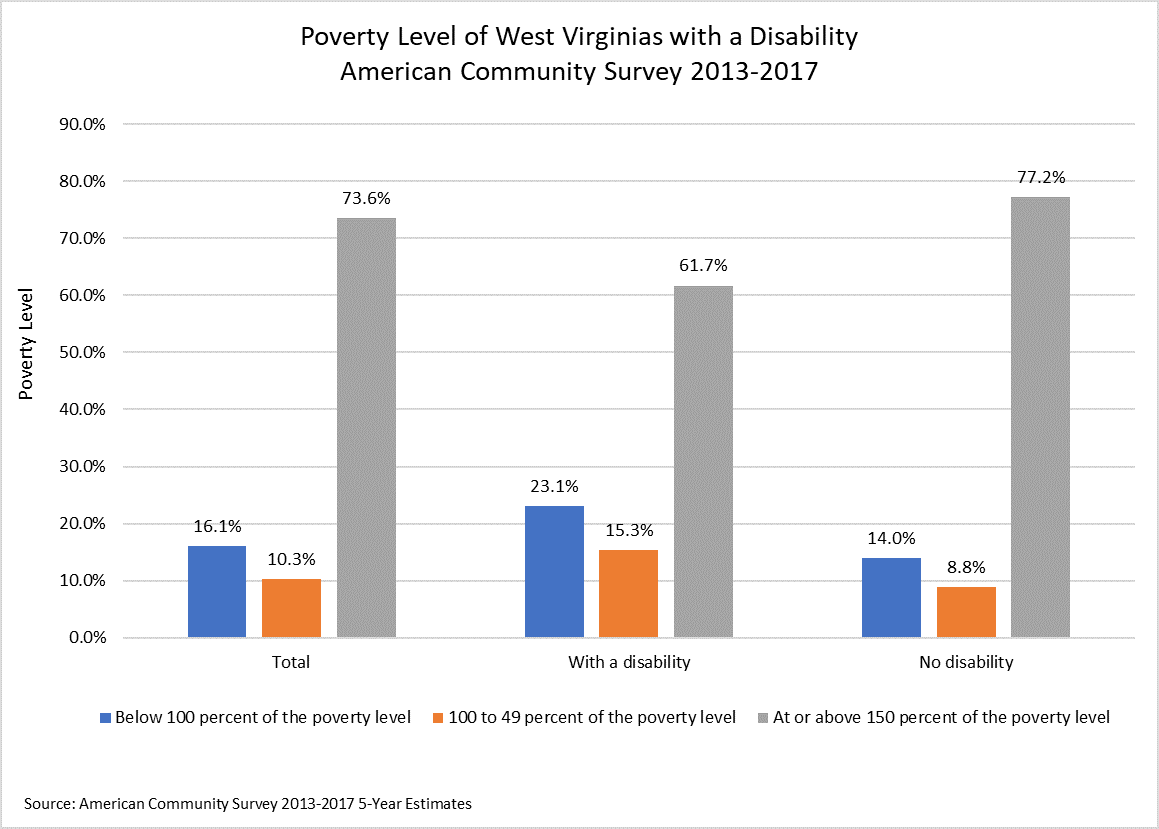
The West Virginia population age 16 and over for whom the poverty status is determined during the 2017 survey is estimated to be 1,458,229, with 336,541 estimated to have a disability and 1,121,688 having no disability. Approximately 16.1 percent of this total civilian noninstitutionalized population is below 100 percent of the poverty level. An estimated 23.1 percent in this group report a disability. Those West Virginians at 100 to 149 percent of the poverty level registered at 10.3 percent. An estimated 15.3 percent within this group report a disability. Persons at or above 150 percent of the poverty level are estimated at 73.6 percent. An estimated 61.7 percent of persons reporting a disability are contained within this category.
In 2016, the number of unemployed with a disability who exhausted their unemployment benefits was 135. In 2017, this number fell slightly to 124. Among this number, 39 individuals aged 25 to 44, and 74 individuals aged 45 to 64 exhausted their unemployment benefits in 2017.
Sex and Race
Figure 35: West Virginia Population by Sex and Race
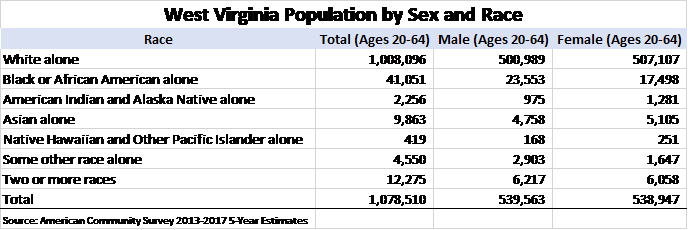
West Virginia’s population 20 to 64 years of age is approximately 1,078,510, with an estimated 67.8 percent in the labor force. The employment to population ratio for this group is 63.1 percent. The estimated unemployment rate for those aged 20 through 64 is 6.8 percent.
The population age 20 to 64 years broken out by sex is 539,563 males and 538,947 females. It is estimated that 72.6 percent of males are in the labor force, while 62.9 percent of females are in the labor force. The employment to population ratio for males aged 20 through 64 is 66.9 percent and 59.3 percent for females. The estimated unemployment rate for males is 7.6 percent and 5.8 percent for females. In 2016, 11,631 males exhausted their unemployment benefits. The number plunged to 6,516 in 2017. The number of females who exhausted their unemployment benefits in 2016 was 3,991. That number fell slightly to 3,796 in 2017.
West Virginia’s population 16 years and older broken out by race and Hispanic or Latino origin stood at 1,503,051 during the 2013-2017 estimate period. Of this total, 1,411,977 are White alone, 53,229 are Black or African American alone, 2,895 are American Indian and Alaskan native alone, 11,881 are Asian alone, 458 are Native Hawaiian and other Pacific Islander alone, 5,368 are Some other race alone, and 17,243 are Two or more races. The total of Hispanic or Latino origin of any race stood at 19,349, and White alone, not Hispanic or Latino stood at 1,398,029.
In 2016, the number of unemployed who exhausted their unemployment benefits was as follows: White 14,411, Black 524, Asian 59, American Indian/Alaskan Native 53, Pacific Islander 10, and Hispanic 273. In 2017, these numbers were as follows: White 9,373, Black 482, Asian 40, American Indian/Alaskan Native 32, Pacific Islander 5, and Hispanic 153.
Race and the Labor Force
The estimated racial breakout of the West Virginia labor force is as follows: 53.6 % of the White alone population is in the labor force and 49.8 % is employed. 53.0% of the Black or African American alone population is in the labor force, and 46.9 % is employed. 65.5% of the Asian alone population is in the labor force, and 62.4% is employed. 36.9% of the American Indian and Alaska Native alone population is in the labor force, and 34.1% is employed. 65.1% of the Native Hawaiian and Other Pacific Islander alone population is in the labor force and 51.3% is employed. 59.3% of Hispanic or Latino origin (of any race) is in the labor force, and 54.8% is employed. 56.4% of some other race alone population is in the labor force, and 51.4% is employed. 49.2% of two or more races population is in the labor force and 42.7% is employed.
Education and the Labor Force
Figure 36: Population and Labor Force Participation Rate by Educational Attainment
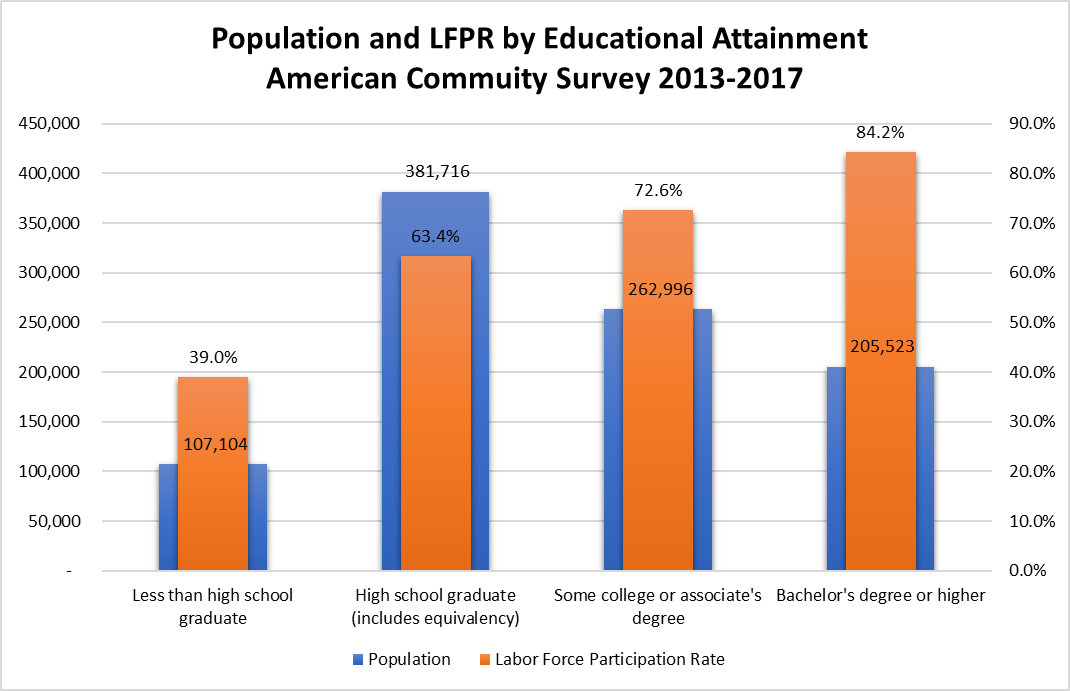
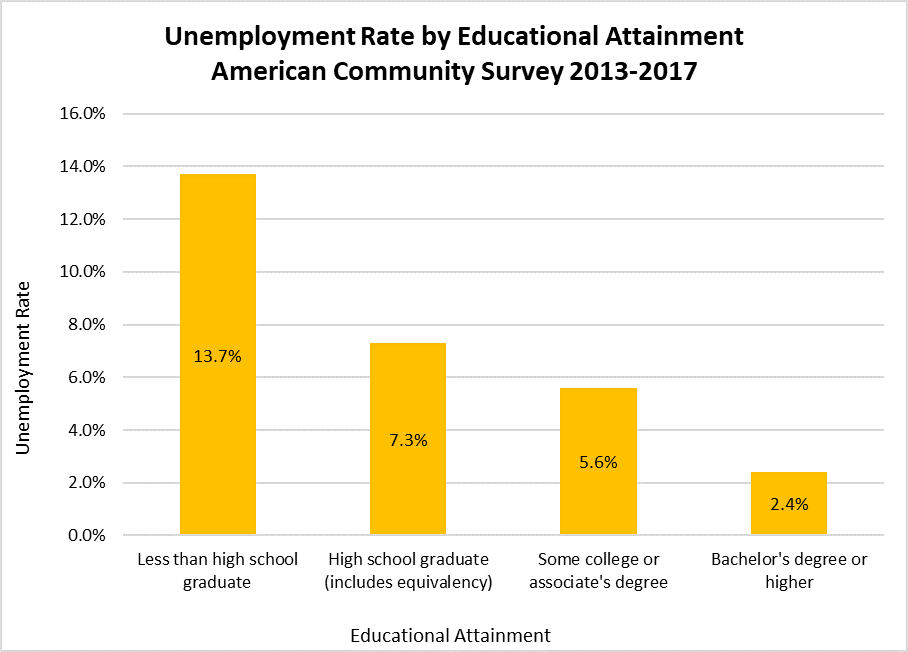
Figure 37: Unemployment Rate by Educational Attainment
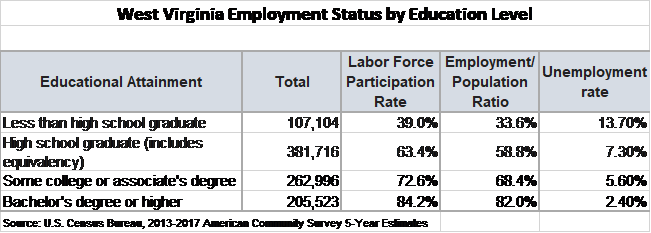
According to the American Community Survey 5-Year Estimates (2013-2017), the total number of West Virginians ages 25-64 is 957,339. The estimated number who did not graduate from high school is 107,104 (11.2%) with 39.0% in the labor force, and 33.6% employed. This group exhibits the lowest amount of employment among the categories of educational attainment.
Those with a high school or equivalent education number 381,716, with 63.4% in the labor force and 58.8% employed. Those with some college or an associate degree number 262,996, with 72.6% in the labor force and 68.4% employed. 205,523 have a Bachelor’s Degree or higher with 84.2% in the labor force and 82.0% employed. The unemployment rate runs from 2.4% for those who have a Bachelor’s degree to 13.7% for those who have less than a high school diploma.
Population Forecast
West Virginia’s overall population is expected to decline by approximately 20,000 or 1.1 percent from 2010 to 2030. Regionally, it is anticipated that the most significant population decreases will occur primarily in southern and southwestern West Virginia and the Northern Panhandle, while portions of the Eastern Panhandle and northeastern West Virginia are expected to grow. Correspondingly, the greatest employment gains are expected in the regions experiencing population growth.
Labor Force
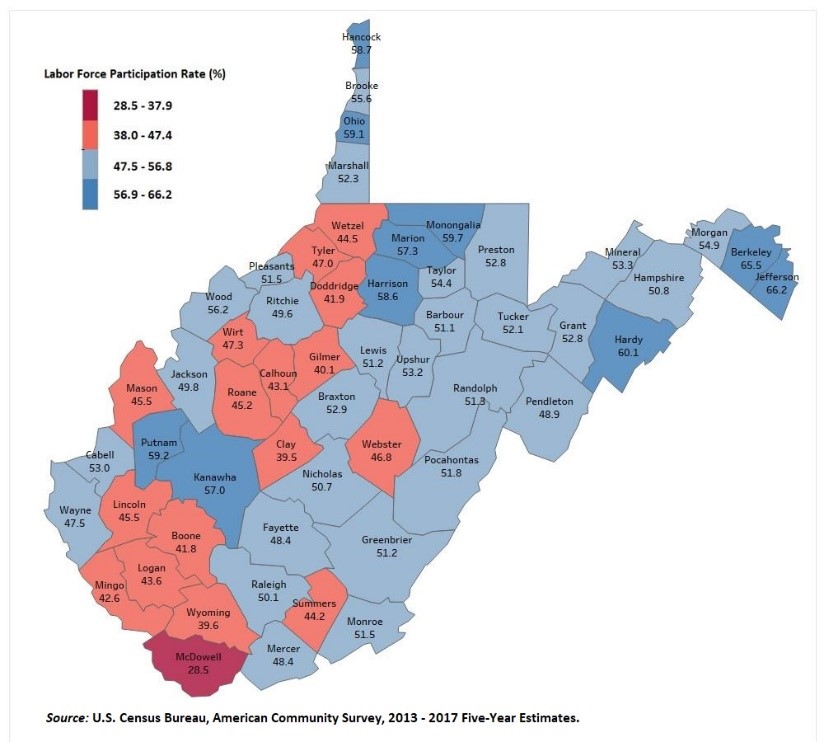
Figure 38: Labor Force Participation Rate by County
The labor force participation rate (LFPR) in West Virginia increased slightly from 53.3% in 2017 to 53.8% in 2018. The national labor force participation rate stalled at 62.9% between 2017 and 2018. For several decades, the state’s LFPR has been significantly (about 9%) lower than the nation but generally follows the national pattern.
Less than one-half (41.8%) of West Virginia counties recorded a labor force participation rate less than 50.0 percent during the 2013-2017 period. Several of these counties are located in the southern coalfields of West Virginia. McDowell County recorded a labor force participation rate of 28.5 percent, the lowest in the state. Other southern counties with a labor force participation rate less than 50 percent included Wyoming (39.6%), Boone (41.8%), Mingo (42.6%), Logan (43.6%), Summers (44.2%), Lincoln (45.5%), Wayne (47.5%), Fayette (48.4%), and Mercer (48.4%).
Three counties, all in the eastern panhandle of the state, recorded a labor force participation rate greater than 60.0 percent. Hardy County recorded a labor force participation rate of 60.1 percent, while Berkeley (65.5%) and Jefferson (66.2%) recorded labor force participation rates greater than that of the United States (62.9%).
Figure 39: Labor Force Participation Rate by State
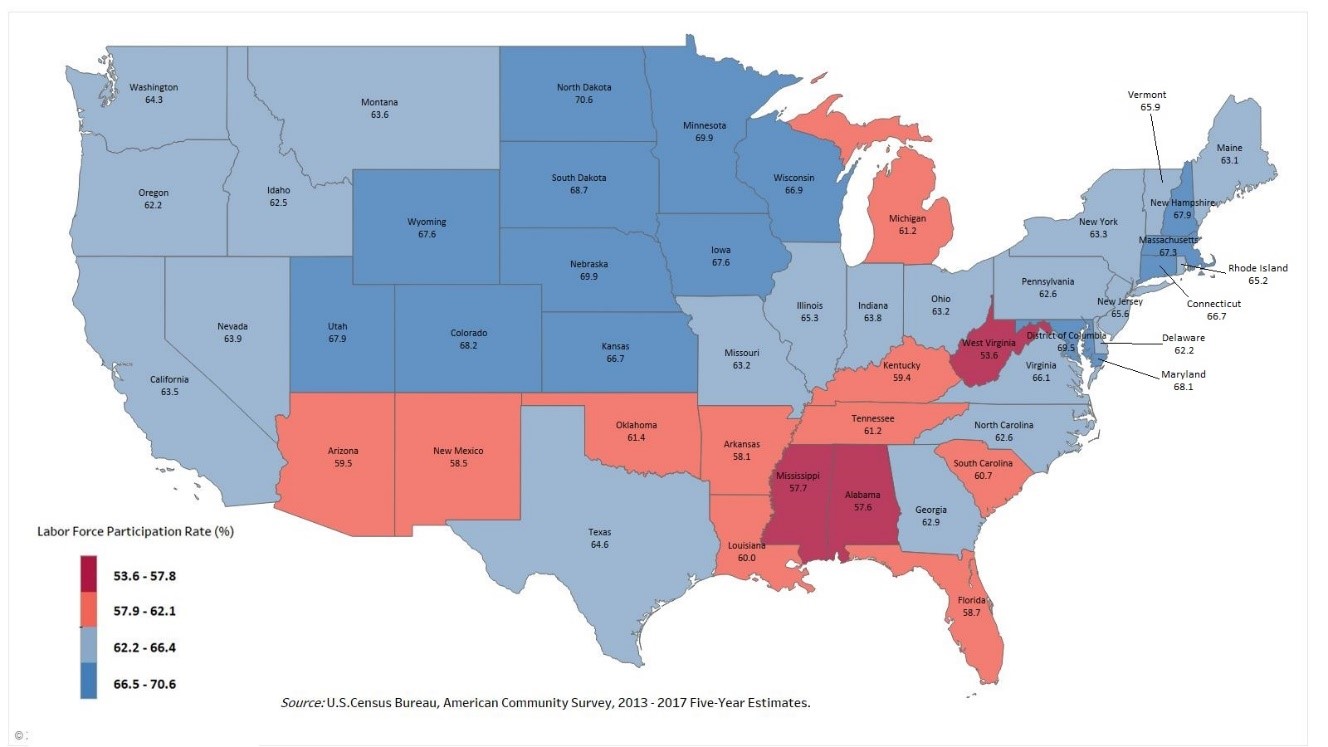
According to the Bureau of Labor Statistics, the U.S. labor force is projected to grow at an annual rate of 0.6, from 159.2 million people in 2016 to 169.7 million people in 2026, an increase of about 10.5 million people, slightly higher than the 2006-2016 decade. Several factors, including population decline, uncertainty around population migration patterns in the coming decade, and age composition continue to affect the state’s projected LFPR. Workforce-related factors include the discouraged worker effect, health-related limitations, education, and retirement. Educational attainment and social factors such as the state’s opioid epidemic present challenges as well. As of 2018, West Virginia’s LFPR was the lowest among all states.
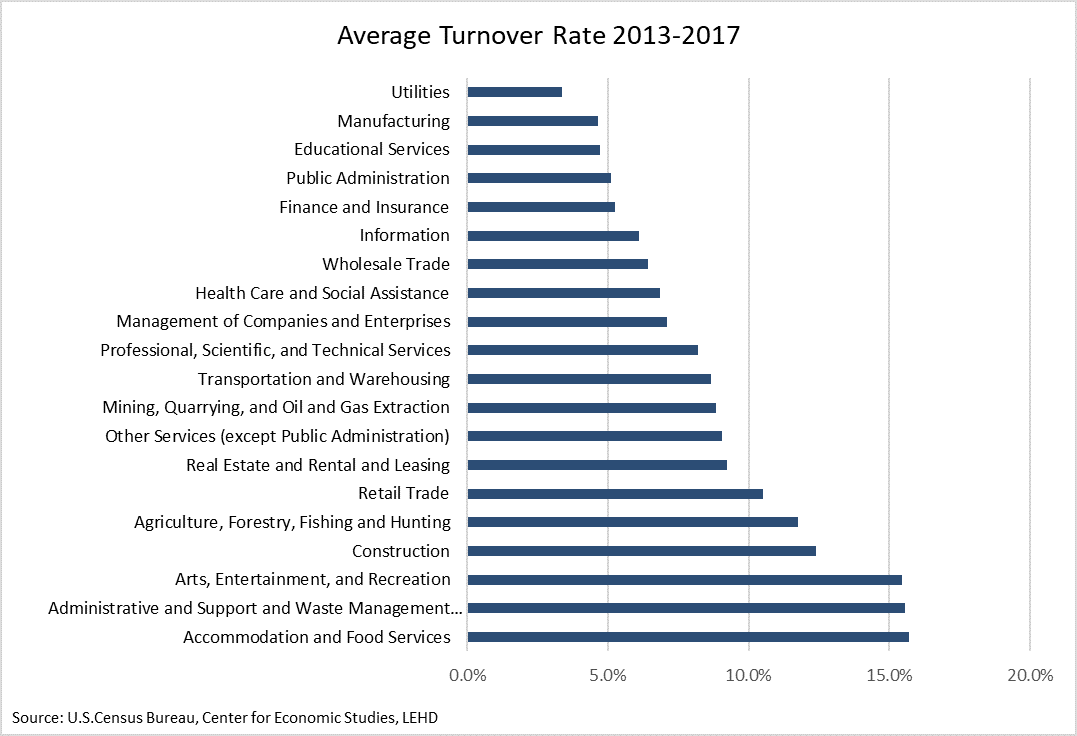
Turnover rates are another important aspect to consider in reviewing employment trends. Turnover rates can vary by industry and by a variety of demographic characteristics, such as education, race, sex, and age. In West Virginia, between 2013 and 2017 industry sectors with the highest average turnover rates include Accommodation and Food Services., Administrative and Support and Waste Management and Remediation Services, and Arts, Entertainment, and Recreation. Sectors with the lowest turnover rates include Utilities, Educational Services, and Manufacturing. High turnover rates in industry sectors can indicate a number of possibilities, including, but not limited to, seasonality, short business cycles, part-time employment status, employee dissatisfaction, and health risks.
Figure 40: Average Turnover Rates 2013-2017
(Bar graph reveals a list of industries ranked from lowest to highest turnover rates for the period 2013-2017.)
Between 2013 and 2017, turnover rates were higher among males (8.9%) compared with females (8.2%).
Figure 41: Average Turnover Rates 2013-2017 by Sex
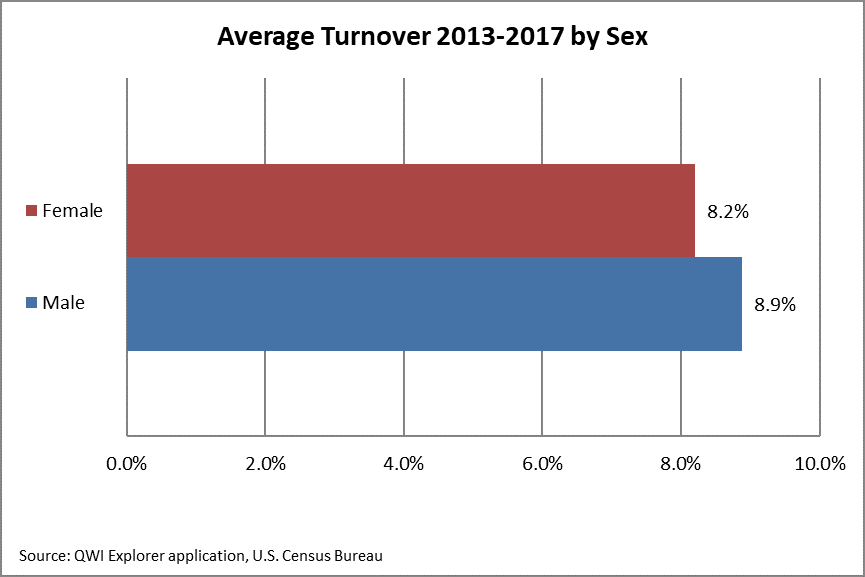
Figure 42: Average Turnover Rates 2013-2017 by Race
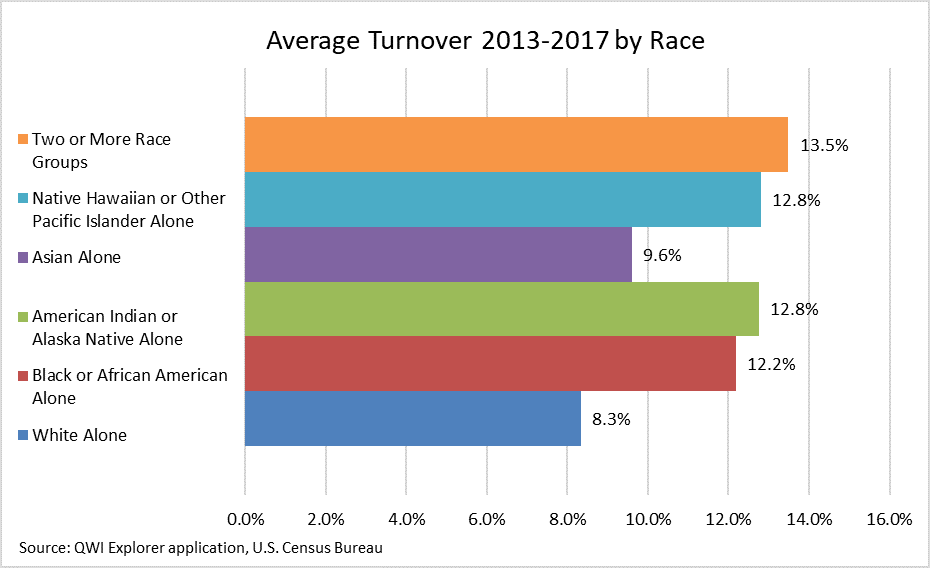
Regarding race, turnover rates were lowest among Whites (8.3%) and Asians (9.6%); The highest turnover rate was among Two or More Races (13.5%), followed by American Indian/Alaskan Native (12.8%) and Native Hawaiian or Other Pacific Islander (12.8%), and Black or African-American (12.2%).
Figure 43: Average Turnover Rates 2013-2017 by Age
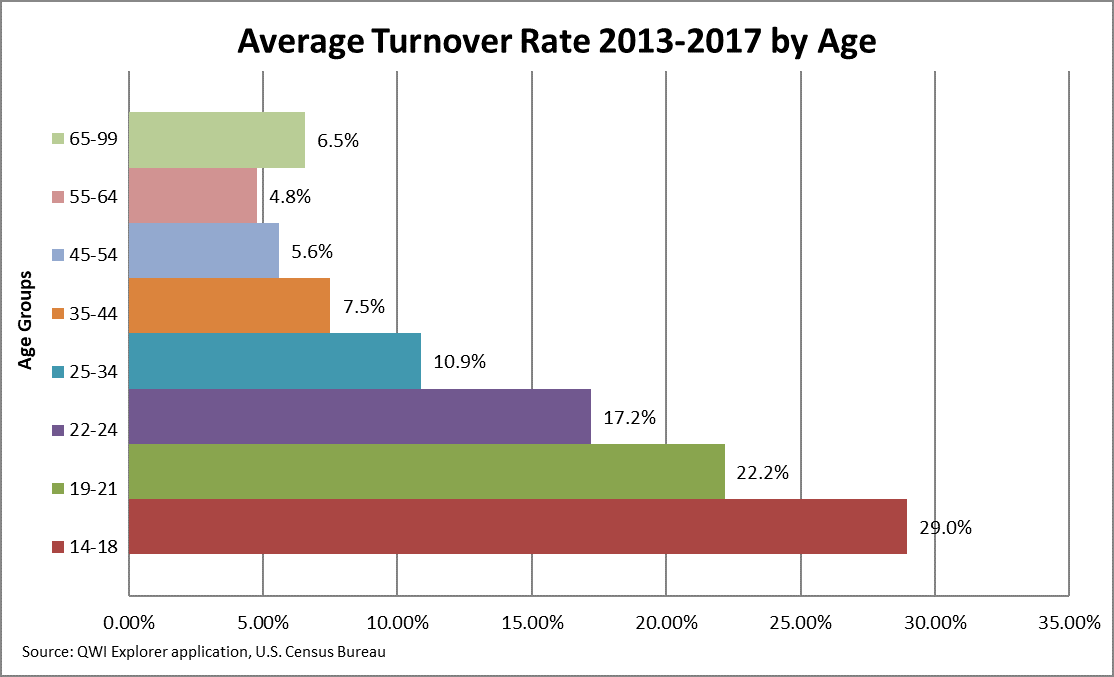
Turnover rates were highest among the age group of 14-18 years of age (29.0%) and lowest for the age group of 55-64 years of age (4.8%).
Also, higher levels of education correspond with lower rates of job turnover, where in 2017, the average turnover rate of those with less than a high school diploma was 9.2 percent compared with 6.4 percent for those with a Bachelor’s Degree or higher.
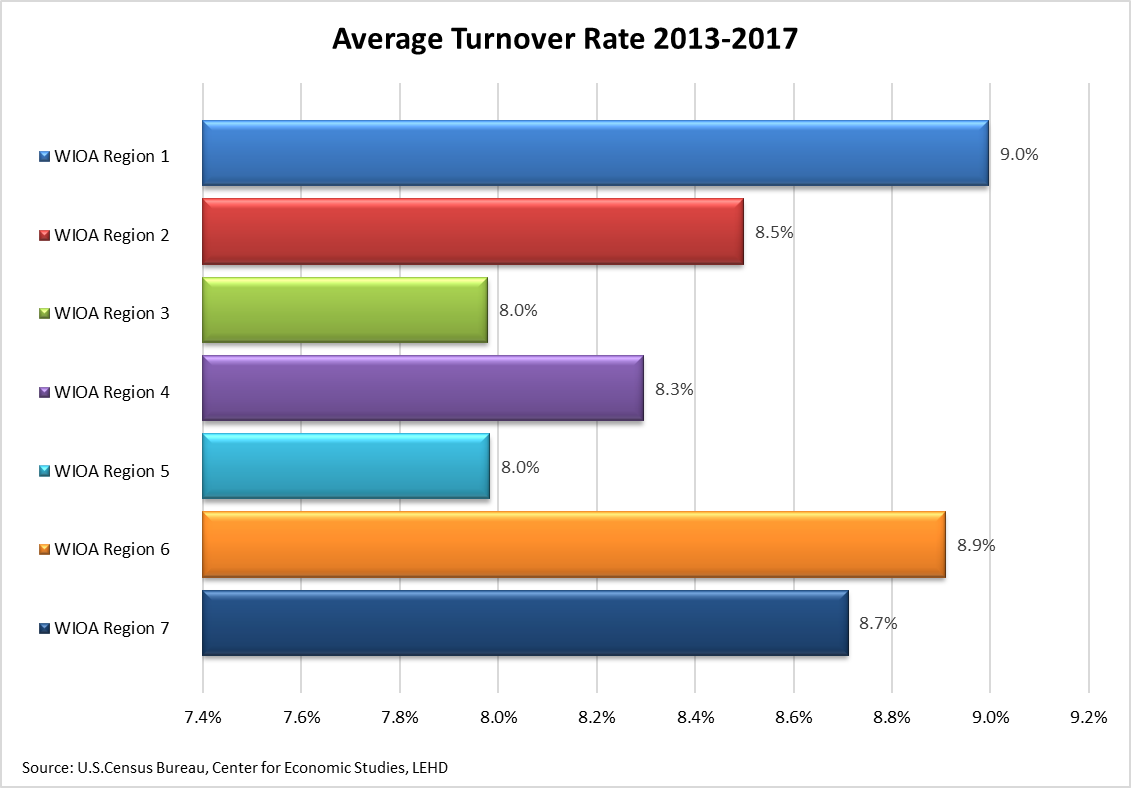
From a regional perspective, overall employment turnover rates ranged from 9.0 percent in WIOA Region 1, to 8.0 percent in WIOA Regions 3 and 5.
Figure 44: Average Turnover Rates for WIOA Regions 2013-2017
(Bar graph reflects turnover rates for the seven regions for the years 2013-2017.)
Occupations
Among the seven WIOA regions in West Virginia, occupations anticipating the greatest annual growth rates between 2016 and 2026 are largely healthcare related. This trend can be attributed to the state’s aging population, as well as the state’s high concentration of health issues including obesity, diabetes, and heart disease.
Many of the occupations with declining growth rates are those linked to changing technologies and declining industries. Occupations such as Telephone Operators and Data Entry Keyers are declining due to advances in technology, while declines in occupations such as Mine Shuttle Car Operators and Continuous Mining Machine Operators are due to both technological advances and competition from alternative forms of energy production.
WIOA Region 1 Occupational Employment Projections 2016-2026
Figure 45: Occupational Projections 2016-2026 for WIOA Region 1
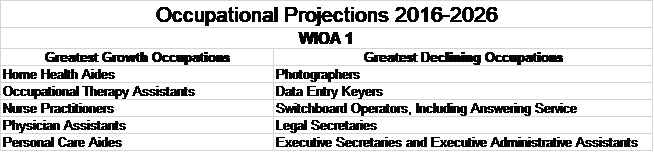
The top five occupations with the greatest projected annual growth rate within WIOA Region 1 are all healthcare related. These include Home Health Aides; Occupational Therapy Assistants, Nurse Practitioners, Physician Assistants, and Personal Care Aides.
Occupations with the greatest rate of annual decline in the region include Photographers; Data Entry Keyers; Switchboard Operators, Including Answering Service; Legal Secretaries; and Executive Secretaries and Executive Administrative Assistants.
WIOA Region 2 Occupational Employment Projections 2016-2026
Figure 46: Occupational Projections 2016-2026 for WIOA Region 2
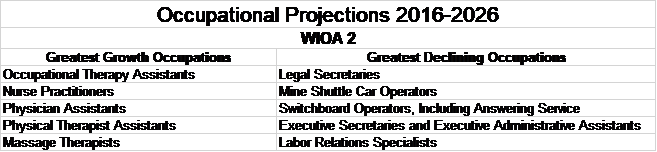
All of the top five occupations with the greatest projected annual growth rate within WIOA Region 2 are healthcare related. The top five consists of Occupational Therapy Assistants; Nurse Practitioners; Physician Assistants; Physical Therapy Assistants; and Massage Therapists.
The five occupations with the greatest annual rate of decline include Legal Secretaries; Mine Shuttle Car Operators; Switchboard Operators, Including Answering Service; Executive Secretaries and Executive Administrative Assistants; and Labor Relations Specialists.
WIOA Region 3 Occupational Employment Projections 2016-2026
Figure 47: Occupational Projections 2016-2026 for WIOA Region 3
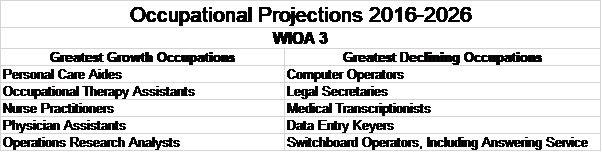
Healthcare Occupations lead the pack in the list of occupations with the greatest projected annual growth rate in WIOA Region 3. This group contains Personal Care Aides; Occupational Therapy Assistants; Nurse Practitioners; Physician Assistants; and Operations Research Analysts.
Occupations leading declines in WIOA Region 3 include Computer Operators; Legal Secretaries; Medical Transcriptionists; Data Entry Keyers; and Switchboard Operators, Including Answering Service.
WIOA Region 4 Occupational Employment Projections 2016-2026
Figure 48: Occupational Projections 2016-2026 for WIOA Region 4
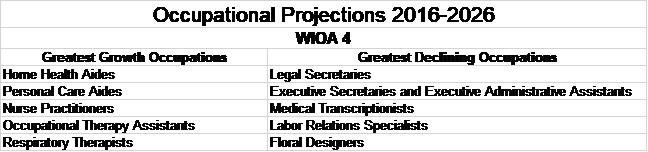
Occupations with the most projected annual growth in WIOA Region 4 include Home Health Aides; Personal Care Aides: Nurse Practitioners; Occupational Therapy Assistants; and Respiratory Therapists.
The greatest annual rate of decline will be seen among Legal Secretaries; Executive Secretaries and Executive Administrative Assistants; Medical Transcriptionists; Labor Relations Specialists; and Floral Designers.
WIOA Region 5 Occupational Projections 2016-2026
Figure 49: Occupational Projections 2016-2026 for WIOA Region 5
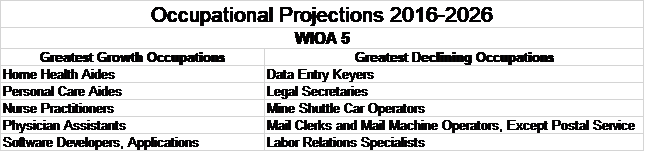
Occupations with the greatest projected annual growth rate within WIOA Region 5 include Home Health Aides; Personal Care Aides; Nurse Practitioners; Physician Assistants; and Software Developers, Applications.
Occupations with the greatest declines in the annual growth rate include Data Entry Keyers; Legal Secretaries; Mine Shuttle Car Operators; Mail Clerks and Mail Machine Operators, Except Postal Service; and Labor Relations Specialists.
WIOA Region 6 Occupational Projections 2016-2026
Figure 50: Occupational Projections 2016-2026 for WIOA Region 6
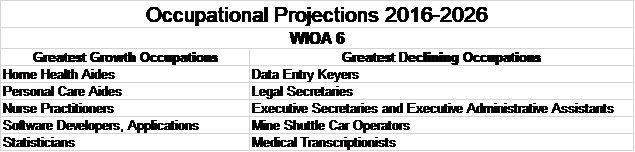
Occupations with the greatest projected annual growth rate in WIOA Region 6 include Home Health Aides; Personal Care Aides; Nurse Practitioners; Software Developers, Applications; and Statisticians.
Occupations with the greatest declines in the growth rate include Data Entry Keyers; Legal Secretaries; Executive Secretaries and Executive Administrative Assistants; Mine Shuttle Car Operators; and Medical Transcriptionists.
WIOA Region 7 Occupational Projections 2016-2026
Figure 51: Occupational Projections 2016-2026 for WIOA Region 7
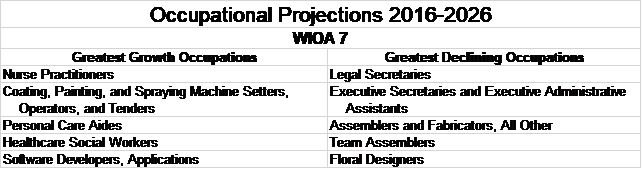
The top five occupations with the greatest projected annual growth rate in WIOA Region 7 include Nurse Practitioners; Coating, Painting, and Spraying Machine Setters, Operators, and Tenders; Personal Care Aides; Healthcare Social Workers; and Software Developers, Applications.
Occupations with the greatest declines in annual growth in the region include Legal Secretaries; Executive Secretaries and Executive Administrative Assistants; Assemblers and Fabricators, All Other; Team Assemblers; and Floral Designers.
Education and skiII leveIs of the Workforce. Provide an analysis of the educational and skiII leveIs of the workforce.
Education
Figure 52: Percent of Population Age 25 Years or Older with a Bachelor's Degree or Higher
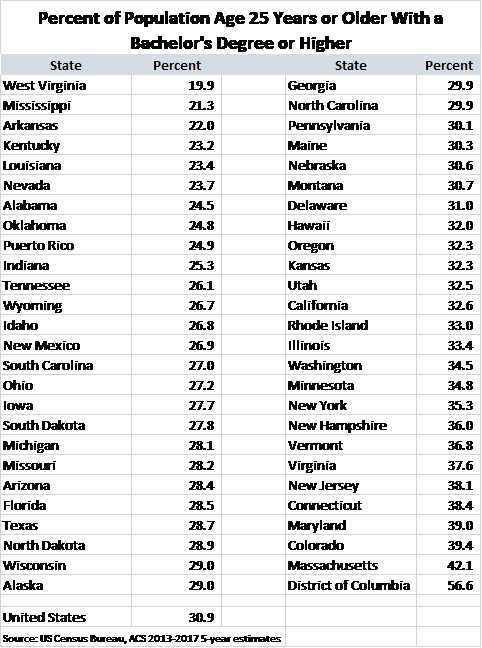
Over the coming decade, West Virginia’s job market will continue its demand for jobs that require more postsecondary education. Presently, based on 2017 data from the U.S. Census Bureau’s American Community Survey (ACS), West Virginia ranks last in percent of population age 25 years or older with a Bachelor’s degree or higher. As of 2017, 19.9 percent of West Virginians 25 and older have a Bachelor’s degree or better compared to 30.9 percent nationally.
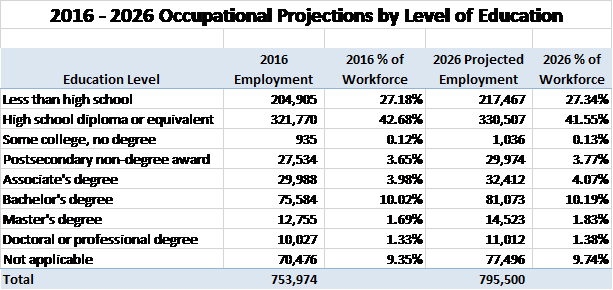
Based on WorkForce West Virginia’s employment projections (2016 - 2026), it is expected that jobs requiring a bachelor’s degree or higher will increase 5,489 (Figure 53). While projected growth in occupations through 2026 tips slightly towards jobs requiring a high school diploma or less, growth in all occupations is well balanced between these and jobs requiring postsecondary education. Figures C and D show poverty rates among West Virginians dramatically declining and wages increasing as education levels increase. Categorically, occupations requiring a High School Diploma or less are anticipated to grow by 21,299, while jobs requiring formal education beyond high school will expand by 20,227.
Figure 53: Projections by Level of Education
(Figure 53 shows employment projections based on eight education levels for the year 2026.)
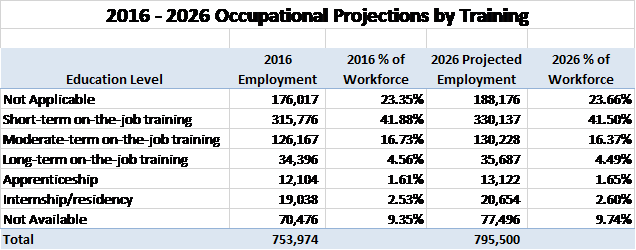
Beyond formal secondary and postsecondary education, some occupations require additional on-the-job training. The greatest growth through 2026 is expected for jobs requiring short-term on-the-job training. Figure 54 depicts the expected change by job training between 2016 and 2026. For most other categories, the relative share of employment is expected to change only slightly.
Figure 54: Projections by Training
(Figure 54 shows projected employment based on six levels of job training for the year 2026.)
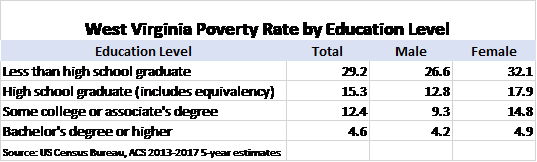
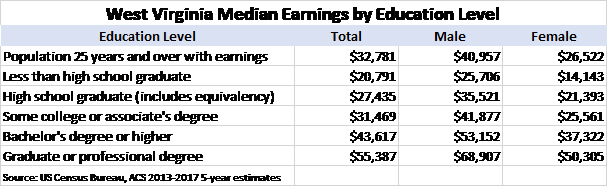
Education attainment scales with both poverty status and median annual earnings. As education levels increase, earnings increase, and, consequently, poverty decreases. In Figure 55, data from the U.S. Census Bureau depict the relative poverty levels by education attainment. Poverty rates are higher for females than for males in every category, although the gap closes considerably for individuals with a bachelor’s degree or higher.
Figure 55: Poverty Rate by Education Level
(Figure 55 depicts the poverty rate for West Virginians broken out by sex and four levels of education.)
Similarities can be observed when comparing median annual earnings by educational attainment (Figure 56). Higher levels of education correlate to higher levels of earnings, with females earning comparatively less in all categories.
Figure 56: Median Annual Earnings by Education Level
(Figure 56 depicts median annual earnings for West Virginians broken out by sex and levels of education.)
Based on 2017 Census data, levels of unemployment correlate with levels of education (Figure 57). The higher the level of education, the higher the level of participation in the labor force and, conversely, the lower the rate of unemployment. Individuals with less than a high school diploma had an unemployment rate (13.7%), nearly six times higher than individuals with a Bachelor’s degree or higher (2.4%), more than twice the unemployment rate of individuals with only some college or an Associate’s degree (5.6%), and nearly twice the unemployment rate of individuals with a high school diploma or equivalent (7.3%).
Figure 57: Employment Status by Education Level
(Figure 57 depicts employment status of West Virginians based on educational attainment.)
Also, as education levels increase, job turnover rates decrease. Using combined Census and BLS data for years 2013 through 2017, an average turnover rate was calculated (Figure 58).
Figure 58: Turnover Rate by Education Level
(Figure 58 depicts turnover rates for West Virginians based on four levels of educational attainment.)
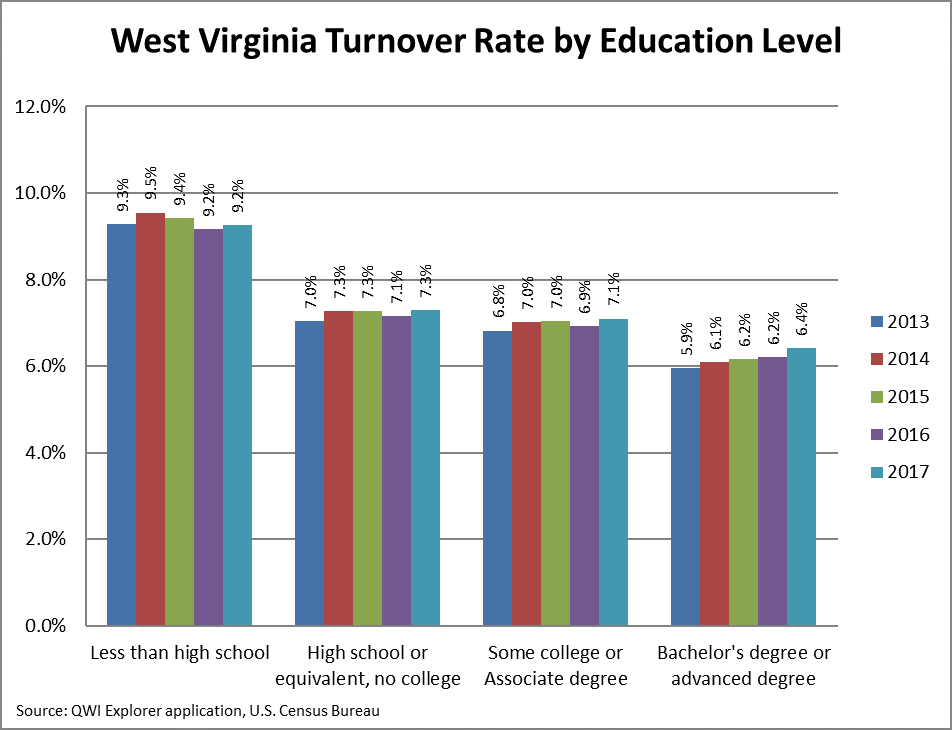
The education levels of West Virginians in the labor force, specifically those who were employed between 2013 and 2017 varies considerably by region of the state. During this five-year period, turnover rates for individuals with less than a high school diploma registered over nine percent each year, although it stayed at 9.2 percent in 2016 and 2017. Turnover rates for individuals with a high school diploma or equivalent and with no college remained over seven percent during this period, climbing to 7.3 percent in 2017. Turnover rates for job holders with either some college or an Associate degree hovered around the seven percent level, climbing to 7.1 percent in 2017. Job holders with a bachelor’s degree or higher saw turnover rates hovering around the six percent level, although the rate has been steadily climbing during this period and registered at 6.4 percent in 2017.
Describe apparent ‘skill gaps’.
The term Skills Gap, defined as “a significant mismatch between the needs of employers for skills and the current capabilities of available workforce”, has been a constant source of conversation and debate for many years. The unemployment rate is relatively high in West Virginia, and businesses have expressed concerns about finding skilled workers to fill vacancies.
Communication Skills
Communication skills are expected to have the greatest demand in West Virginia through 2026. Those specific skills are Active Listening, followed by Speaking, Social Perceptiveness, Reading Comprehension, and Service Orientation (Figure 59). Active Listening may be defined as “giving full attention to what other people are saying, taking time to understand the points being made, asking questions appropriately, and not interrupting at inappropriate times”. This simple and basic skill is necessary in many occupations, especially in healthcare and other service-related fields that require good communication and comprehension between service provider and customer. Over the next ten years, employers will need at least 177,102 employees with this skill, while the current supply is 165,045. This means we need over 10,000 people to acquire or develop this skill to meet the expected demand.
Figure 59: Skills Gap 2012-2026
(Figure 59 depicts the current and projected demand for selected skills through 2026.)
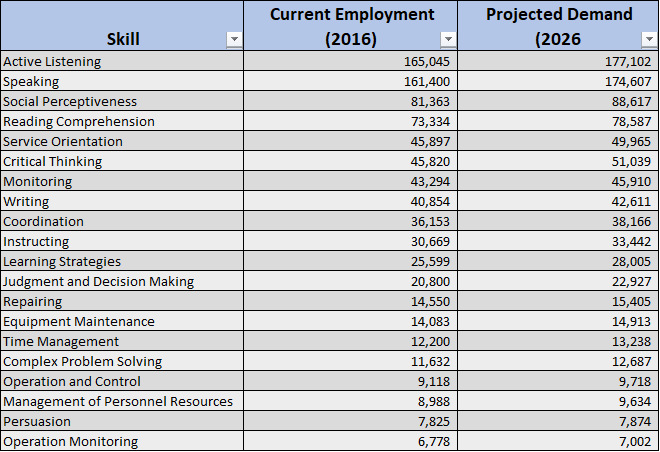
The state will require nearly half of its workforce to develop Social Perceptiveness, Speaking, and Service Orientation skills by 2026. These communication skills depict a substantial need, particularly in the healthcare support industry, in which occupations related to customer services are in high demand. Reading Comprehension is an issue for many West Virginians in the workforce. This skill refers to the person’s ability to read and understand information presented in written form. Good readers interact with text, making and validating predictions, and connecting the text events to their knowledge and experiences. Generally, this skill, together with Critical Thinking and Writing are acquired during K-12 education.
Figure 60: Skills Gap Distribution
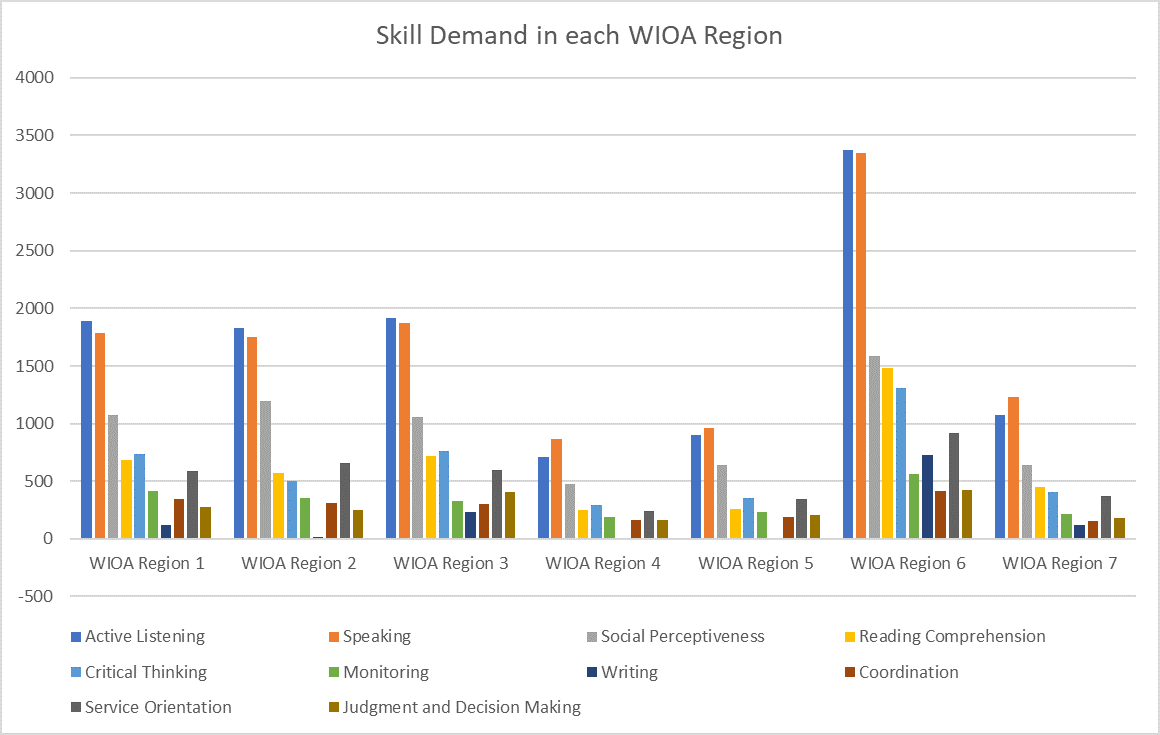
Figure 60 presents skill gaps distribution by region. Both Active Listening and Speaking rank highest among the WIOA regions, particularly in WIOA Region 6, while Social Perceptiveness ranks third among the skill gaps. Other skills ranking high in some regions include Reading Comprehension, Critical Thinking, and Service Orientation.
Figure 61: Gain/Loss of Workers in Each WIOA Region/Statewide by Educational Attainment Level, 2009-2018
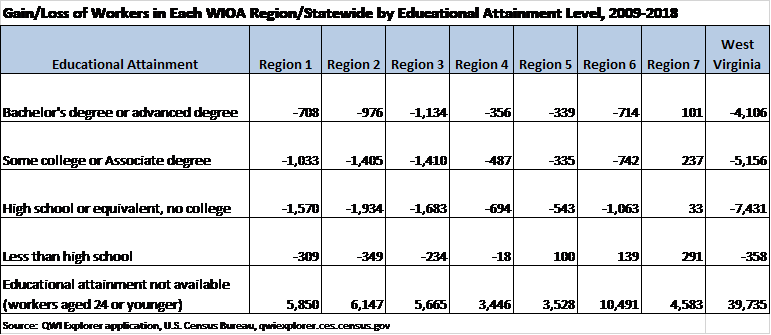
Figure 61 displays gains and losses of workers by education level for the state and the seven WIOA regions. Losses far outweigh gains, and this can be attributed to the persistent population loss West Virginia has experienced recently and will continue to experience through 2030 (See Population Forecast). Region 7, the sole area of the state to see consistent population gains, is the only WIOA region with gains in all education levels.
Knowledge and Ability also create a big effect on Skill gaps.
As we examine the skill gaps, it will be important to understand the relationship among Knowledge, Skills, and Abilities. Knowledge is a level of information or experience that an individual must have to be qualified for a position. Skills are learned or trained and can be developed through the transfer of knowledge. Abilities are the enduring attributes of the individual that influence performance. A person’s ability can affect his or her capacity to perform the job. Many recruiters use KSAs (Knowledge, Skills, and Abilities) to determine who the best applicants are among candidates.
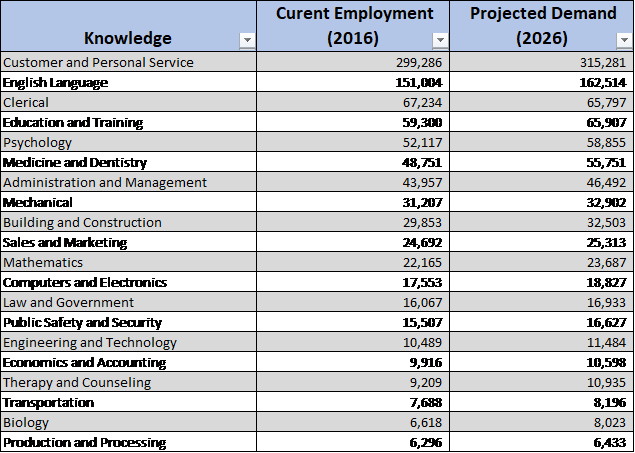
Among West Virginia’s workforce, the greatest gap in knowledge is Customer and Personal Service (see Figure 25). By 2026, more than 300,000 positions will require competency with the principles and processes for providing customer and personal services, including customer needs assessment and evaluation of customer satisfaction. English Language, surprisingly, is the second-highest knowledge gap requirement. The growing healthcare sector needs at least 100,000 employees who have knowledge in Psychology and Medicine and Dentistry.
Figure 62: Knowledge Gaps
(Figure 62 depicts projected knowledge gaps for the period 2016 through 2026.