


Located in:
- II. Strategic Elements
The Unified or Combined State Plan must include a Strategic Planning Elements section that analyzes the State’s current economic environment and identifies the State’s overall vision for its workforce development system. The required elements in this section allow the State to develop data-driven goals for preparing an educated and skilled workforce and to identify successful strategies for aligning workforce development programs to support economic growth. Unless otherwise noted, all Strategic Planning Elements apply to Combined State Plan partner programs included in the plan as well as to core programs.
- a. Economic, Workforce, and Workforce Development Activities Analysis
The Unified or Combined State Plan must include an analysis of the economic conditions, economic development strategies, and labor market in which the State’s workforce system and programs will operate.
- a. Economic, Workforce, and Workforce Development Activities Analysis
II. a. 1. A. Economic Analysis
The Unified or Combined State Plan must include an analysis of the economic conditions and trends in the State, including sub-State regions and any specific economic areas identified by the State. This must include—
i. Existing Demand Industry Sectors and Occupations
Provide an analysis of the industries and occupations for which there is existing demand.
ii. Emerging Demand Industry Sectors and Occupations
Provide an analysis of the industries and occupations for which demand is emerging.
iii. Employers’ Employment Needs
With regard to the industry sectors and occupations identified in (A)(i) and (ii), provide an assessment of the employment needs of employers, including a description of the knowledge, skills, and abilities required, including credentials and licenses.
Current Narrative:
This section will provide an analysis of the industries and occupations for which there is existing demand in Oklahoma. The Oklahoma Office of Workforce Development partnered with the Oklahoma Department of Commerce to identify Oklahoma’s State-level Industry Clusters and Regional-Specific Industry Clusters. The Oklahoma Department of Commerce identified five key demand industry sectors, which we refer to in this state as Industry Clusters. We have identified these sectors / clusters as giving Oklahoma a competitive advantage in a global economy. They exhibit significant potential for employment growth, and provide wealth generating employment opportunities. The five State Industry Clusters’ demand industries produce or provide similar goods and services and therefore have similar needs in workforce, infrastructure, and economic development policy. The five State Industry Clusters are Aerospace & Defense, Agriculture & Biosciences, Energy, Information and Financial Services, and Transportation and Distribution.
| 1. Aerospace & Defense |
| 2. Agriculture & Bioscience |
| 3. Energy |
| 4. Information & Financial Services |
| 5. Transportation & Distribution |
| State Industry Clusters | Estimated Net Job Growth (2019-2024) | Industry Cluster Growth Rate (2019-2024) | Average Annual Earnings |
|---|---|---|---|
| Aerospace and Defense | 8,647 | 8% | $71,736 |
| Agriculture and Bioscience | 3,350 | 4% | $63,179 |
| Energy | 10,583 | 9% | $109,730 |
| Information and Financial Services | 3,333 | 3% | $85,131 |
| Transportation and Distribution | 7,653 | 6% | $70,310 |
Source: EMSI 2019.4
Aerospace & Defense
Oklahoma is one of seven global aerospace hubs and home to the largest military and commercial aircraft maintenance, repair and overhaul operations in the United States. In 2019 there were 123,680 jobs in the Aerospace & Defense Industry Cluster employs 5.2% of the state’s workforce with average earnings of approximately $68,103. Analysis of job growth due to economic demand estimates that total employment will increase to 133,018 jobs by 2024, an increase of 9,338 jobs for the state.
Aerospace & Defense Existing Demand Industries
The following Industries are the top 10 in terms of total number of jobs in 2019.
| NAICS | Description | 2019 Jobs | Avg. Earnings Per Job |
|---|---|---|---|
| 90120 | Federal Government, Military | 32,644 | $46,753 |
| 54161 | Management Consulting Services | 14,332 | $56,050 |
| 33641 | Aerospace Product and Parts Manufacturing | 13,239 | $111,441 |
| 54151 | Computer Systems Design and Related Services | 12,571 | $76,389 |
| 54133 | Engineering Services | 8,564 | $89,688 |
| 81131 | Commercial and Industrial Machinery and Equipment (except Automotive and Electronic) Repair and Maintenance | 5,433 | $62,870 |
| 33271 | Machine Shops | 5,342 | $56,221 |
| 33231 | Plate Work and Fabricated Structural Product Manufacturing | 4,182 | $71,234 |
| 48819 | Other Support Activities for Air Transportation | 3,715 | $82,047 |
| 61151 | Technical and Trade Schools | 3,095 | $51,896 |
Source: EMSI 2019.4
Aerospace & Defense Existing Demand Occupations
The following Occupations are the top 10 in terms of total number of jobs in 2019.
| SOC | Description | 2019 Jobs | Median Hourly Earnings | Median Annual Earnings | Typical Entry Level Education | Work Experience Required | Typical On-The-Job Training |
|---|---|---|---|---|---|---|---|
| 11-1021 | General and Operations Managers | 27,027 | $39.51 | $82,180.80 | Bachelor's degree | 5 years or more | None |
| 11-9041 | Architectural and Engineering Managers | 2,033 | $60.10 | $125,008.00 | Bachelor's degree | 5 years or more | None |
| 15-1133 | Software Developers, Systems Software | 1,825 | $42.14 | $87,651.20 | Bachelor's degree | None | None |
| 15-1132 | Software Developers, Applications | 4,560 | $40.82 | $84,905.60 | Bachelor's degree | None | None |
| 17-2141 | Mechanical Engineers | 2,939 | $40.48 | $84,198.40 | Bachelor's degree | None | None |
| 17-2072 | Electronics Engineers, Except Computer | 1,887 | $44.33 | $92,206.40 | Bachelor's degree | None | None |
| 17-2071 | Electrical Engineers | 1,438 | $46.08 | $95,846.40 | Bachelor's degree | None | None |
| 17-2199 | Engineers, All Other | 1,338 | $39.89 | $82,971.20 | Bachelor's degree | None | None |
| 51-9061 | Inspectors, Testers, Sorters, Samplers, and Weighers | 6,039 | $20.10 | $41,808.00 | High school diploma or equivalent | None | Moderate-term on-the-job training |
| 17-2112 | Industrial Engineers | 1,756 | $39.57 | $82,305.60 | Bachelor's degree | None | None |
Source: EMSI 2019.4
Aerospace & Defense Emerging Demand Industries
The following are the Top 10 emerging industries in terms of number of new jobs in 2024
| NAICS | Description | 2019 Jobs | 2024 Jobs | 2019 - 2024 Change | 2019 - 2024 % Change |
|---|---|---|---|---|---|
| 33641 | Aerospace Product and Parts Manufacturing | 13,239 | 18,525 | 5,286 | 40% |
| 54161 | Management Consulting Services | 14,332 | 15,630 | 1,298 | 9% |
| 54151 | Computer Systems Design and Related Services | 12,571 | 13,868 | 1,297 | 10% |
| 81131 | Commercial and Industrial Machinery and Equipment (except Automotive and Electronic) Repair and Maintenance | 5,433 | 6,195 | 762 | 14% |
| 54133 | Engineering Services | 8,564 | 9,011 | 447 | 5% |
| 54169 | Other Scientific and Technical Consulting Services | 3,072 | 3,510 | 438 | 14% |
| 33271 | Machine Shops | 5,342 | 5,556 | 214 | 4% |
| 48819 | Other Support Activities for Air Transportation | 3,715 | 3,925 | 210 | 6% |
| 33231 | Plate Work and Fabricated Structural Product Manufacturing | 4,182 | 4,387 | 205 | 5% |
| 33351 | Metalworking Machinery Manufacturing | 1,390 | 1,535 | 145 | 10% |
Source: EMSI 2019.4
Aerospace & Defense Emerging Demand Occupations
The following are the Top 10 emerging occupations in terms of number of new jobs in 2024.
| SOC | Description | 2019 Jobs | 2024 Jobs | 2019 - 2024 Change | 2019 - 2024 % Change | Median Hourly Earnings | Median Annual Earnings |
|---|---|---|---|---|---|---|---|
| 11-1021 | General and Operations Managers | 27,027 | 28,765 | 1,738 | 6% | $39.51 | $82,180.80 |
| 15-1132 | Software Developers, Applications | 4,560 | 5,292 | 732 | 16% | $40.82 | $84,905.60 |
| 13-1199 | Business Operations Specialists, All Other | 5,244 | 5,902 | 658 | 13% | $34.19 | $71,115.20 |
| 51-2011 | Aircraft Structure, Surfaces, Rigging, and Systems Assemblers | 2,367 | 2,855 | 488 | 21% | $22.86 | $47,548.80 |
| 51-1011 | First-Line Supervisors of Production and Operating Workers | 9,375 | 9,846 | 471 | 5% | $27.69 | $57,595.20 |
| 51-4041 | Machinists | 5,331 | 5,791 | 460 | 9% | $20.74 | $43,139.20 |
| 17-2112 | Industrial Engineers | 1,756 | 2,164 | 408 | 23% | $39.57 | $82,305.60 |
| 43-5061 | Production, Planning, and Expediting Clerks | 6,493 | 6,866 | 373 | 6% | $22.92 | $47,673.60 |
| 17-2141 | Mechanical Engineers | 2,939 | 3,303 | 364 | 12% | $40.48 | $84,198.40 |
| 51-4011 | Computer-Controlled Machine Tool Operators, Metal and Plastic | 3,280 | 3,575 | 295 | 9% | $18.42 | $38,313.60 |
Source: EMSI 2019.4
Energy
In 2019 the Energy Industry Cluster accounted for 216,723 jobs with average earnings of $80,860. Demand drives the cyclical nature of the Energy Industry Cluster hiring. The demand is expected to grow the industry cluster by 27,293 jobs, resulting in a total of 244,016 jobs in 2024. Extensive skills and training is required to work in the Energy Industry Cluster. These skills allow energy workers to transfer employment from one Industry Cluster to another.
Energy
The following Industries are the top 10 in terms of total number of jobs in 2019.
| NAICS | Description | 2019 Jobs | Avg. Earnings Per Job |
|---|---|---|---|
| 21112 | Crude Petroleum Extraction | 82,736 | $68,018 |
| 21311 | Support Activities for Mining | 41,270 | $85,595 |
| 21113 | Natural Gas Extraction | 30,561 | $75,605 |
| 23712 | Oil and Gas Pipeline and Related Structures Construction | 8,122 | $81,997 |
| 33313 | Mining and Oil and Gas Field Machinery Manufacturing | 7,667 | $81,820 |
| 33341 | Ventilation, Heating, Air-Conditioning, and Commercial Refrigeration Equipment Manufacturing | 6,073 | $64,019 |
| 22112 | Electric Power Transmission, Control, and Distribution | 4,669 | $116,134 |
| 33241 | Power Boiler and Heat Exchanger Manufacturing | 4,081 | $87,607 |
| 22121 | Natural Gas Distribution | 3,920 | $179,583 |
| 23713 | Power and Communication Line and Related Structures Construction | 3,548 | $66,270 |
Source: EMSI 2019.4
Energy
The following Occupations are the top 10 in terms of total number of jobs in 2019.
| SOC | Description | 2019 Jobs | Median Hourly Earnings | Median Annual Earnings | Typical Entry Level Education | Work Experience Required | Typical On-The-Job Training |
|---|---|---|---|---|---|---|---|
| 43-6014 | Secretaries and Administrative Assistants, Except Legal, Medical, and Executive | 32,439 | $14.71 | $30,596.80 | High school diploma or equivalent | None | Short-term on-the-job training |
| 53-7062 | Laborers and Freight, Stock, and Material Movers, Hand | 30,682 | $13.49 | $28,059.20 | No formal educational credential | None | Short-term on-the-job training |
| 43-9061 | Office Clerks, General | 30,091 | $12.96 | $26,956.80 | High school diploma or equivalent | None | Short-term on-the-job training |
| 11-1021 | General and Operations Managers | 27,027 | $39.51 | $82,180.80 | Bachelor's degree | 5 years or more | None |
| 53-3032 | Heavy and Tractor-Trailer Truck Drivers | 26,746 | $20.07 | $41,745.60 | Postsecondary nondegree award | None | Short-term on-the-job training |
| 49-9071 | Maintenance and Repair Workers, General | 17,258 | $15.56 | $32,364.80 | High school diploma or equivalent | None | Moderate-term on-the-job training |
| 13-2011 | Accountants and Auditors | 14,301 | $31.27 | $65,041.60 | Bachelor's degree | None | None |
| 51-2098 | Assemblers and Fabricators, All Other, Including Team Assemblers | 11,782 | $14.81 | $30,804.80 | High school diploma or equivalent | None | Moderate-term on-the-job training |
| 47-1011 | First-Line Supervisors of Construction Trades and Extraction Workers | 10,037 | $30.39 | $63,211.20 | High school diploma or equivalent | 5 years or more | None |
| 41-4012 | Sales Representatives, Wholesale and Manufacturing, Except Technical and Scientific Products | 9,742 | $22.98 | $47,798.40 | High school diploma or equivalent | None | Moderate-term on-the-job training |
Source: EMSI 2019.4
Energy
The following are the Top 10 emerging industries in terms of number of new jobs in 2024
| NAICS | Description | 2019 Jobs | 2024 Jobs | 2019 - 2024 Change | 2019 - 2024 % Change |
|---|---|---|---|---|---|
| 21112 | Crude Petroleum Extraction | 82,736 | 93,198 | 10,462 | 13% |
| 21311 | Support Activities for Mining | 41,270 | 48,720 | 7,450 | 18% |
| 21113 | Natural Gas Extraction | 30,561 | 35,265 | 4,704 | 15% |
| 23712 | Oil and Gas Pipeline and Related Structures Construction | 8,122 | 11,123 | 3,001 | 37% |
| 23713 | Power and Communication Line and Related Structures Construction | 3,548 | 4,129 | 581 | 16% |
| 33313 | Mining and Oil and Gas Field Machinery Manufacturing | 7,667 | 7,997 | 330 | 4% |
| 22112 | Electric Power Transmission, Control, and Distribution | 4,669 | 4,944 | 275 | 6% |
| 33241 | Power Boiler and Heat Exchanger Manufacturing | 4,081 | 4,349 | 268 | 7% |
| 33291 | Metal Valve Manufacturing | 2,851 | 3,097 | 246 | 9% |
| 48621 | Pipeline Transportation of Natural Gas | 1,402 | 1,567 | 165 | 12% |
Source: EMSI 2019.4
Energy
The following are the Top 10 emerging occupations in terms of number of new jobs in 2024.
| SOC | Description | 2019 Jobs | 2024 Jobs | 2019 - 2024 Change | 2019 - 2024 % Change | Median Hourly Earnings | Median Annual Earnings |
|---|---|---|---|---|---|---|---|
| 53-7062 | Laborers and Freight, Stock, and Material Movers, Hand | 30,682 | 33,034 | 2,352 | 8% | $13.49 | $28,059.20 |
| 53-3032 | Heavy and Tractor-Trailer Truck Drivers | 26,746 | 28,909 | 2,163 | 8% | $20.07 | $41,745.60 |
| 11-1021 | General and Operations Managers | 27,027 | 28,765 | 1,738 | 6% | $39.51 | $82,180.80 |
| 13-2011 | Accountants and Auditors | 14,301 | 15,622 | 1,321 | 9% | $31.27 | $65,041.60 |
| 47-1011 | First-Line Supervisors of Construction Trades and Extraction Workers | 10,037 | 11,113 | 1,076 | 11% | $30.39 | $63,211.20 |
| 49-9071 | Maintenance and Repair Workers, General | 17,258 | 18,304 | 1,046 | 6% | $15.56 | $32,364.80 |
| 41-4012 | Sales Representatives, Wholesale and Manufacturing, Except Technical and Scientific Products | 9,742 | 10,604 | 862 | 9% | $22.98 | $47,798.40 |
| 47-5071 | Roustabouts, Oil and Gas | 5,774 | 6,629 | 855 | 15% | $18.61 | $38,708.80 |
| 47-2073 | Operating Engineers and Other Construction Equipment Operators | 6,713 | 7,528 | 815 | 12% | $18.60 | $38,688.00 |
| 47-5013 | Service Unit Operators, Oil, Gas, and Mining | 2,962 | 3,578 | 616 | 21% | $19.44 | $40,435.20 |
Source: EMSI 2019.4
Agriculture & Biosciences
Jobs within the Agriculture & Biosciences Industry Cluster totaled 167,412 jobs in Oklahoma, with average earnings of $46,254.
Agriculture & Biosciences
The following Industries are the top 10 in terms of total number of jobs in 2019.
| NAICS | Description | 2019 Jobs | 2024 Jobs | 2019 - 2024 Change | 2019 - 2024 % Change | Avg. Earnings Per Job |
|---|---|---|---|---|---|---|
| 11200 | Animal Production | 54,431 | 53,995 | (436) | (1%) | $31,926 |
| 11100 | Crop Production | 24,959 | 25,662 | 703 | 3% | $24,855 |
| 54199 | All Other Professional, Scientific, and Technical Services | 12,013 | 12,602 | 589 | 5% | $48,596 |
| 31161 | Animal Slaughtering and Processing | 8,912 | 9,268 | 356 | 4% | $49,117 |
| 54133 | Engineering Services | 8,564 | 9,011 | 447 | 5% | $89,688 |
| 11511 | Support Activities for Crop Production | 5,554 | 5,949 | 395 | 7% | $29,110 |
| 54194 | Veterinary Services | 5,387 | 5,893 | 506 | 9% | $39,084 |
| 62151 | Medical and Diagnostic Laboratories | 3,176 | 3,687 | 511 | 16% | $69,767 |
| 33451 | Navigational, Measuring, Electromedical, and Control Instruments Manufacturing | 2,622 | 2,670 | 48 | 2% | $90,167 |
| 31181 | Bread and Bakery Product Manufacturing | 2,487 | 2,508 | 21 | 1% | $44,419 |
Source: EMSI 2019.4
Agriculture & Biosciences
The following Occupations are the top 10 in terms of total number of jobs in 2019.
| SOC | Description | 2019 Jobs | Median Hourly Earnings | Median Annual Earnings | Typical Entry Level Education | Work Experience Required | Typical On-The-Job Training |
|---|---|---|---|---|---|---|---|
| 43-6014 | Secretaries and Administrative Assistants, Except Legal, Medical, and Executive | 32,439 | $14.71 | $30,596.80 | High school diploma or equivalent | None | Short-term on-the-job training |
| 53-7062 | Laborers and Freight, Stock, and Material Movers, Hand | 30,682 | $13.49 | $28,059.20 | No formal educational credential | None | Short-term on-the-job training |
| 43-4051 | Customer Service Representatives | 30,169 | $14.62 | $30,409.60 | High school diploma or equivalent | None | Short-term on-the-job training |
| 43-9061 | Office Clerks, General | 30,091 | $12.96 | $26,956.80 | High school diploma or equivalent | None | Short-term on-the-job training |
| 11-1021 | General and Operations Managers | 27,027 | $39.51 | $82,180.80 | Bachelor's degree | 5 years or more | None |
| 53-3032 | Heavy and Tractor-Trailer Truck Drivers | 26,746 | $20.07 | $41,745.60 | Postsecondary nondegree award | None | Short-term on-the-job training |
| 43-3031 | Bookkeeping, Accounting, and Auditing Clerks | 23,261 | $17.88 | $37,190.40 | Some college, no degree | None | Moderate-term on-the-job training |
| 43-5081 | Stock Clerks and Order Fillers | 20,683 | $11.55 | $24,024.00 | High school diploma or equivalent | None | Short-term on-the-job training |
| 49-9071 | Maintenance and Repair Workers, General | 17,258 | $15.56 | $32,364.80 | High school diploma or equivalent | None | Moderate-term on-the-job training |
| 41-3099 | Sales Representatives, Services, All Other | 9,507 | $21.76 | $45,260.80 | High school diploma or equivalent | None | Moderate-term on-the-job training |
Source: EMSI 2019.4
Agriculture & Biosciences
The following are the Top 10 emerging industries in terms of number of new jobs in 2024
| NAICS | Description | 2019 Jobs | 2024 Jobs | 2019 - 2024 Change | 2019 - 2024 % Change | Avg. Earnings Per Job |
|---|---|---|---|---|---|---|
| 11100 | Crop Production | 24,959 | 25,662 | 703 | 3% | $24,855 |
| 54199 | All Other Professional, Scientific, and Technical Services | 12,013 | 12,602 | 589 | 5% | $48,596 |
| 62151 | Medical and Diagnostic Laboratories | 3,176 | 3,687 | 511 | 16% | $69,767 |
| 54194 | Veterinary Services | 5,387 | 5,893 | 506 | 9% | $39,084 |
| 54133 | Engineering Services | 8,564 | 9,011 | 447 | 5% | $89,688 |
| 11511 | Support Activities for Crop Production | 5,554 | 5,949 | 395 | 7% | $29,110 |
| 31161 | Animal Slaughtering and Processing | 8,912 | 9,268 | 356 | 4% | $49,117 |
| 42481 | Beer and Ale Merchant Wholesalers | 1,472 | 1,743 | 271 | 18% | $56,893 |
| 32541 | Pharmaceutical and Medicine Manufacturing | 771 | 924 | 153 | 20% | $108,283 |
| 42449 | Other Grocery and Related Products Merchant Wholesalers | 2,229 | 2,370 | 141 | 6% | $58,585 |
Source: EMSI 2019.4
Agriculture & Biosciences Emerging Demand Occupations
| SOC | Description | 2019 Jobs | 2024 Jobs | 2019 - 2024 Change | 2019 - 2024 % Change | Median Hourly Earnings | Median Annual Earnings |
|---|---|---|---|---|---|---|---|
| 53-7062 | Laborers and Freight, Stock, and Material Movers, Hand | 30,682 | 33,034 | 2,352 | 8% | $13.49 | $28,059.20 |
| 53-3032 | Heavy and Tractor-Trailer Truck Drivers | 26,746 | 28,909 | 2,163 | 8% | $20.07 | $41,745.60 |
| 11-1021 | General and Operations Managers | 27,027 | 28,765 | 1,738 | 6% | $39.51 | $82,180.80 |
| 49-9071 | Maintenance and Repair Workers, General | 17,258 | 18,304 | 1,046 | 6% | $15.56 | $32,364.80 |
| 43-5081 | Stock Clerks and Order Fillers | 20,683 | 21,380 | 697 | 3% | $11.55 | $24,024.00 |
| 13-1199 | Business Operations Specialists, All Other | 5,244 | 5,902 | 658 | 13% | $34.19 | $71,115.20 |
| 43-9061 | Office Clerks, General | 30,091 | 30,616 | 525 | 2% | $12.96 | $26,956.80 |
| 37-3011 | Landscaping and Groundskeeping Workers | 8,222 | 8,727 | 505 | 6% | $12.47 | $25,937.60 |
| 41-3099 | Sales Representatives, Services, All Other | 9,507 | 9,943 | 436 | 5% | $21.76 | $45,260.80 |
| 49-1011 | First-Line Supervisors of Mechanics, Installers, and Repairers | 7,281 | 7,657 | 376 | 5% | $31.44 | $65,395.20 |
Source: EMSI 2019.4
Information & Financial Services
There were 164,236 jobs in the Information & Financial Services Industry Cluster in 2019 with average wages of $68,805. Growth in the Industry Cluster is projected to increase by 10,496 jobs by 2024, a total of 174,732 jobs in Oklahoma.
Information & Financial Services
The following Industries are the top 10 in terms of total number of jobs in 2019.
| NAICS | Description | 2019 Jobs | 2024 Jobs | 2019 - 2024 Change | 2019 - 2024 % Change | Avg. Earnings Per Job |
|---|---|---|---|---|---|---|
| 55111 | Management of Companies and Enterprises | 24,781 | 27,479 | 2,698 | 11% | $107,570 |
| 54121 | Accounting, Tax Preparation, Bookkeeping, and Payroll Services | 20,846 | 22,748 | 1,902 | 9% | $64,582 |
| 52211 | Commercial Banking | 20,722 | 20,516 | (206) | (1%) | $69,908 |
| 52392 | Portfolio Management | 12,714 | 15,089 | 2,375 | 19% | $36,859 |
| 54151 | Computer Systems Design and Related Services | 12,571 | 13,868 | 1,297 | 10% | $76,389 |
| 51731 | Wired and Wireless Telecommunications Carriers | 8,822 | 7,551 | (1,271) | (14%) | $79,523 |
| 52391 | Miscellaneous Intermediation | 8,024 | 8,673 | 649 | 8% | $37,913 |
| 52393 | Investment Advice | 6,281 | 6,983 | 702 | 11% | $41,300 |
| 52229 | Other Nondepository Credit Intermediation | 6,190 | 6,842 | 652 | 11% | $54,466 |
| 52592 | Trusts, Estates, and Agency Accounts | 5,983 | 7,007 | 1,024 | 17% | $43,418 |
Source: EMSI 2019.4
Information & Financial Services
The following Occupations are the top 10 in terms of total number of jobs in 2019.
| SOC | Description | 2019 Jobs | Median Hourly Earnings | Median Annual Earnings | Typical Entry Level Education | Work Experience Required | Typical On-The-Job Training |
|---|---|---|---|---|---|---|---|
| 43-4051 | Customer Service Representatives | 30,169 | $14.62 | $30,409.60 | High school diploma or equivalent | None | Short-term on-the-job training |
| 11-1021 | General and Operations Managers | 27,027 | $39.51 | $82,180.80 | Bachelor's degree | 5 years or more | None |
| 13-2011 | Accountants and Auditors | 14,301 | $31.27 | $65,041.60 | Bachelor's degree | None | None |
| 43-4171 | Receptionists and Information Clerks | 9,379 | $13.23 | $27,518.40 | High school diploma or equivalent | None | Short-term on-the-job training |
| 41-3021 | Insurance Sales Agents | 9,060 | $22.08 | $45,926.40 | High school diploma or equivalent | None | Moderate-term on-the-job training |
| 43-3071 | Tellers | 6,845 | $12.08 | $25,126.40 | High school diploma or equivalent | None | Short-term on-the-job training |
| 11-3031 | Financial Managers | 6,550 | $46.43 | $96,574.40 | Bachelor's degree | 5 years or more | None |
| 13-1111 | Management Analysts | 4,796 | $35.97 | $74,817.60 | Bachelor's degree | Less than 5 years | None |
| 15-1132 | Software Developers, Applications | 4,560 | $40.82 | $84,905.60 | Bachelor's degree | None | None |
| 13-2072 | Loan Officers | 3,964 | $29.44 | $61,235.20 | Bachelor's degree | None | Moderate-term on-the-job training |
Source: EMSI 2019.4
Information & Financial Services
The following are the Top 10 emerging industries in terms of number of new jobs in 2024.
| NAICS | Description | 2019 Jobs | 2024 Jobs | 2019 - 2024 Change | 2019 - 2024 % Change | Avg. Earnings Per Job |
|---|---|---|---|---|---|---|
| 55111 | Management of Companies and Enterprises | 24,781 | 27,479 | 2,698 | 11% | $107,570 |
| 52392 | Portfolio Management | 12,714 | 15,089 | 2,375 | 19% | $36,859 |
| 54121 | Accounting, Tax Preparation, Bookkeeping, and Payroll Services | 20,846 | 22,748 | 1,902 | 9% | $64,582 |
| 54151 | Computer Systems Design and Related Services | 12,571 | 13,868 | 1,297 | 10% | $76,389 |
| 52592 | Trusts, Estates, and Agency Accounts | 5,983 | 7,007 | 1,024 | 17% | $43,418 |
| 52393 | Investment Advice | 6,281 | 6,983 | 702 | 11% | $41,300 |
| 52229 | Other Nondepository Credit Intermediation | 6,190 | 6,842 | 652 | 11% | $54,466 |
| 52391 | Miscellaneous Intermediation | 8,024 | 8,673 | 649 | 8% | $37,913 |
| 52399 | All Other Financial Investment Activities | 3,639 | 3,857 | 218 | 6% | $37,303 |
| 52213 | Credit Unions | 3,552 | 3,746 | 194 | 5% | $51,033 |
Source: EMSI 2019.4
Information & Financial Services
The following are the Top 10 emerging occupations in terms of number of new jobs in 2024.
| SOC | Description | 2019 Jobs | 2024 Jobs | 2019 - 2024 Change | 2019 - 2024 % Change | Median Hourly Earnings | Median Annual Earnings |
|---|---|---|---|---|---|---|---|
| 11-1021 | General and Operations Managers | 27,027 | 28,765 | 1,738 | 6% | $39.51 | $82,180.80 |
| 13-2011 | Accountants and Auditors | 14,301 | 15,622 | 1,321 | 9% | $31.27 | $65,041.60 |
| 15-1132 | Software Developers, Applications | 4,560 | 5,292 | 732 | 16% | $40.82 | $84,905.60 |
| 11-3031 | Financial Managers | 6,550 | 7,261 | 711 | 11% | $46.43 | $96,574.40 |
| 41-3021 | Insurance Sales Agents | 9,060 | 9,719 | 659 | 7% | $22.08 | $45,926.40 |
| 43-4171 | Receptionists and Information Clerks | 9,379 | 9,942 | 563 | 6% | $13.23 | $27,518.40 |
| 13-1111 | Management Analysts | 4,796 | 5,213 | 417 | 9% | $35.97 | $74,817.60 |
| 43-4051 | Customer Service Representatives | 30,169 | 30,459 | 290 | 1% | $14.62 | $30,409.60 |
| 15-1133 | Software Developers, Systems Software | 1,825 | 2,106 | 281 | 15% | $42.14 | $87,651.20 |
| 15-1121 | Computer Systems Analysts | 3,397 | 3,627 | 230 | 7% | $37.57 | $78,145.60 |
Source: EMSI 2019.4
Transportation & Distribution
In 2019 there were 135,225 jobs in the Transportation & Distribution Industry Cluster with average earnings of $68,667. Based on demand projections jobs within the Industry Cluster will increase by 7,837 jobs totaling 143,091 jobs by the year 2024.
Transportation & Distribution
The following Industries are the top 10 in terms of total number of jobs in 2019.
| NAICS | Description | 2019 Jobs | 2024 Jobs | 2019 - 2024 Change | 2019 - 2024 % Change | Avg. Earnings Per Job |
|---|---|---|---|---|---|---|
| 48412 | General Freight Trucking, Long-Distance | 16,491 | 16,789 | 298 | 2% | $64,511 |
| 49311 | General Warehousing and Storage | 12,950 | 16,181 | 3,231 | 25% | $41,057 |
| 42512 | Wholesale Trade Agents and Brokers | 7,564 | 8,400 | 836 | 11% | $60,862 |
| 42383 | Industrial Machinery and Equipment Merchant Wholesalers | 6,733 | 7,114 | 381 | 6% | $83,603 |
| 32621 | Tire Manufacturing | 4,411 | 3,986 | (425) | (10%) | $83,831 |
| 48422 | Specialized Freight (except Used Goods) Trucking, Local | 4,099 | 4,449 | 350 | 9% | $70,289 |
| 48411 | General Freight Trucking, Local | 3,868 | 3,628 | (240) | (6%) | $66,253 |
| 48819 | Other Support Activities for Air Transportation | 3,715 | 3,925 | 210 | 6% | $82,047 |
| 33621 | Motor Vehicle Body and Trailer Manufacturing | 3,123 | 3,297 | 174 | 6% | $47,726 |
| 48423 | Specialized Freight (except Used Goods) Trucking, Long-Distance | 2,867 | 3,278 | 411 | 14% | $89,560 |
Source: EMSI 2019.4
Transportation & Distribution
The following Occupations are the top 10 in terms of total number of jobs in 2019.
| SOC | Description | 2019 Jobs | Median Hourly Earnings | Median Annual Earnings | Typical Entry Level Education | Work Experience Required | Typical On-The-Job Training |
|---|---|---|---|---|---|---|---|
| 43-6014 | Secretaries and Administrative Assistants, Except Legal, Medical, and Executive | 32,439 | $14.71 | $30,596.80 | High school diploma or equivalent | None | Short-term on-the-job training |
| 53-7062 | Laborers and Freight, Stock, and Material Movers, Hand | 30,682 | $13.49 | $28,059.20 | No formal educational credential | None | Short-term on-the-job training |
| 43-4051 | Customer Service Representatives | 30,169 | $14.62 | $30,409.60 | High school diploma or equivalent | None | Short-term on-the-job training |
| 43-9061 | Office Clerks, General | 30,091 | $12.96 | $26,956.80 | High school diploma or equivalent | None | Short-term on-the-job training |
| 11-1021 | General and Operations Managers | 27,027 | $39.51 | $82,180.80 | Bachelor's degree | 5 years or more | None |
| 53-3032 | Heavy and Tractor-Trailer Truck Drivers | 26,746 | $20.07 | $41,745.60 | Postsecondary nondegree award | None | Short-term on-the-job training |
| 43-3031 | Bookkeeping, Accounting, and Auditing Clerks | 23,261 | $17.88 | $37,190.40 | Some college, no degree | None | Moderate-term on-the-job training |
| 43-5081 | Stock Clerks and Order Fillers | 20,683 | $11.55 | $24,024.00 | High school diploma or equivalent | None | Short-term on-the-job training |
| 13-2011 | Accountants and Auditors | 14,301 | $31.27 | $65,041.60 | Bachelor's degree | None | None |
| 41-4012 | Sales Representatives, Wholesale and Manufacturing, Except Technical and Scientific Products | 9,742 | $22.98 | $47,798.40 | High school diploma or equivalent | None | Moderate-term on-the-job training |
Source: EMSI 2019.4
Transportation & Distribution
The following are the Top 10 emerging industries in terms of number of new jobs in 2024.
| NAICS | Description | 2019 Jobs | 2024 Jobs | 2019 - 2024 Change | 2019 - 2024 % Change | Avg. Earnings Per Job |
|---|---|---|---|---|---|---|
| 49311 | General Warehousing and Storage | 12,950 | 16,181 | 3,231 | 25% | $41,057 |
| 42512 | Wholesale Trade Agents and Brokers | 7,564 | 8,400 | 836 | 11% | $60,862 |
| 48423 | Specialized Freight (except Used Goods) Trucking, Long-Distance | 2,867 | 3,278 | 411 | 14% | $89,560 |
| 42383 | Industrial Machinery and Equipment Merchant Wholesalers | 6,733 | 7,114 | 381 | 6% | $83,603 |
| 48422 | Specialized Freight (except Used Goods) Trucking, Local | 4,099 | 4,449 | 350 | 9% | $70,289 |
| 48412 | General Freight Trucking, Long-Distance | 16,491 | 16,789 | 298 | 2% | $64,511 |
| 42311 | Automobile and Other Motor Vehicle Merchant Wholesalers | 1,604 | 1,877 | 273 | 17% | $77,576 |
| 42481 | Beer and Ale Merchant Wholesalers | 1,472 | 1,743 | 271 | 18% | $56,893 |
| 42351 | Metal Service Centers and Other Metal Merchant Wholesalers | 2,470 | 2,705 | 235 | 10% | $74,459 |
| 48851 | Freight Transportation Arrangement | 1,557 | 1,779 | 222 | 14% | $49,259 |
Source: EMSI 2019.4
Transportation & Distribution
The following are the Top 10 emerging occupations in terms of number of new jobs in 2024.
| SOC | Description | 2019 Jobs | 2024 Jobs | 2019 - 2024 Change | 2019 - 2024 % Change | Median Hourly Earnings | Median Annual Earnings |
|---|---|---|---|---|---|---|---|
| 53-7062 | Laborers and Freight, Stock, and Material Movers, Hand | 30,682 | 33,034 | 2,352 | 8% | $13.49 | $28,059.20 |
| 53-3032 | Heavy and Tractor-Trailer Truck Drivers | 26,746 | 28,909 | 2,163 | 8% | $20.07 | $41,745.60 |
| 11-1021 | General and Operations Managers | 27,027 | 28,765 | 1,738 | 6% | $39.51 | $82,180.80 |
| 13-2011 | Accountants and Auditors | 14,301 | 15,622 | 1,321 | 9% | $31.27 | $65,041.60 |
| 41-4012 | Sales Representatives, Wholesale and Manufacturing, Except Technical and Scientific Products | 9,742 | 10,604 | 862 | 9% | $22.98 | $47,798.40 |
| 15-1132 | Software Developers, Applications | 4,560 | 5,292 | 732 | 16% | $40.82 | $84,905.60 |
| 53-7051 | Industrial Truck and Tractor Operators | 7,209 | 7,932 | 723 | 10% | $16.57 | $34,465.60 |
| 43-5081 | Stock Clerks and Order Fillers | 20,683 | 21,380 | 697 | 3% | $11.55 | $24,024.00 |
| 13-1199 | Business Operations Specialists, All Other | 5,244 | 5,902 | 658 | 13% | $34.19 | $71,115.20 |
| 13-1161 | Market Research Analysts and Marketing Specialists | 5,088 | 5,737 | 649 | 13% | $25.72 | $53,497.60 |
Source: EMSI 2019.4
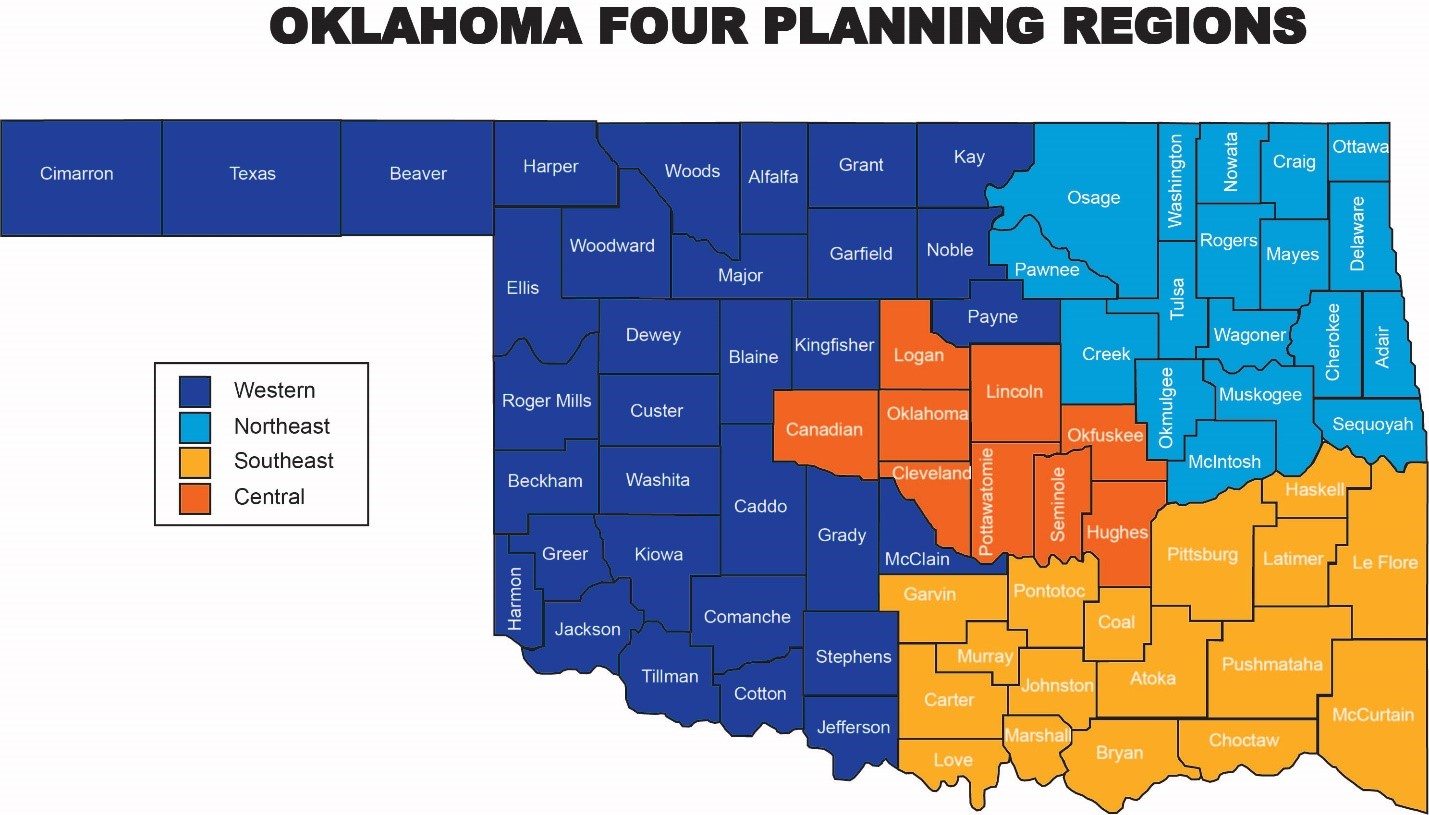
Planning Region Industry Clusters
Per federal regulations, Oklahoma has established four separate planning regions consisting of counties based on geographic location and competitive advantage due to demand industries. Planning regions are named based on their geographic position in the state: Central, Northeast, Southeast and Western. The Oklahoma Department of Commerce identified demand Industry Clusters and the regional and local levels. There are also occupations and industries that have a significant footprint in terms of growth and employment. These jobs are not always included in the industry clusters as they offer low wages and require little training.
| Planning Region | Workforce Development Area | Regional Industry Clusters |
|---|---|---|
| Northeast | Northeast | Industrial Transportation & Distribution Mining & Extraction STEM Healthcare |
| Northeast | Eastern | Industrial Transportation & Distribution Utilities Generation, Transmission & Energy Pipelines Professional Services Healthcare STEM |
| Northeast | Tulsa | Industrial Transportation & Distribution Mining & Extraction Professional Services Healthcare STEM |
| Western | Western | Industrial Transportation & Distribution Mining & Extraction Professional Services Healthcare STEM |
| Western | South Central | Industrial Transportation & Distribution Mining & Extraction Professional Services Healthcare STEM |
| Southeast | Southern | Industrial Transportation & Distribution Mining & Extraction Professional Services Healthcare STEM |
| Central | Central | Industrial Transportation & Distribution Mining & Extraction Professional Services Healthcare STEM |
Source: Oklahoma Department of Commerce, December 2019
The Northeast Planning Region
The Northeast Oklahoma Planning Region is made up of the following 18 counties: Adair, Cherokee, Craig, Creek, Delaware, Mayes, McIntosh, Muskogee, Nowata, Okmulgee, Osage, Ottawa, Pawnee, Rogers, Sequoyah, Tulsa, Wagoner and Washington. This area varies from being densely populated in and around Tulsa, to more rural in the north and east. Three Workforce Development Areas are represented in the Northeast Planning Region: Northeast, Eastern, and Tulsa. Regional Industry Clusters in this area include Industrial, Transportation & Distribution, Utilities Generation, Transmission & Energy Pipelines, Professional Services, Healthcare, Mining & Extraction, and STEM.
The Central Planning Region
The Central Oklahoma Planning Region is made up of nine counties: Canadian, Cleveland, Hughes, Lincoln, Logan, Okfuskee, Oklahoma, Pottawatomie, and Seminole. One Workforce Development Area represents the Central Planning Region: Central. Regional Industry Clusters in this area include: Industrial, Transportation & Distribution, Mining & Extraction, Professional Services, Healthcare, and STEM.
The Western Planning Region
The Western planning region is comprised of thirty-three counties in the western half of the state, nearly all of them are west of I-35. The Western Planning Region is the largest of the four and encompasses the remaining 33 counties in Oklahoma: Alfalfa, Beaver, Beckham, Blaine, Caddo, Cimarron, Comanche, Cotton, Custer, Dewey, Ellis, Garfield, Grady, Grant, Greer, Harmon, Harper, Jackson, Jefferson, Kay, Kingfisher, Kiowa, Major, McClain, Noble, Payne, Roger Mills, Stephens, Texas, Tillman, Washita, Woods, and Woodward. Two Workforce Development Areas represent the Western Planning Region: Western and South Central. Regional Industry Clusters in this area include: Industrial, Transportation & Distribution, Mining & Extraction, Professional Services, Healthcare, and STEM.
The Southeast Planning Region
The Southeast planning region is comprised of seventeen counties in southeast Oklahoma, primarily south of I-40 and either on or east of I-35. The Southeast Planning Region consists of the following counties: Atoka, Bryan, Carter, Choctaw, Coal, Garvin, Haskell, Johnston, Latimer, Le Flore, Love, Marshall, McCurtain, Murray, Pittsburg, Pontotoc, and Pushmataha. One Workforce Development Area represents the Southeast Planning Region: Southern. Regional Industry Clusters in this area include: Industrial, Transportation & Distribution, Mining & Extraction, Professional Services, Healthcare, and STEM.
Strategy
The Oklahoma Works initiative strives to ensure that existing and new businesses in the state are successful and that Oklahoma residents have the ability to obtain work in occupations that generate family sustaining wages. A large majority of the emerging occupations require nothing more than a high school diploma or the equivalent. However, this level of education and skills attainment will not allow Oklahomans or Oklahoma’s economy to grow and thrive. The occupations within the emerging industries must be analyzed and targeted strategically to ensure Oklahoma has the right talent to attract new and expand existing businesses.
There are 18 emerging industries that cover each of the four planning regions as well as the state as a whole, within those 18 industries there are several occupations with highly projected growth. By analyzing occupations that require at least a postsecondary non-degree award and choosing to focus our efforts on careers requiring that level of education at a minimum, Oklahoma can expect more than 472,330 jobs by 2020 with average hourly wages of $29.33 which equates to average annual earnings of just over $61,000.
Employers Employment Needs
This section will describe the employment needs of employer’s in Oklahoma. The state is determined to focus our efforts and partnerships on providing the services necessary to ensure that Oklahomans have the knowledge, skills and abilities needed to obtain employment in high-wage occupations within the established emerging industries.
Across the 5 State Industry Clusters, there are 33 emerging occupations. Some of the occupations are categorized under more than one Industry Cluster. Eleven of the emerging occupations require a Bachelor’s Degree, sixteen require a High School Diploma or Equivalent, and one requires Postsecondary nondegree award. The remaining occupations do not require formal education and require on-the-job-training.
| SOC | Description | 2019 Jobs | 2024 Jobs | 2019 - 2024 % Change | Typical Entry Level Education | Work Experience Required | Typical On-The-Job Training | Regional Completions (2018) |
|---|---|---|---|---|---|---|---|---|
| 53-7062 | Laborers and Freight, Stock, and Material Movers, Hand | 30,682 | 33,034 | 8% | No formal educational credential | None | Short-term on-the-job training | 0 |
| 43-9061 | Office Clerks, General | 30,091 | 30,616 | 2% | High school diploma or equivalent | None | Short-term on-the-job training | 13 |
| 43-4051 | Customer Service Representatives | 30,169 | 30,459 | 1% | High school diploma or equivalent | None | Short-term on-the-job training | 9 |
| 53-3032 | Heavy and Tractor-Trailer Truck Drivers | 26,746 | 28,909 | 8% | Postsecondary nondegree award | None | Short-term on-the-job training | 370 |
| 11-1021 | General and Operations Managers | 27,027 | 28,765 | 6% | Bachelor's degree | 5 years or more | None | 3,890 |
| 43-5081 | Stock Clerks and Order Fillers | 20,683 | 21,380 | 3% | High school diploma or equivalent | None | Short-term on-the-job training | 0 |
| 49-9071 | Maintenance and Repair Workers, General | 17,258 | 18,304 | 6% | High school diploma or equivalent | None | Moderate-term on-the-job training | 126 |
| 13-2011 | Accountants and Auditors | 14,301 | 15,622 | 9% | Bachelor's degree | None | None | 1,009 |
| 47-1011 | First-Line Supervisors of Construction Trades and Extraction Workers | 10,037 | 11,113 | 11% | High school diploma or equivalent | 5 years or more | None | 844 |
| 41-4012 | Sales Representatives, Wholesale and Manufacturing, Except Technical and Scientific Products | 9,742 | 10,604 | 9% | High school diploma or equivalent | None | Moderate-term on-the-job training | 76 |
| 41-3099 | Sales Representatives, Services, All Other | 9,507 | 9,943 | 5% | High school diploma or equivalent | None | Moderate-term on-the-job training | 66 |
| 43-4171 | Receptionists and Information Clerks | 9,379 | 9,942 | 6% | High school diploma or equivalent | None | Short-term on-the-job training | 13 |
| 51-1011 | First-Line Supervisors of Production and Operating Workers | 9,375 | 9,846 | 5% | High school diploma or equivalent | Less than 5 years | None | 39 |
| 41-3021 | Insurance Sales Agents | 9,060 | 9,719 | 7% | High school diploma or equivalent | None | Moderate-term on-the-job training | 6 |
| 37-3011 | Landscaping and Groundskeeping Workers | 8,222 | 8,727 | 6% | No formal educational credential | None | Short-term on-the-job training | 3 |
| 53-7051 | Industrial Truck and Tractor Operators | 7,209 | 7,932 | 10% | No formal educational credential | None | Short-term on-the-job training | 0 |
| 49-1011 | First-Line Supervisors of Mechanics, Installers, and Repairers | 7,281 | 7,657 | 5% | High school diploma or equivalent | Less than 5 years | None | 41 |
| 47-2073 | Operating Engineers and Other Construction Equipment Operators | 6,713 | 7,528 | 12% | High school diploma or equivalent | None | Moderate-term on-the-job training | 93 |
| 11-3031 | Financial Managers | 6,550 | 7,261 | 11% | Bachelor's degree | 5 years or more | None | 741 |
| 43-5061 | Production, Planning, and Expediting Clerks | 6,493 | 6,866 | 6% | High school diploma or equivalent | None | Moderate-term on-the-job training | 0 |
| 47-5071 | Roustabouts, Oil and Gas | 5,774 | 6,629 | 15% | No formal educational credential | None | Moderate-term on-the-job training | 0 |
| 13-1199 | Business Operations Specialists, All Other | 5,244 | 5,902 | 13% | Bachelor's degree | None | None | 76 |
| 51-4041 | Machinists | 5,331 | 5,791 | 9% | High school diploma or equivalent | None | Long-term on-the-job training | 125 |
| 13-1161 | Market Research Analysts and Marketing Specialists | 5,088 | 5,737 | 13% | Bachelor's degree | None | None | 761 |
| 15-1132 | Software Developers, Applications | 4,560 | 5,292 | 16% | Bachelor's degree | None | None | 697 |
| 13-1111 | Management Analysts | 4,796 | 5,213 | 9% | Bachelor's degree | Less than 5 years | None | 3,698 |
| 15-1121 | Computer Systems Analysts | 3,397 | 3,627 | 7% | Bachelor's degree | None | None | 933 |
| 47-5013 | Service Unit Operators, Oil, Gas, and Mining | 2,962 | 3,578 | 21% | No formal educational credential | None | Moderate-term on-the-job training | 0 |
| 51-4011 | Computer-Controlled Machine Tool Operators, Metal and Plastic | 3,280 | 3,575 | 9% | High school diploma or equivalent | None | Moderate-term on-the-job training | 132 |
| 17-2141 | Mechanical Engineers | 2,939 | 3,303 | 12% | Bachelor's degree | None | None | 630 |
| 51-2011 | Aircraft Structure, Surfaces, Rigging, and Systems Assemblers | 2,367 | 2,855 | 21% | High school diploma or equivalent | None | Moderate-term on-the-job training | 194 |
| 17-2112 | Industrial Engineers | 1,756 | 2,164 | 23% | Bachelor's degree | None | None | 212 |
| 15-1133 | Software Developers, Systems Software | 1,825 | 2,106 | 15% | Bachelor's degree | None | None | 720 |