Located in:
- II. Strategic Elements
The Unified or Combined State Plan must include a Strategic Planning Elements section that analyzes the State’s current economic environment and identifies the State’s overall vision for its workforce development system. The required elements in this section allow the State to develop data-driven goals for preparing an educated and skilled workforce and to identify successful strategies for aligning workforce development programs to support economic growth. Unless otherwise noted, all Strategic Planning Elements apply to Combined State Plan partner programs included in the plan as well as to core programs.
- a. Economic, Workforce, and Workforce Development Activities Analysis
The Unified or Combined State Plan must include an analysis of the economic conditions, economic development strategies, and labor market in which the State’s workforce system and programs will operate.
- a. Economic, Workforce, and Workforce Development Activities Analysis
II. a. 1. B. Workforce Analysis
The Unified or Combined State Plan must include an analysis of the current workforce, including individuals with barriers to employment, as defined in section 3 of WIOA4. This population must include individuals with disabilities among other groups5 in the State and across regions identified by the State. This includes—
[4] Individuals with barriers to employment include displaced homemakers; low-income individuals; Indians, Alaska Natives, and Native Hawaiians; individuals with disabilities, including youth who are individuals with disabilities; older individuals; ex-offenders; homeless individuals, or homeless children and youths; youth who are in or have aged out of the foster care system; individuals who are English language learners, individuals who have low levels of literacy, and individuals facing substantial cultural barriers; farmworkers (as defined at section 167(i) of WIOA and Training and Employment Guidance Letter No. 35-14); individuals within 2 years of exhausting lifetime eligibility under the Temporary Assistance for Needy Families program; single parents (including single pregnant women); and long-term unemployed individuals.
[5] Veterans, unemployed workers, and youth, and others that the State may identify.
i. Employment and Unemployment
Provide an analysis of current employment and unemployment data, including labor force participation rates, and trends in the State.
ii. Labor Market Trends
Provide an analysis of key labor market trends, including across existing industries and occupations.
iii. Education and Skill Levels of the Workforce
Provide an analysis of the educational and skill levels of the workforce.
iv. Skill Gaps
Describe apparent ‘skill gaps’.
Current Narrative:
Oklahoma’s Changing Population
| Race/Ethnicity | 2019 Population | 2024 Population | Change | % Change |
|---|---|---|---|---|
| White, Non-Hispanic | 2,574,390 | 2,557,952 | -16,438 | -1% |
| White, Hispanic | 357,390 | 391,141 | 33,751 | 9% |
| American Indian or Alaskan Native, Non-Hispanic | 330,747 | 338,009 | 7,262 | 2% |
| Black, Non-Hispanic | 294,968 | 301,000 | 6,032 | 2% |
| Two or More Races, Non-Hispanic | 224,783 | 240,227 | 15,444 | 7% |
| Asian, Non-Hispanic | 91,934 | 99,575 | 7,641 | 8% |
| American Indian or Alaskan Native, Hispanic | 40,190 | 44,494 | 4,304 | 11% |
| Two or More Races, Hispanic | 24,504 | 27,508 | 3,004 | 12% |
| Black, Hispanic | 14,427 | 15,830 | 1,403 | 10% |
| Native Hawaiian or Pacific Islander, Non-Hispanic | 6,278 | 6,966 | 688 | 11% |
| Asian, Hispanic | 2,946 | 3,228 | 282 | 10% |
| Native Hawaiian or Pacific Islander, Hispanic | 1,497 | 1,602 | 105 | 7% |
| Total | 3,964,054 | 4,027,533 | 63,479 | 2% |
Source: EMSI 2019.4
| Gender | 2019 Population | 2024 Population | Change | % Change |
|---|---|---|---|---|
| Females | 2,000,387 | 2,032,084 | 31,697 | 2% |
| Males | 1,963,668 | 1,995,449 | 31,781 | 2% |
| Total | 3,964,054 | 4,027,533 | 63,479 | 2% |
Source: EMSI 2019.4
In the 5-year projections beginning in 2019 and ending in 2024 the ethnicity with the highest percentage growth is Two or More Races, Hispanic growing by 12%, from 24,504 to 27,508, and in terms of total population growth it is White, Hispanic with a population increase of 33,751.
The second highest percentage growth is a tie of American Indian or Alaskan Native, Hispanic and Native Hawaiian or Pacific Islander, Non-Hispanic both at an expected growth rate of 11%, and in total population growth it is Two or More Races, Non-Hispanic with a population increase of 15,444.
For the entire population of Oklahoma the group most represented is White, Non-Hispanic with a population of 2,574,390 and an expected decline in growth of -16,438 in 2024. The next largest population is White, Hispanic with a current population of 357,390 and expected growth of 33,751.
Oklahoma’s population is currently at 3,964,054, and there is expected increase to 4,027,533 in 2024, this is an increase of 63,479 or 1.6%.
| Timeframe | Population |
|---|---|
| 2014 | 3,878,345 |
| 2015 | 3,909,811 |
| 2016 | 3,926,760 |
| 2017 | 3,932,640 |
| 2018 | 3,943,078 |
| 2019 | 3,964,054 |
| 2020 | 3,979,071 |
| 2021 | 3,992,835 |
| 2022 | 4,005,454 |
| 2023 | 4,016,999 |
| 2024 | 4,027,533 |
Source: EMSI 2019.4
| Age Cohort | 2019 Population | 2024 Population | Change | % Change |
|---|---|---|---|---|
| Under 5 years | 263,960 | 282,480 | 18,520 | 7% |
| 5 to 9 years | 267,399 | 261,797 | -5,602 | -2% |
| 10 to 14 years | 271,538 | 269,276 | -2,262 | -1% |
| 15 to 19 years | 266,808 | 274,514 | 7,706 | 3% |
| 20 to 24 years | 270,988 | 275,562 | 4,574 | 2% |
| 25 to 29 years | 280,079 | 255,381 | -24,698 | -9% |
| 30 to 34 years | 265,362 | 281,235 | 15,873 | 6% |
| 35 to 39 years | 263,846 | 259,829 | -4,017 | -2% |
| 40 to 44 years | 232,674 | 260,468 | 27,794 | 12% |
| 45 to 49 years | 231,740 | 227,038 | -4,702 | -2% |
| 50 to 54 years | 225,011 | 226,368 | 1,357 | 1% |
| 55 to 59 years | 250,195 | 216,387 | -33,808 | -14% |
| 60 to 64 years | 241,758 | 237,000 | -4,758 | -2% |
| 65 to 69 years | 204,053 | 224,711 | 20,658 | 10% |
| 70 to 74 years | 163,125 | 179,847 | 16,722 | 10% |
| 75 to 79 years | 116,517 | 135,428 | 18,911 | 16% |
| 80 to 84 years | 76,123 | 86,111 | 9,988 | 13% |
| 85 years and over | 72,879 | 74,101 | 1,222 | 2% |
Source: EMSI 2019.4
The largest increase to an Age Cohort group in percentage terms is 75 to 79 years, with an increase of 16%, the largest gain is 40-44 age group with an increase of 27,794.
The second largest increase to an Age Cohort group in percentage terms is 80 to 84 years, with an increase of 13%, the second largest gain is to the 65-69 age group with an increase of 20,658.
The greatest lost to an Age Cohort in percentage terms was 55-59 age group with a lost -14%, there also lost the most in absolute terms.
i. Employment and Unemployment
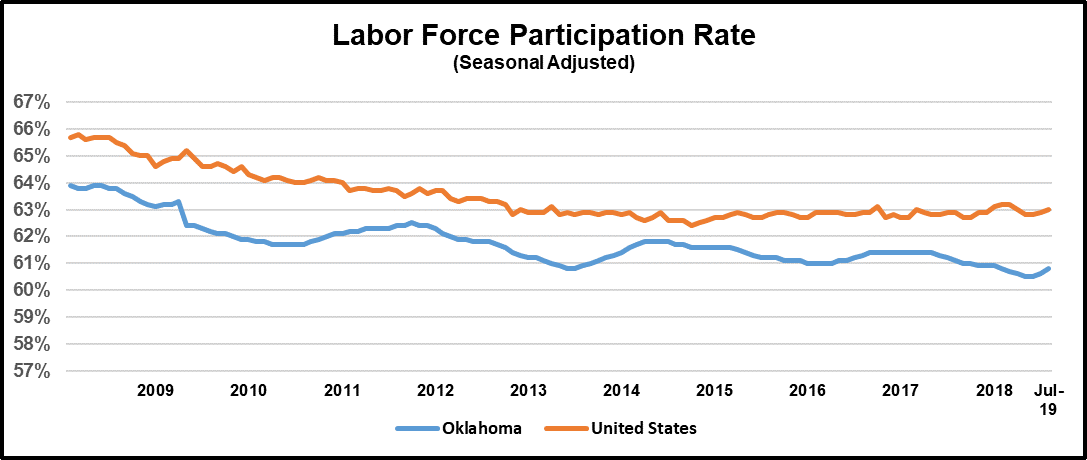
Oklahoma Labor Force Participation
Labor force participation rate has experienced little change in the last four years.
Age
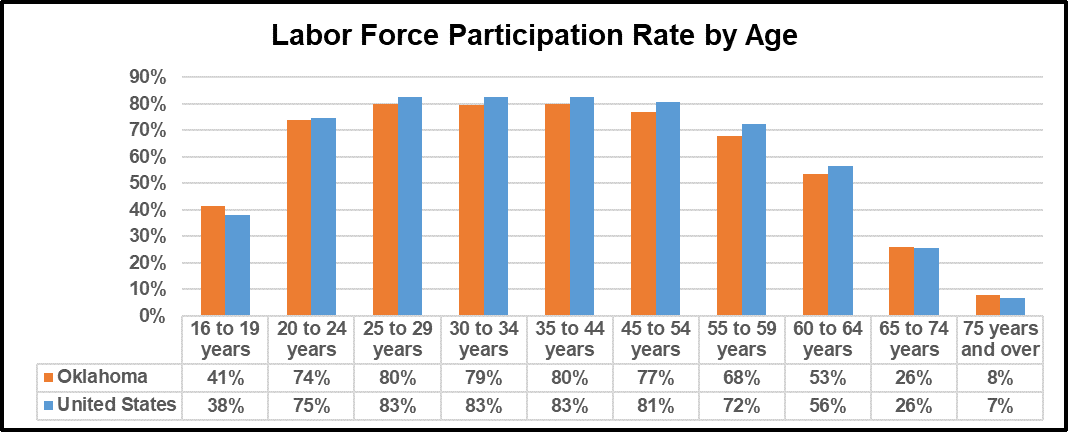
In the age groups for the traditional working age (16-64 years), the youth group had the lowest participation rate at 41% which is above the national rate of 38%. The group of with the highest labor force participation rate is 25 to 29 years and 35 to 44 years at 80% both with a higher national average of 83%.
Gender
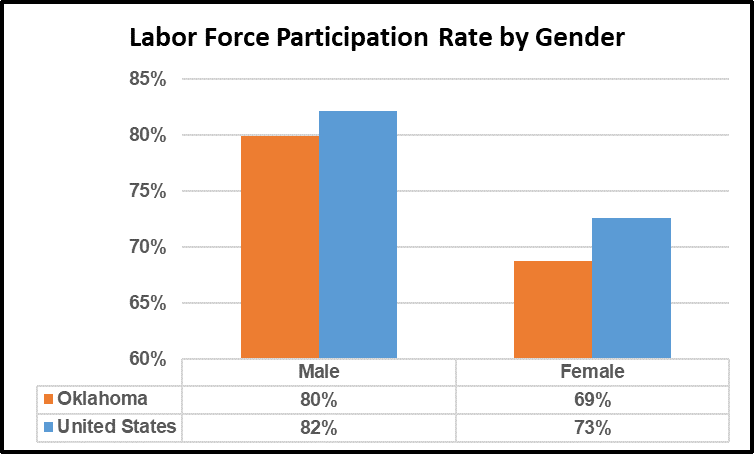
Males had higher labor force participate rate at 80% slightly lower than national average at 82%, and females had a participate rate of 69% compared to the national average of 73%
Source: American Community Survey (ACS) 2018 5 – Year estimates
Ethnicity
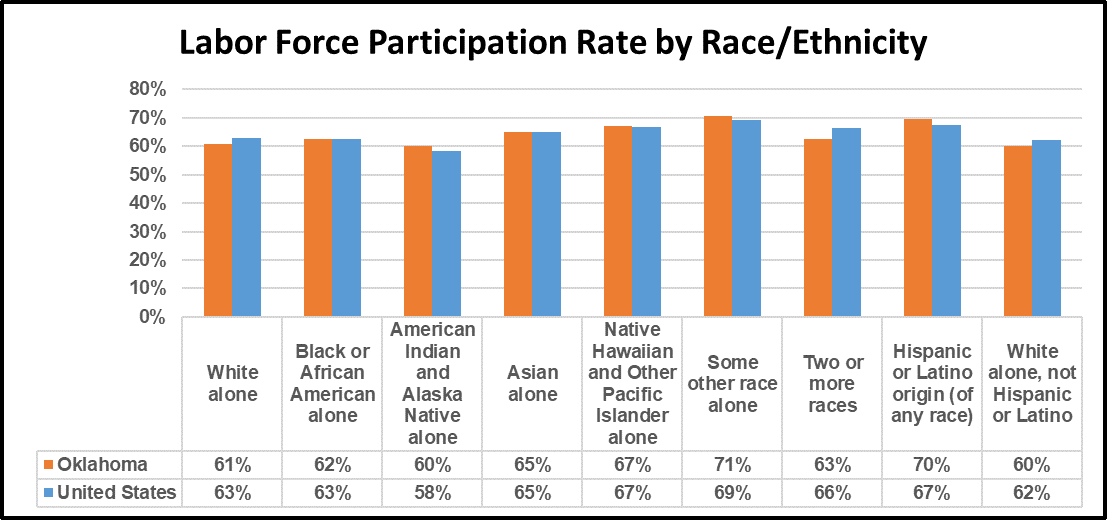
Some other race had the highest labor participation rate at 71% which higher than the national average of 69%. American Indian and Alaska Native and White had the lowest labor force participation at 60%, compared to the national average, American Indian and Alaska Native at 58% and White at 62%.
Poverty
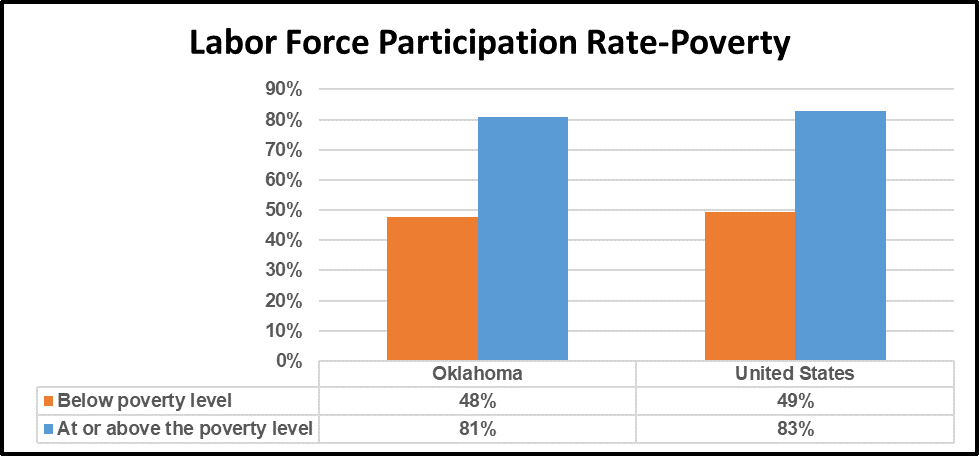
48% of those below poverty participated in the labor force, compared to the national average of 49%. Those above or at the poverty level participated in the labor force at 81% compared to the national average of 83%
Disability
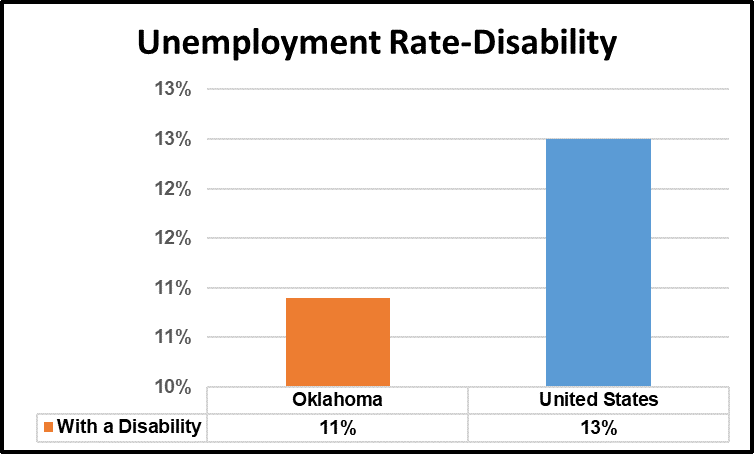
42% of disabled individuals reported participating in the labor force.
Education
Those individuals with highest unemployment rate grouped by education was less than high school graduate at 8%, with a national average of 9%. The lowest unemployment in terms of education was Bachelor’s degree or higher with 2% and a national average of 3%.
Source: American Community Survey (ACS) 2018 5 – Year estimates
ii. Labor Market Trends
Industry Sector Employment
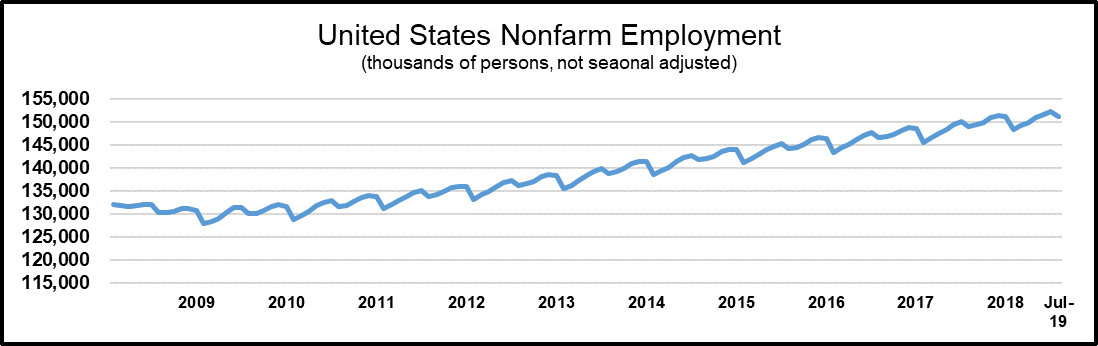
December 2018 had non-farm employment of 1,708,600. In 2018, Oklahoma’s non-farm employment gained 52,500 (3%).
Source: fred.stlouisfed.org
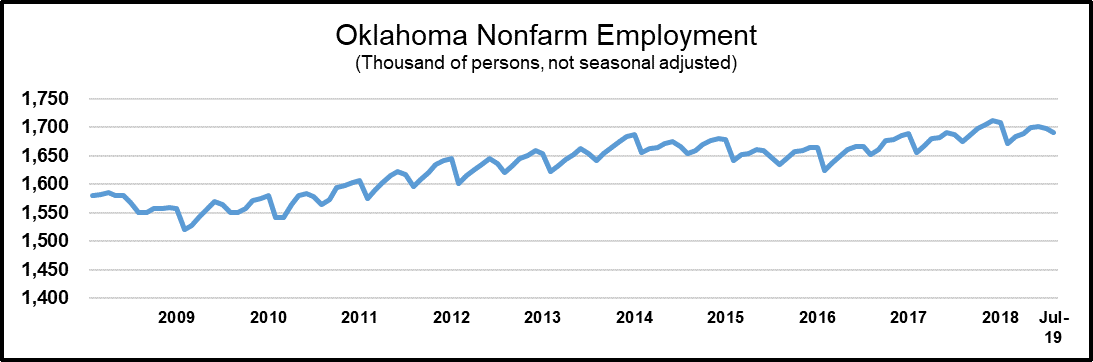 Source: fred.stlouisfed.org
Highest employment was reported in the following sectors: Government, Health Care and Social Assistance, Retail Trade, and Accommodation and Food Services.
| Occupation | Oklahoma | Oklahoma Avg. Earnings Per Job | United States | United States Earning Per Job | |
|---|---|---|---|---|---|
| 1 | Government | 362,498 | $62,088 | 24,564,335 | $77,728 |
| 2 | Health Care and Social Assistance | 202,969 | $55,991 | 20,860,311 | $60,809 |
| 3 | Retail Trade | 184,887 | $34,704 | 16,430,278 | $38,390 |
| 4 | Accommodation and Food Services | 156,762 | $19,418 | 14,109,961 | $25,124 |
| 5 | Manufacturing | 141,717 | $73,965 | 12,984,409 | $84,775 |
| 6 | Administrative and Support and Waste Management and Remediation Services | 110,375 | $41,925 | 10,227,437 | $46,889 |
| 7 | Construction | 109,018 | $56,835 | 9,245,288 | $67,364 |
| 8 | Other Services (except Public Administration) | 89,742 | $28,948 | 7,779,721 | $35,028 |
| 9 | Professional, Scientific, and Technical Services | 84,924 | $75,086 | 10,776,073 | $106,193 |
| 10 | Finance and Insurance | 62,782 | $76,310 | 6,581,239 | $125,346 |
Source: EMSI 2019.4
Government sector had 362,498 jobs and average earnings per job of $62,088. Health Care and Social Assistance accounted for 202,969 jobs with average earnings of $55,991.
iii. Education and Skill Levels of the Workforce
In the age group 18-24 years old the biggest education attainment group for Oklahoma is some college or an associate degree this is 43% of the population and with a United States average of 45%. The smallest group for this age group is bachelor degree or higher at 8% which is lower than the United States average of 11%.

The age group 25 year or older the biggest education attainment group for Oklahoma is some college no degree this is 24% of the population and with a United States average of 21%. The smallest group for this age group is less than 9th grade at 4% and a United States average of 5%.

IV. Skill Gaps
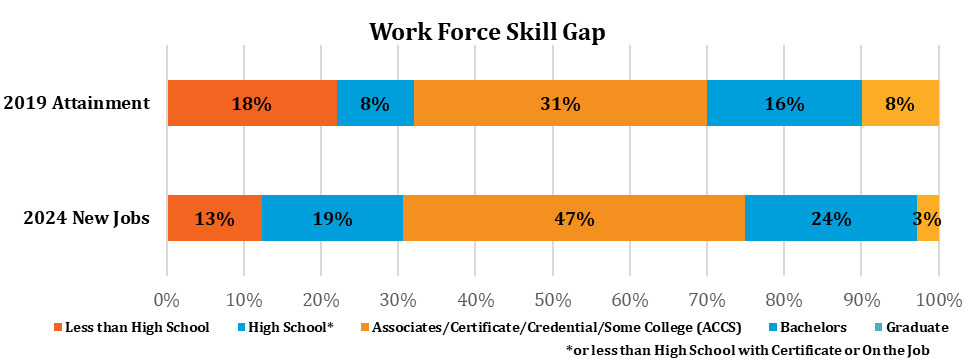
The forecast for the next 5 years for new jobs matched with level of education attainment in 2019 shows the gap of education.
The greatest need or deficiency for workers is in the group of Associates, Certificates, Some College, and Credential. The deficit is 16%, from the subtraction of 47% of new jobs in 2024, and the attainment level in 2019 of 31%.
The greatest surplus is those with a Graduate degree. This surplus is 5%, from the subtraction of 3% of new jobs, and the 8% attainment in 2019.