Located in:
- II. Strategic Elements
The Unified or Combined State Plan must include a Strategic Planning Elements section that analyzes the State’s current economic environment and identifies the State’s overall vision for its workforce development system. The required elements in this section allow the State to develop data-driven goals for preparing an educated and skilled workforce and to identify successful strategies for aligning workforce development programs to support economic growth. Unless otherwise noted, all Strategic Planning Elements apply to Combined State Plan partner programs included in the plan as well as to core programs.
- a. Economic, Workforce, and Workforce Development Activities Analysis
The Unified or Combined State Plan must include an analysis of the economic conditions, economic development strategies, and labor market in which the State’s workforce system and programs will operate.
- a. Economic, Workforce, and Workforce Development Activities Analysis
II. a. 1. B. Workforce Analysis
The Unified or Combined State Plan must include an analysis of the current workforce, including individuals with barriers to employment, as defined in section 3 of WIOA4. This population must include individuals with disabilities among other groups5 in the State and across regions identified by the State. This includes—
[4] Individuals with barriers to employment include displaced homemakers; low-income individuals; Indians, Alaska Natives, and Native Hawaiians; individuals with disabilities, including youth who are individuals with disabilities; older individuals; ex-offenders; homeless individuals, or homeless children and youths; youth who are in or have aged out of the foster care system; individuals who are English language learners, individuals who have low levels of literacy, and individuals facing substantial cultural barriers; farmworkers (as defined at section 167(i) of WIOA and Training and Employment Guidance Letter No. 35-14); individuals within 2 years of exhausting lifetime eligibility under the Temporary Assistance for Needy Families program; single parents (including single pregnant women); and long-term unemployed individuals.
[5] Veterans, unemployed workers, and youth, and others that the State may identify.
i. Employment and Unemployment
Provide an analysis of current employment and unemployment data, including labor force participation rates, and trends in the State.
ii. Labor Market Trends
Provide an analysis of key labor market trends, including across existing industries and occupations.
iii. Education and Skill Levels of the Workforce
Provide an analysis of the educational and skill levels of the workforce.
iv. Skill Gaps
Describe apparent ‘skill gaps’.
Current Narrative:
(i) Employment and Unemployment.
Employment and Unemployment. Provide an analysis of current employment and unemployment data, including labor force participation rates, and trends in the State.
Alabama was one of the last states in the nation to experience significant drops in unemployment after the2008-2009 recession. A slow recovery and shifts in the state’s economic structure kept unemployment significantly higher than the national average. While the state’s unemployment started decreasing in 2016, the national average was dropping at a much faster speed. In January of 2019 the state’s unemployment rate was nearly one half a percent lower than the national, and by the end of the year the state’s rate was in line with the national and projected to continue falling. During a majority of 2020, Alabama’s unemployment closely resembled the national average, With the lowest rate of 2.7 in February and the highest rate of 13.2 percent in March. Alabama started 2021 with 2,160,236 employed and—by the end of 2021 with 2,157,318— nearly one half of a percentage away from pre-pandemic numbers. An annual average of only 73,858 people were unemployed statewide in 2020.
Economists in the state projected job growth in 2021 to equal approximately 48,400 more jobs. As of September, the state has increased over double that amount, with an additional 46,600 and 2,194,158 wage and salary jobs. In eight consecutive months, Alabama’s job growth rate either equaled or surpassed the nation, August’s over-the-year growth at 2.3 percent while the nation was only 1.4 percent. The seasonally adjusted, preliminary unemployment number for September in Alabama was a low 66,919, equaling a 3.0 percent statewide unemployment rate. In addition, more people have entered, or reentered, the civilian labor force with the abundance of opportunities available creating a historical high of 2,261,077.
Unemployment rates for Alabama’s seven regions by the end of 2021 ranged from a low of 2.2 percent in Region 1 to a high of 3.5 percent in Region 7. November 2021 estimates show Region 7 still with the highest unemployment rate, a mere 3.0 percent, with the remaining regions experiencing even lower rates, lowest at 2.4 percent in Region 1. By the end of 2020, there were 3 counties in the state with double-digit unemployment rates. Wilcox County, which has traditionally ranked in the Top 5 in the nation for highest unemployment rates, rose to its 14.7 percent in December 2020. By September 2021, there were no counties with double-digit unemployment rates. Wilcox County decreased by almost 5 percent in less than a year.
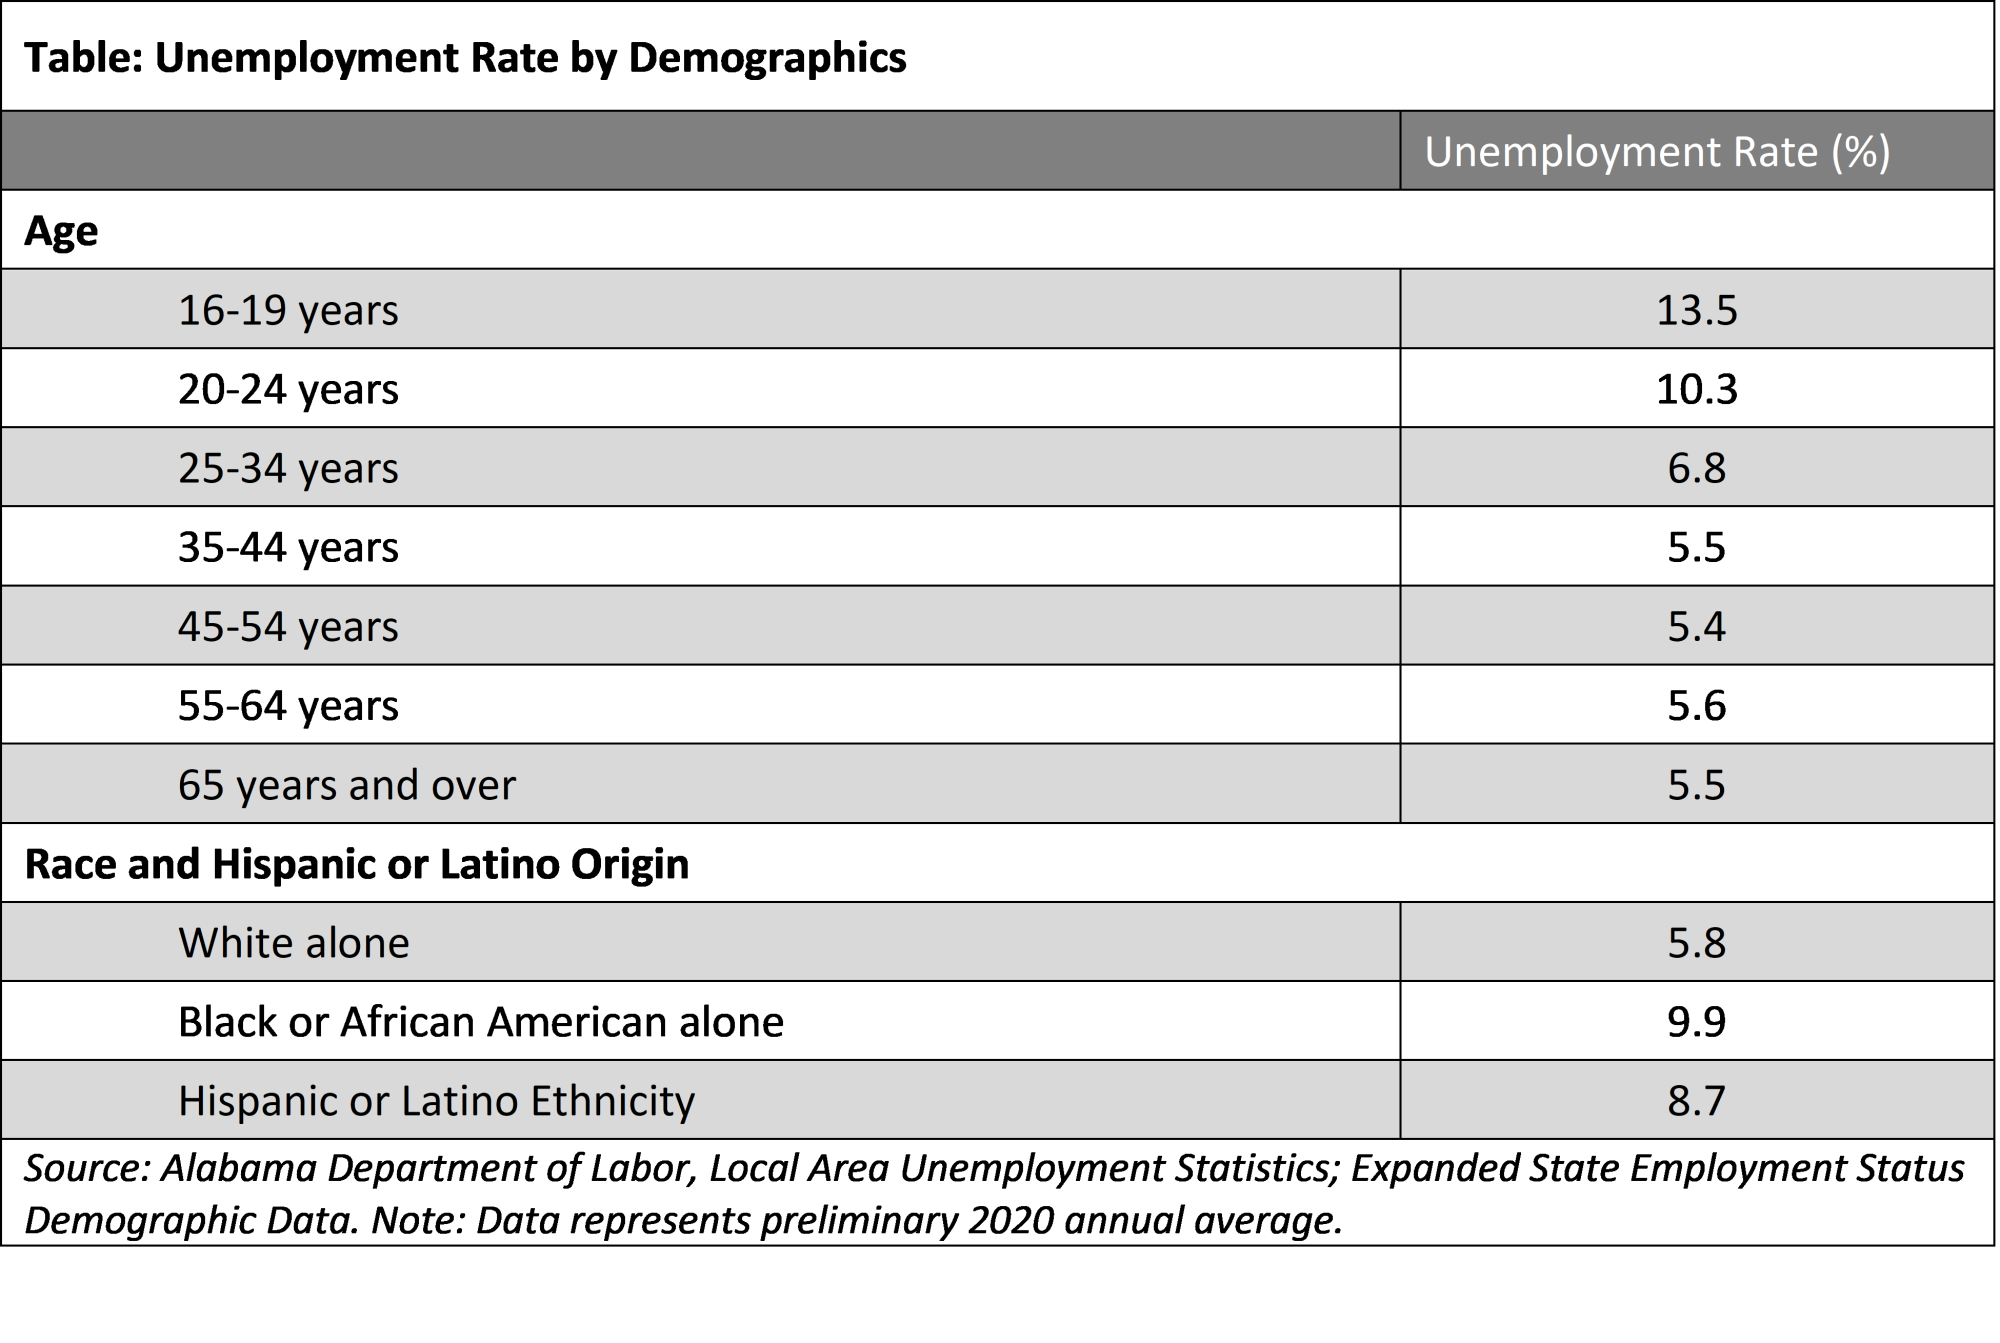
According to the Bureau of Labor Statistics, the number of employed youths aged 16-24 years old increased by 33.5 percent from April to July. Youth aged 16 to 19, experienced an estimated unemployment rate of 18.5 percent in July 2020, approximately twice as high as the July 2019 rate of 9.1 percent. Labor Force participants between the ages of 20 and 24 also experienced lower unemployment from 2020 to 2021, dropping from 10.3 percent to 6.6 percent. When examining the rates by race and sex, the unemployment rate for Black males was 4.4 percent higher than White males, as it also was for Black females compared to White females. While black males still showed the highest unemployment rate among demographic groups, it dropped from 9.9 percent in 2020 down to 6.7 percent in 2021.
Alabama’s labor force participation rate has fallen from 60.1 percent in 2009 to 57.0 percent in 2021. In December of 2021, data published by BLS indicated that Alabama had the fourth lowest labor force participation rate in the nation, at 57.0 percent, tied with New Mexico and South Carolina. There have been some improvements in labor force participation, as annual average 2019 showed a 4 percent increase in the percent of noninstitutionalized population participating in the labor force, 63.1, from 2018. While Alabama still has one of the lowest participation rates in the nation, it had the largest increase over the year of all Southeast states. The largest increases in the labor force came from White men,(approximately 26,000), and women. In addition, around 97,000 youth aged 16-19 entered the labor force over the year. Adult age groups with the largest increases in labor force participation came from age 35-44, majority being women, and age 65 and over, most of these men.
With labor market conditions nearing full employment in Alabama, meeting the Success Plus goal requires increasing Alabama’s labor force participation rate (LFPR), or the percentage of the civilian noninstitutionalized population age 16 and older who are employed or actively looking for work. As a result, Governor Ivey set a goal of surpassing the national LFPR by 2025. Due to Governor Ivey’s focus on developing a no-wrong-door approach to the public workforce system, Alabama’s LFPR increased from 56.7 percent in April 2017 when Governor Ivey assumed office to 57.7 percent on the eve of the COVID-19 pandemic in February 2020. Since 2020 and the onset of the pandemic, the LFPR fell by 1.4 percentage points.
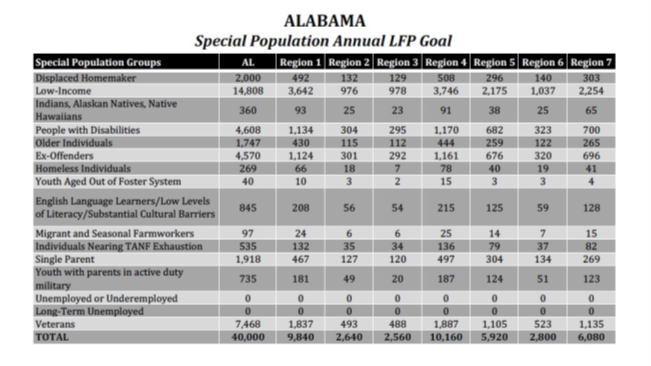
To ensure that Alabama’s postsecondary attainment and LFPR goals are reached equitably, Governor Ivey established annual statewide and regional targets for each discreet vulnerable population included in Alabama’s 2020 Combined Plan. Alabama’s theory of action is to surpass the postsecondary education attainment and LFPR goals by focusing on the Alabamians with the greatest barriers to entering education and workforce training. Determining which of the Alabamians who are not participating and are part of the shadow labor force is key necessary first step, yet this step is not sufficient. The sufficient next step is to determine the barriers preventing the shadow labor force from reentering the workforce.
Alabamians who are not in the labor force are not malingering from work. Many people face benefits cliffs when entering the workforce, which are caused when means-tested benefits taper off more quickly than an individual can compensate for through paid employment. Beyond benefits cliffs, many other demographic and social factors can shed light on LFPR in Alabama.
Nationally, and in Alabama, many young men are missing from the labor force. In January 1960, 97.1 percent of prime age men (25-54) were participating in the labor force and 42.1 percent of prime age women (25-54) were participating in the labor force. In September 2021, only 88.1 percent of prime age males are participating in the labor force and 75.3 percent of prime-age women were participating in the labor force.
The female labor participation rate in Alabama is 66.4 percent, trailing the national average by 6.2 percentage points. That’s only slightly higher than the gap for males. The male LFPR in Alabama, 76.6 percent, trails the U.S. rate by 5.6 percentage points. In fact, one subset of the female population in Alabama participates in the workforce at a higher rate than the U.S. rate. Alabama females with children under 6 are more likely to be in the workforce than similarly situated women nationwide.
In Alabama, non-Hispanic whites (ages 16 and up) have the lowest LFPR of the major racial and ethnic groups, just under 57 percent, lagging non-Hispanic whites nationally by 5.4 percentage points. African Americans in Alabama have a LFPR of just over 57 percent, lagging the U.S. rate by 5.2 percentage points. Alabama’s Hispanics have a LFPR of 67 percent, which is less than a percentage point difference from the US LFPR for Hispanics. Alabama’s rural counties have the lowest LFPRs. Meanwhile, the most urbanized and affluent of Alabama counties have the highest LFPRs.
In comparison to the same population groups in other states, older Alabamians, and Alabamians with lower levels of education are less likely to participate in the labor force. Alabamians with a disability are also less likely to participate in the workforce compared to other states. The LFPR for those groups is roughly 10 percent lower in Alabama than it is for similar individuals across the US. The gap with the US is most extreme when it comes to individuals with less than a high school education. In Alabama, only 49 percent of individuals who lack a high school diploma are working or looking for work, compared to a LFPR of 61 percent nationally for those with less than a high school education.
Older Alabamians are also disproportionately out of the workforce. The LFPR of those 60 to 64 is 10 percentage points lower in Alabama than it is in the rest of the country: 46 percent of Alabamians ages 60-64 participate in the labor force compared to 56 percent nationally. For those between 55-59, Alabama’s LFPR is 63 percent compared to 72 percent nationally. Age remains a factor in those between the ages of 45 and 54; Alabama’s rate is almost 7 percentage points lower than the US average. For those 44 and younger, the gap between the Alabama workforce participation rate is narrower, though Alabama’s rate is still 3 to 4 percentage points lower than the US rate.
The impact of Alabama’s LFPR deficit in these subgroups is amplified because Alabama’s population is older, less educated, and more disabled than the country. Alabama’s median age is 38.7 compared to 37.8 in the US; 25 percent of Alabamians have a 4-year degree compared to 32 percent across the country; 11.6 percent of Alabama’s population reported a disability compared to 8.6 percent nationwide.[1] The LFPR for Alabama’s Black Belt counties in 2019 was 52.7 percent, more than 10 percentage points lower than the national average. The 10 Alabama counties with the lowest LFPR in 2019 were all in the Black Belt.[2]
According to the Kaiser Family Foundation, 8.9 percent of Alabamians are uninsured, compared to 8.6 percent nationally; 48.8 percent of Alabamians are covered by their employers, compared to 50.3 percent nationally; 18.5 percent are on Medicaid, compared to 17.8 percent nationally; and 17.4 percent are on Medicare, compared to 15.6 percent nationally.[3]
The Bipartisan Policy Center’s report, Child Care Gaps Assessment: Alabama, reports 214,150 childcare slots are needed based on the number of children under 6 with all parents in the workforce. The Gaps Assessment identified every available source of childcare and provided an estimated 128,959 available slots, showing a gap of 85,554.[4] A particular concern for businesses, some of the counties with the most rapidly growing demand for workers have substantial childcare shortages. Half of the fourteen counties that added at least 3,000 jobs from 2014-2018 are also childcare deserts. Counties on the fringes of the state’s large metro areas, such as Baldwin, Tuscaloosa, St. Clair, Cullman, Limestone, Morgan, Marshall, and DeKalb, have growing populations and employment, but availability of childcare has not kept pace, creating a shortage of childcare seats. The bottom line is there is not enough childcare. Key opportunities for success include home-based childcare, shared services/co-ops, and expanding employer-sponsored care.[5]
Prior to the pandemic, Alabama’s employment rate for working-age people with disabilities in America was 33.1 percent, compared to 74.6 percent of people without disabilities. This disparity is even more striking when broken down by race. 34.9 percent of working-age people with disabilities who are white have jobs compared to only 28.3 percent of those who are African American and 38.1 percent of those who are Hispanic. The LFPR for working-aged people with disabilities is now two full percentage points higher than it was before COVID-19. According to the Bureau of Labor Statistics, people with disabilities now have a 35.6 percent LFPR, compared to 76.1 percent of those without disabilities.
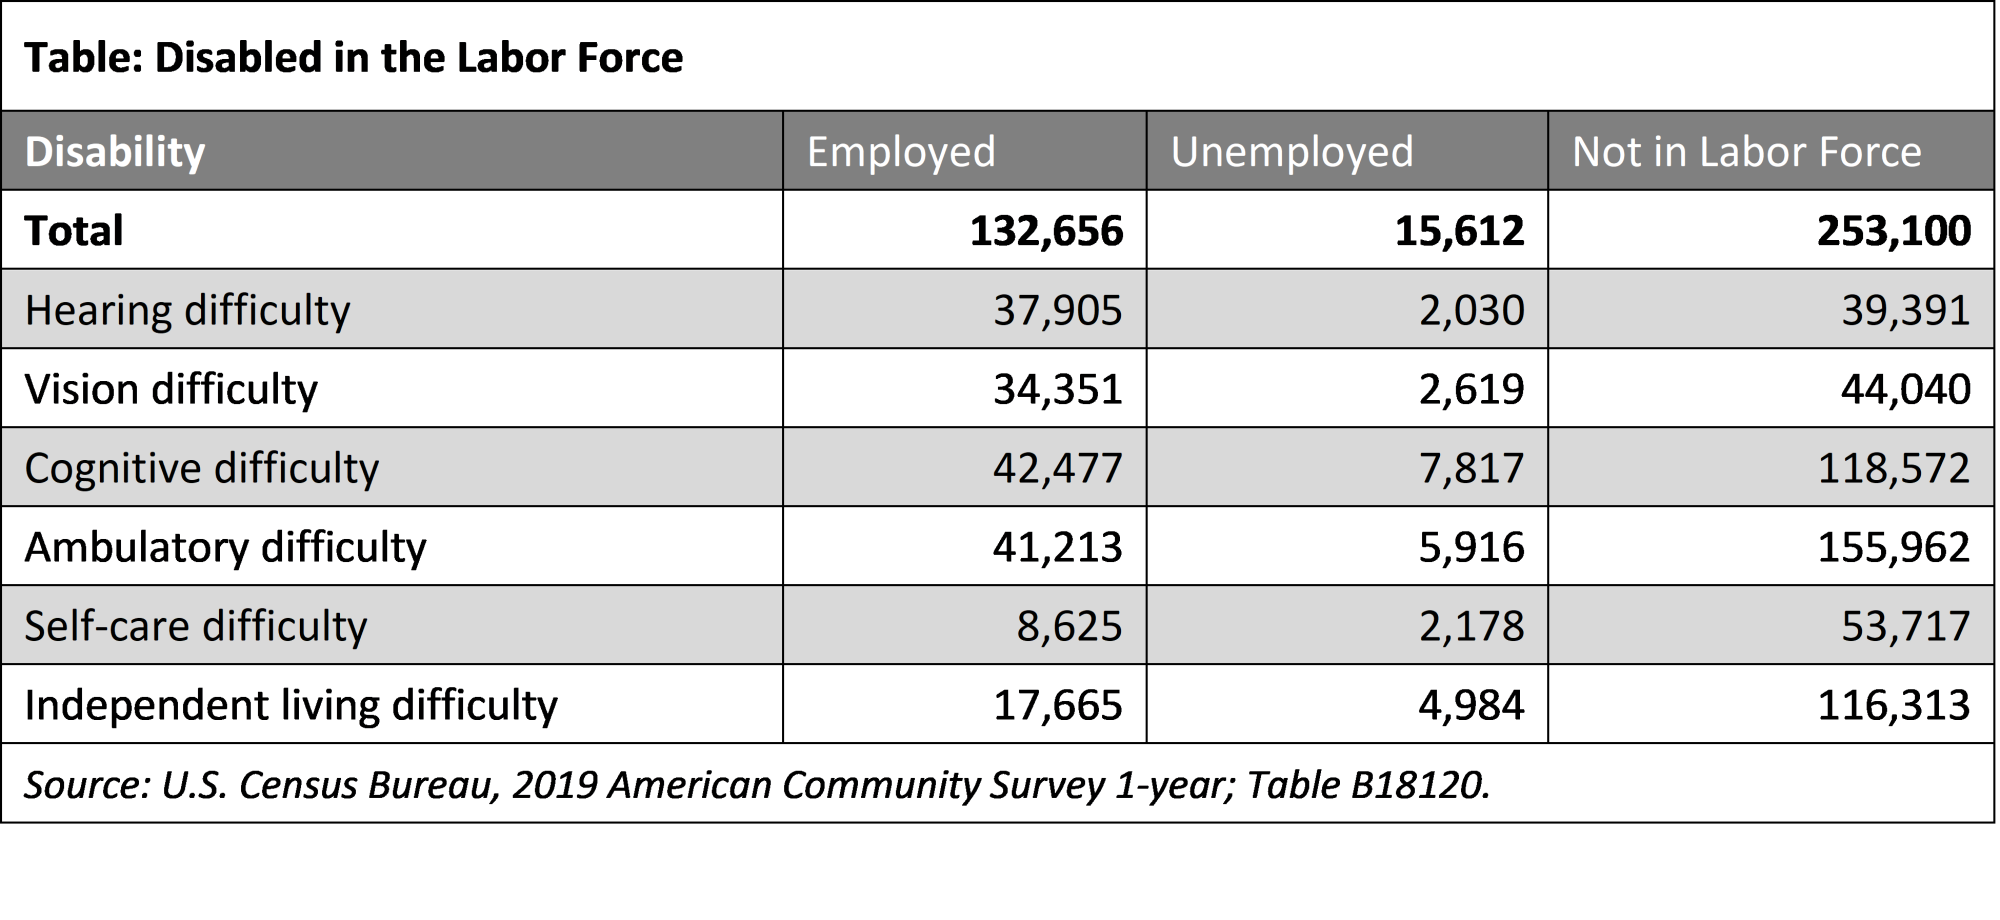
According to the SSI Annual Statistical Report 2020, Alabama ranks seventh in the nation in the percentage of the population who are receiving disability social security benefits (3.2 percent). This is a lower rank from the previous year when the state ranked second in the nation. Census estimates from 2019 reveal that approximately 781,503 people in the state have a disability, 40.3 percent over the age of 65. Over 132,000 people with disabilities were in the labor force in 2019, with over 15,000 of them unemployed. In 2019, 50.1 percent of those unemployed had some form of cognitive difficulty, which is defined as a disability that affects the brain, making it harder to do normal tasks that most people can perform. Approximately 18,831 of the working people with disabilities were still below the poverty level within the previous twelve months, while 5,183, approximately 1.3 percent, of the unemployed were below poverty level. Within the households receiving food stamps or SNAP, in the past twelve months, 46 percent of households included one or more persons with a disability, no significant change from 2016.
In Alabama’s K-12 public schools, there are over 87,000 students with disabilities. The gap in graduation rates between students with and without disabilities continues to undermine their futures. Critically, among the class of 2019, the high school graduation rate for students with disabilities was only 70 percent, compared to 92 percent of students without disabilities.[6]
A report by Alan Krueger, former Chairman of the White House Council of Economic Advisers, found that opioids are likely pulling prime-age workers (between ages 25 and 54) out of the labor force.[7] Alabama, and states across the nation, face a troubling epidemic of prescription opioid and heroin abuse and addiction. Work activity among prime-age (25–54) men in America has declined precipitously, falling from 96 percent in 1967 to only 88 percent in 2016 (and 83 percent among those with only a high school degree or less education), leaving seven million or more working-age men in the non-institutional population outside the labor force.[8] Furthermore, the LFPR is lower and fell more in the 2000s in areas of the US that have a higher volume of opioid medication prescribed per capita than in other areas.[9]
In 2013, Alabama providers wrote 141.1 opioid prescriptions for every 100 people (approximately 6.8 million prescriptions)—the highest prescribing rate in the country and almost twofold greater than the average US rate of 79.3.[10] According to BlueCross and BlueShield of Alabama, 26 percent of BlueCross and BlueShield of Alabama’s commercially-insured members filled at least one opioid prescription in 2015, compared to 21 percent nationally.[11] Alabama’s labor force and economy are among the hardest hit by the opioid crisis. This rise in opioid use in Alabama was associated with a 2.6 percentage point decline in the state’s LFPR of prime-age workers, slowing annual real gross domestic product growth by 1.2 percentage points.
[1] Tom Spencer, “Help Wanted: Alabama’s Labor Force Participation Problem,” Public Affairs Research Council of Alabama, 6 March 2020 <https://parcalabama.org/help-wanted-alabamas-labor-force-participation-problem/>.
[2] Ramsey Archibald, “Black Belt far behind rest of nation in work force participation: Black Belt 2020,” al.com, 15 September 2020 <https://www.al.com/news/2020/09/black-belt-far-behind-rest-of-nation-in-work-force-participation-black-belt-2020.html>.
[3] Kaiser Family Foundation, “Health Insurance Coverage of the Total Population,” 2020 <https://www.kff.org/ other/state-indicator/health-insurance-coverage-of-the-total-population-cps/?activeTab=map¤t Timeframe=0&selectedDistributions=uninsured&selectedRows=%7B%22states%22:%7B%22alabama%22:%7B%7D%7D,%22wrapups%22:%7B%22united-states%22:%7B%7D%7D%7D&sortModel=%7B%22colId%22:%22Location %22,%22sort%22:%22asc%22%7D>.
[4] Alabama Partnership for Children, Working Families and Child Care in Alabama, June 2020 <https://alabama partnershipforchildren.org/wp-content/uploads/2020/07/Alabama-COVID-Parent-Survey-State-report-6.29.pdf>.
[5] The Women’s Fund of Greater Birmingham, 2021 Clearing the Path: Strengthening Child Care, Strengthening Alabama, 2020 < https://wfalabama.org/assets/2021/11/TWFGB_2021-CTP-Strengthening-Child-Care-Strengthening-Alabama_Web-Ready.pdf>.
[6] Joshua Steinberg, “Building an Equitable Recovery: RespectAbility Advises Alabama on Solutions for People with Disabilities,” RespectAbility, 1 December 2021 <https://therespectabilityreport.org/2021/12/01/alabama-workforce-testimony/>.
[7] Alan B. Krueger, “Where Have All the Workers Gone? An Inquiry Into the Decline of the U.S. Labor Force Participation Rate,” Brookings Papers on Economic Activity, September 2017 < https://www.brookings.edu/wp-content/uploads/2017/09/1_krueger.pdf>.
[8] Robert Doar, Harry J. Holzer, and Brent Orrell, “Getting Men Back to Work: Solutions from the Left and the Right,” American Enterprise Institute, May 2017 < http://www.aei.org/wp-content/uploads/2017/04/Getting-men-back-to-work.pdf>.
[9] Alan B. Kreuger, “Where Have All the Workers Gone? An Inquiry Into the Decline of the U.S. Labor Force Participation Rate,” Brookings Papers on Economic Activity, September 2017 < https://www.brookings.edu/wp-content/uploads/2017/09/1_krueger.pdf>.
[10] National Institutes for Health, National Institute on Drug Abuse, Opioid-Related Overdose Deaths, Alabama, revised February 2018 < https://www.drugabuse.gov/drugs-abuse/opioids/opioid-summaries-by-state/alabama-opioid-summary>.
[11] “Opioid Epidemic Grows as Alabama Ranks First Nationally Having More Opioid Prescriptions than People,” Press Release, BlueCross and BlueShield of Alabama, 29 June 2017 <https://www.bcbs.com/news/press-releases/opioid-epidemic-grows-alabama-ranks-first-nationally-having-more-opioid>.
While there were many improvements, there were also people who dropped out of the civilian labor force over the year. Approximately 7,000 more Black men dropped out of the labor force, increasing the total of nonparticipants to 189,000. Additionally, there were more nonparticipants within the Hispanic population in 2018, to a total of 46,000. Women dominated this increase in the Hispanic population. The age groups that experienced the largest decrease in labor force participation over the year were 25-34 and 45-54. Within the 25-34 group, most of the decrease was attributed to black males. In the 45-54 age group, increases appeared across all demographics, with an estimate of 172,000 in 2018 not in the labor force.
In 2020, the measure of labor underutilization in Alabama was 9.5 percent, 4.1 percent higher than 2019, and lower than the national rate of 13.6 percent. This measure includes the unemployed, those employed part time, and those marginally attached to the labor force. According to the Current Population Survey (CPS), Alabama had an average of 133,000 unemployed residents in 2020. Approximately 32,000 workers were employed part-time for economic reasons, which is referred to as involuntary part time. These people were either part time because the businesses they worked for were experiencing poor business conditions or were unable to find full-time employment. People marginally attached to the labor force are those who are not presently working, but would like to work, are available to work, and have looked for work within the last year, but have not searched within the last four weeks. In Alabama, the marginally attached in 2020 was approximately 16,800. The number of discouraged workers in the state, which is a subset of the marginally attached, was around 8,000, accounting for 32 percent of all marginally attached.
The latest census figures for 2019 estimate the population in the state age 16 to 19 is 322,486. Over 39,068 were not enrolled in school, and nearly 7,300 were not enrolled in school or participating in the labor force. In Alabama in 2019, there were approximately 141,844 youth age 14 to 21 employed in the workforce, 56 percent of them working in retail trade and accommodation and food services, earning an average monthly wage of $1,291. Nearly 9,017 youth worked in manufacturing, earning an average monthly wage of $1,326. 8,960 youth worked in health care with an average monthly wage of $1,185. 9,888 youth worked in administrative and support and waste management services with an average monthly wage of $972.

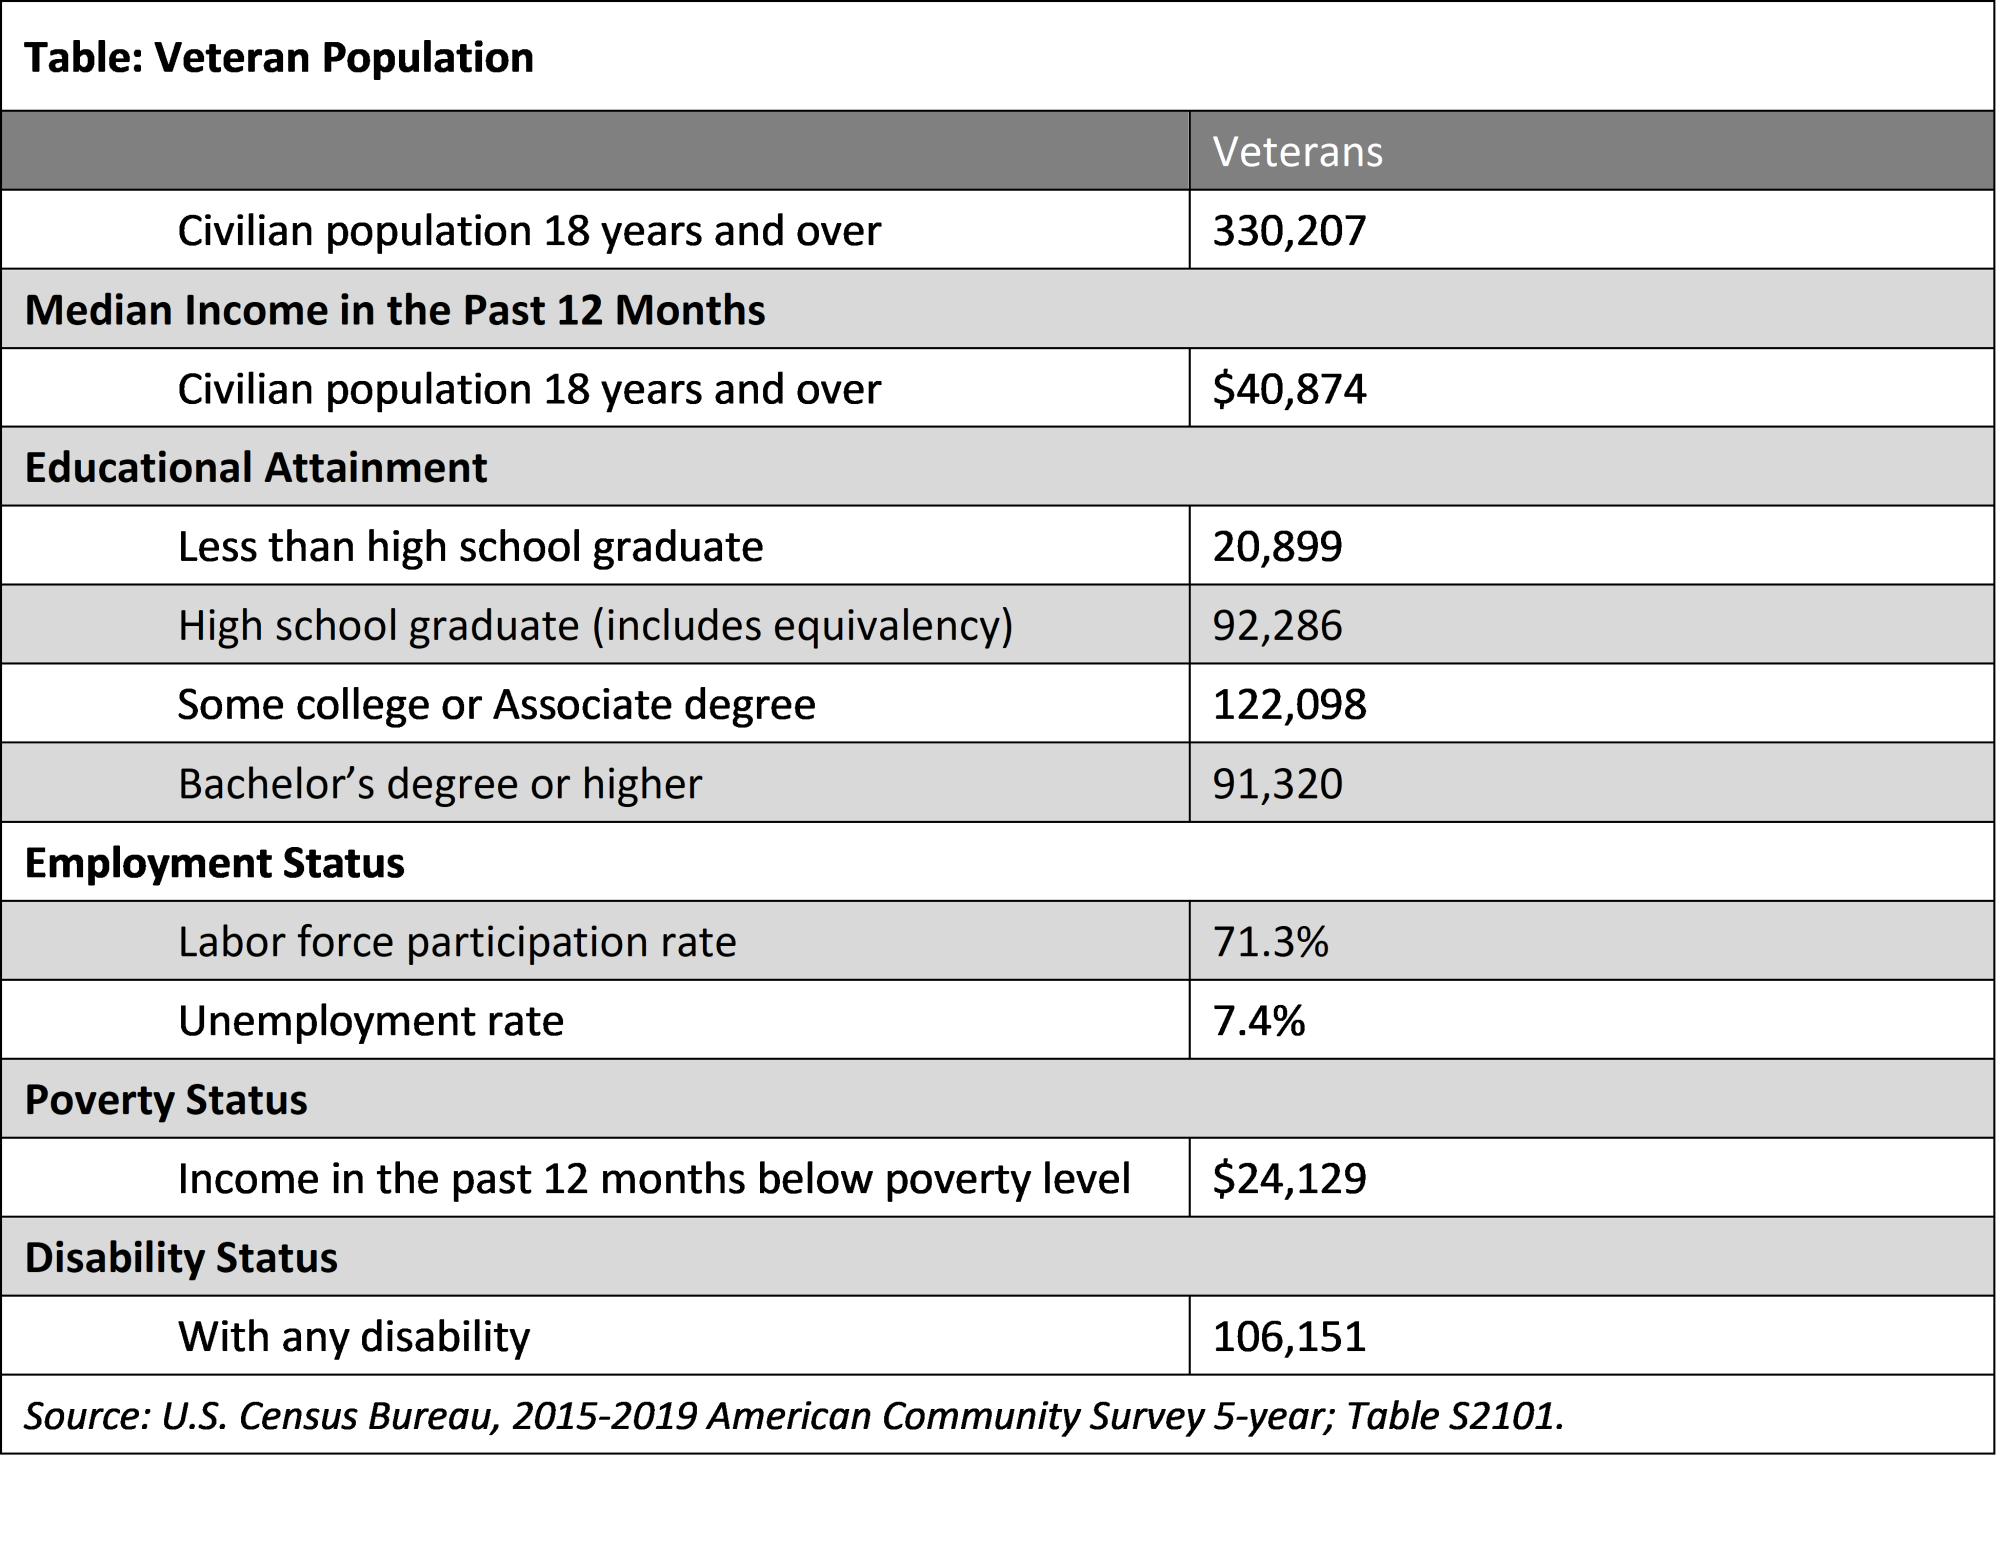
In 2017, Alabama had the 20th largest veteran population in the country. (VA National Center for Veterans Analysis and Statistics). The state is home to five military bases: Maxwell-Gunter AFB, Montgomery; Anniston Army Depot, Bynum; Fort Rucker, Dale; Redstone Arsenal; and, Aviation Training Center Coast Guard, Mobile. In addition, Alabama is home to the fifth-largest Army National Guard in the nation, with a total force of approximately 13,000. According to the US Department of Veterans Affairs, the veteran population in the state in 2019 was 330,207, 8.8 percent of the adult population. Over 46 percent of the state’s veterans were 65 or older. Around 24 percent of the veterans live in Region 1 and 20 percent live in Region 4.
A high percentage of veterans usually participate in the labor force, with Alabama’s rate of 71.3 percent in 2019. Over 64.6 percent of the veteran population in the state has at least some education beyond high school, with 28 percent holding a bachelor’s degree or higher. While the unemployment rate in 2019 averaged around 5.9 percent, the rate for veterans was 4.3 percent (ACS 2019). Still, there are many who need additional assistance due to disabilities which are often incurred during military service. Nearly 24,129 veterans were below poverty level in 2019 (ACS 2019). In addition, the Department of Veterans Affairs (VA) National Center for Veterans Analysis and Statistics estimated that 104,433 veterans in the state were receiving disability compensation.
An additional source of skilled labor exists in a pool of workers who are considered underemployed. The underemployed present a significant pool of labor because they tend to respond to job opportunities that they believe are better for reasons that include (i) higher income, (ii) more benefits, (iii) superior terms and conditions of employment, and (iv) a better match with skills, training, and experience. The underemployed also creates opportunities for entry-level workers as they leave lower-paying jobs for better-paying ones. Underemployment rates for counties, AlabamaWorks regions, and the state were determined from an extensive survey of the state’s workforce. A total of 7,347 complete responses were obtained. About 52 percent (3,816 respondents) were employed, of whom 855 stated that they were underemployed. Among the regions, underemployment ranged from 19.7 percent for North AlabamaWorks to 27.7 percent for West region. Central Six has the most available labor, followed by North. The two regions account for about 44 percent of the state’s available labor pool. Among counties, Tallapoosa County had the highest rate of underemployment at 37.5 percent and Morgan had the lowest with 8.8 percent. Thirty-three counties had underemployment rates above the state’s 22.4 percent.
From most important to the least, the main reasons for being underemployed are low wages at available jobs, a lack of job opportunities in their area, living too far from jobs, other family or personal obligations, owning a house in their area, other undisclosed reasons, and childcare responsibilities. Non-workers cite retirement, disability or other health concerns, social security limitations, low wages at available jobs, undisclosed reasons, and a lack of job opportunities in their area as reasons for their status. Such workers may become part of the labor force if their problems can be addressed. Indeed, a recent study found that the flow of labor force nonparticipants to employment status was 60 percent more than that of unemployed workers who gain employment. This implies that the state’s available labor pool could be larger than estimated in this report.
The statewide underemployment rate was 22.4 percent in 2019. Applying this rate to March 2020 labor force data means that 477,696 employed Alabama residents were underemployed. Adding the unemployed gives a total available labor pool of 551,554 statewide. This is 7.5 times the number of unemployed and is a more realistic measure of the available labor pool in the state. Prospective employers must be able to offer the underemployed higher wages, better benefits or terms of employment, or some other incentives to induce them to change jobs. The underemployed workers are willing to commute farther and longer for a better job. For one-way commute, 43.3 percent of the underemployed are prepared to add 20 or more minutes to their one-way commute and 33.4 percent are willing to add 20 or more extra miles for a better job.
Most workers (80.0 percent) are satisfied or completely satisfied with their jobs. Workers are most satisfied with the work that they do and least satisfied with the earnings they receive. Fewer underemployed workers are satisfied with their jobs (62.7 percent). The underemployed are more dissatisfied with their earnings and most satisfied with their work shift. Workers are generally willing to train for a new or better job, with the underemployed being much more willing (62.2 percent vs. 52.5 percent). However, the willingness to train is strongly influenced by who pays for the cost of training. Workers typically do not wish to pay for the training and so their willingness is highest when the cost is fully borne by the government and lowest when the trainee must pay the full costs. The underemployed workers are more willing to train for the new or better job even if they must bear the full cost.
Extremely limited data are available on opioid and substance misuse within the North AlabamaWorks region. Alabama continues to have one of the highest rates of opioid prescriptions dispensed in the nation, at a rate of 107.2 scripts per 100 residents in 2017, nearly twice the national average of 58.7 scripts per 100 residents. The number of opioid prescriptions per 100 persons in the region as compared to Alabama and the United States shows this is one of the worst contiguous regions in the country for opioid prescriptions. Opioid-related overdose deaths in Alabama have risen every year since 2013, reaching levels more than triple that observed in the mid-2000s. Using the Rural Appalachia Overdose Mapping Tool from NORC for data from 2013-2017, the counties in the region show high overdose mortality rates as compared to Alabama and the United States. As noted in the Alabama Opioid Strategic Response Needs Assessment, the state’s lack of structure and regulatory guidelines for reporting drug overdose deaths has contributed to the underreporting of opioid overdoses and deaths. It is important to note that there are secondary effects of the opioid epidemic across Alabama, including, but not limited to, HIV and viral hepatitis infection attributed to unsterile intravenous drug use. The North AlabamaWorks region includes multiple counties identified to be the most vulnerable to an outbreak of HIV or Hepatitis C within the United States (CDC, 2016).
(ii) Labor Market Trends
Labor Market Trends. Provide an analysis of key labor market trends, including across existing industries and occupations.
The nonagricultural employment of Alabama residents in the state averaged about 1.8 million quarterly. The Health Care sector was the leading employer in Alabama, with 267,166 jobs in the second quarter of 2021. Rounding out the top five industries by employment are Manufacturing, Retail Trade, Accommodation and Food Services, and Educational Services. These five industries provided 1,084,608 jobs, 57.4 percent of the state total. Manufacturing has historically had a huge impact on the economy of the state, primarily to the tremendous growth in transportation equipment manufacturing. The state is home to four major auto manufacturing plants, a major shipbuilding plant, several aerospace manufacturing plants, including one producing planes in the US for the first time, located in Mobile, AL. These major plants have led to hundreds of thousands of jobs in parts manufacturing across the state. Automobiles have become Alabama’s number one export. The state ranks second in the United States in vehicle exports, and fifth in the number of vehicles manufactured.
The insurgence of transportation manufacturing in the state has produced a huge demand for highly skilled technical workers. Occupations such as team assemblers, aircraft mechanics, aircraft assemblers, welders, industrial machinery mechanics, computer-controlled machine operators, machinists, and many others have experienced significant increases in employment. Furthermore, advances in technologies, such as the wide use of robotics for parts assembly, have raised the level of skills required to compete for these jobs. This facility, as well as the Alabama Industrial Development Training (AIDT) Maritime training facility in Mobile, are providing invaluable training services to manufacturing employers across the state.
Health care makes up approximately 14.2 percent of the state’s employment. While hospitals have maintained a fairly steady employment level over the last decade, the more specialized areas of the health care industry are showing rapid growth. Due to the aging population, demand for home health services and nursing care facilities has grown rapidly. Two of the largest occupations in demand in recent years have become personal care aides and home health aides. Although these are entry-level occupations, and the wages are very low, they provide those who are interested in health care as a career an opportunity work in the field while completing their education. Outpatient surgical procedures have become the norm due to advances in technology, and this has created a boom in outpatient care facilities or rehabilitation facilities. The huge demand for physical therapists, physical therapists’ assistants, occupational therapists, and speech-language pathologists is a result of an increased number of people needing assistance to function independently after medical procedures. The huge demand for health care has also created higher patient loads on physicians, which in the last decade has resulted in an increase in medical assistants, physician assistants, surgical assistants, etc. These professionals get trained to perform basic health care services, such as physicals, minor illnesses and health issues, and administer diagnostic tests, under the supervision of a physician. This frees the physicians to focus on the more serious medical problems. This is the trend throughout the health care industry. The number of surgeons, physicians, dentists, anesthesiologists cannot alone handle the huge needs from a growing and aging population. This provides huge opportunities for people who are interested in working in the healthcare field and earning a sustainable wage without obtaining advanced degrees. In Alabama, as in most of the states in the nation, specialized healthcare occupations dominate the high demand occupations. Half of the current list of the top forty occupations in highest demand are healthcare occupations, with nine requiring less than a bachelor’s degree for entry into the careers. Furthermore, looking at a list of the top 40 occupations in demand requiring less than a bachelor’s degree, nearly half of those are also healthcare occupations.
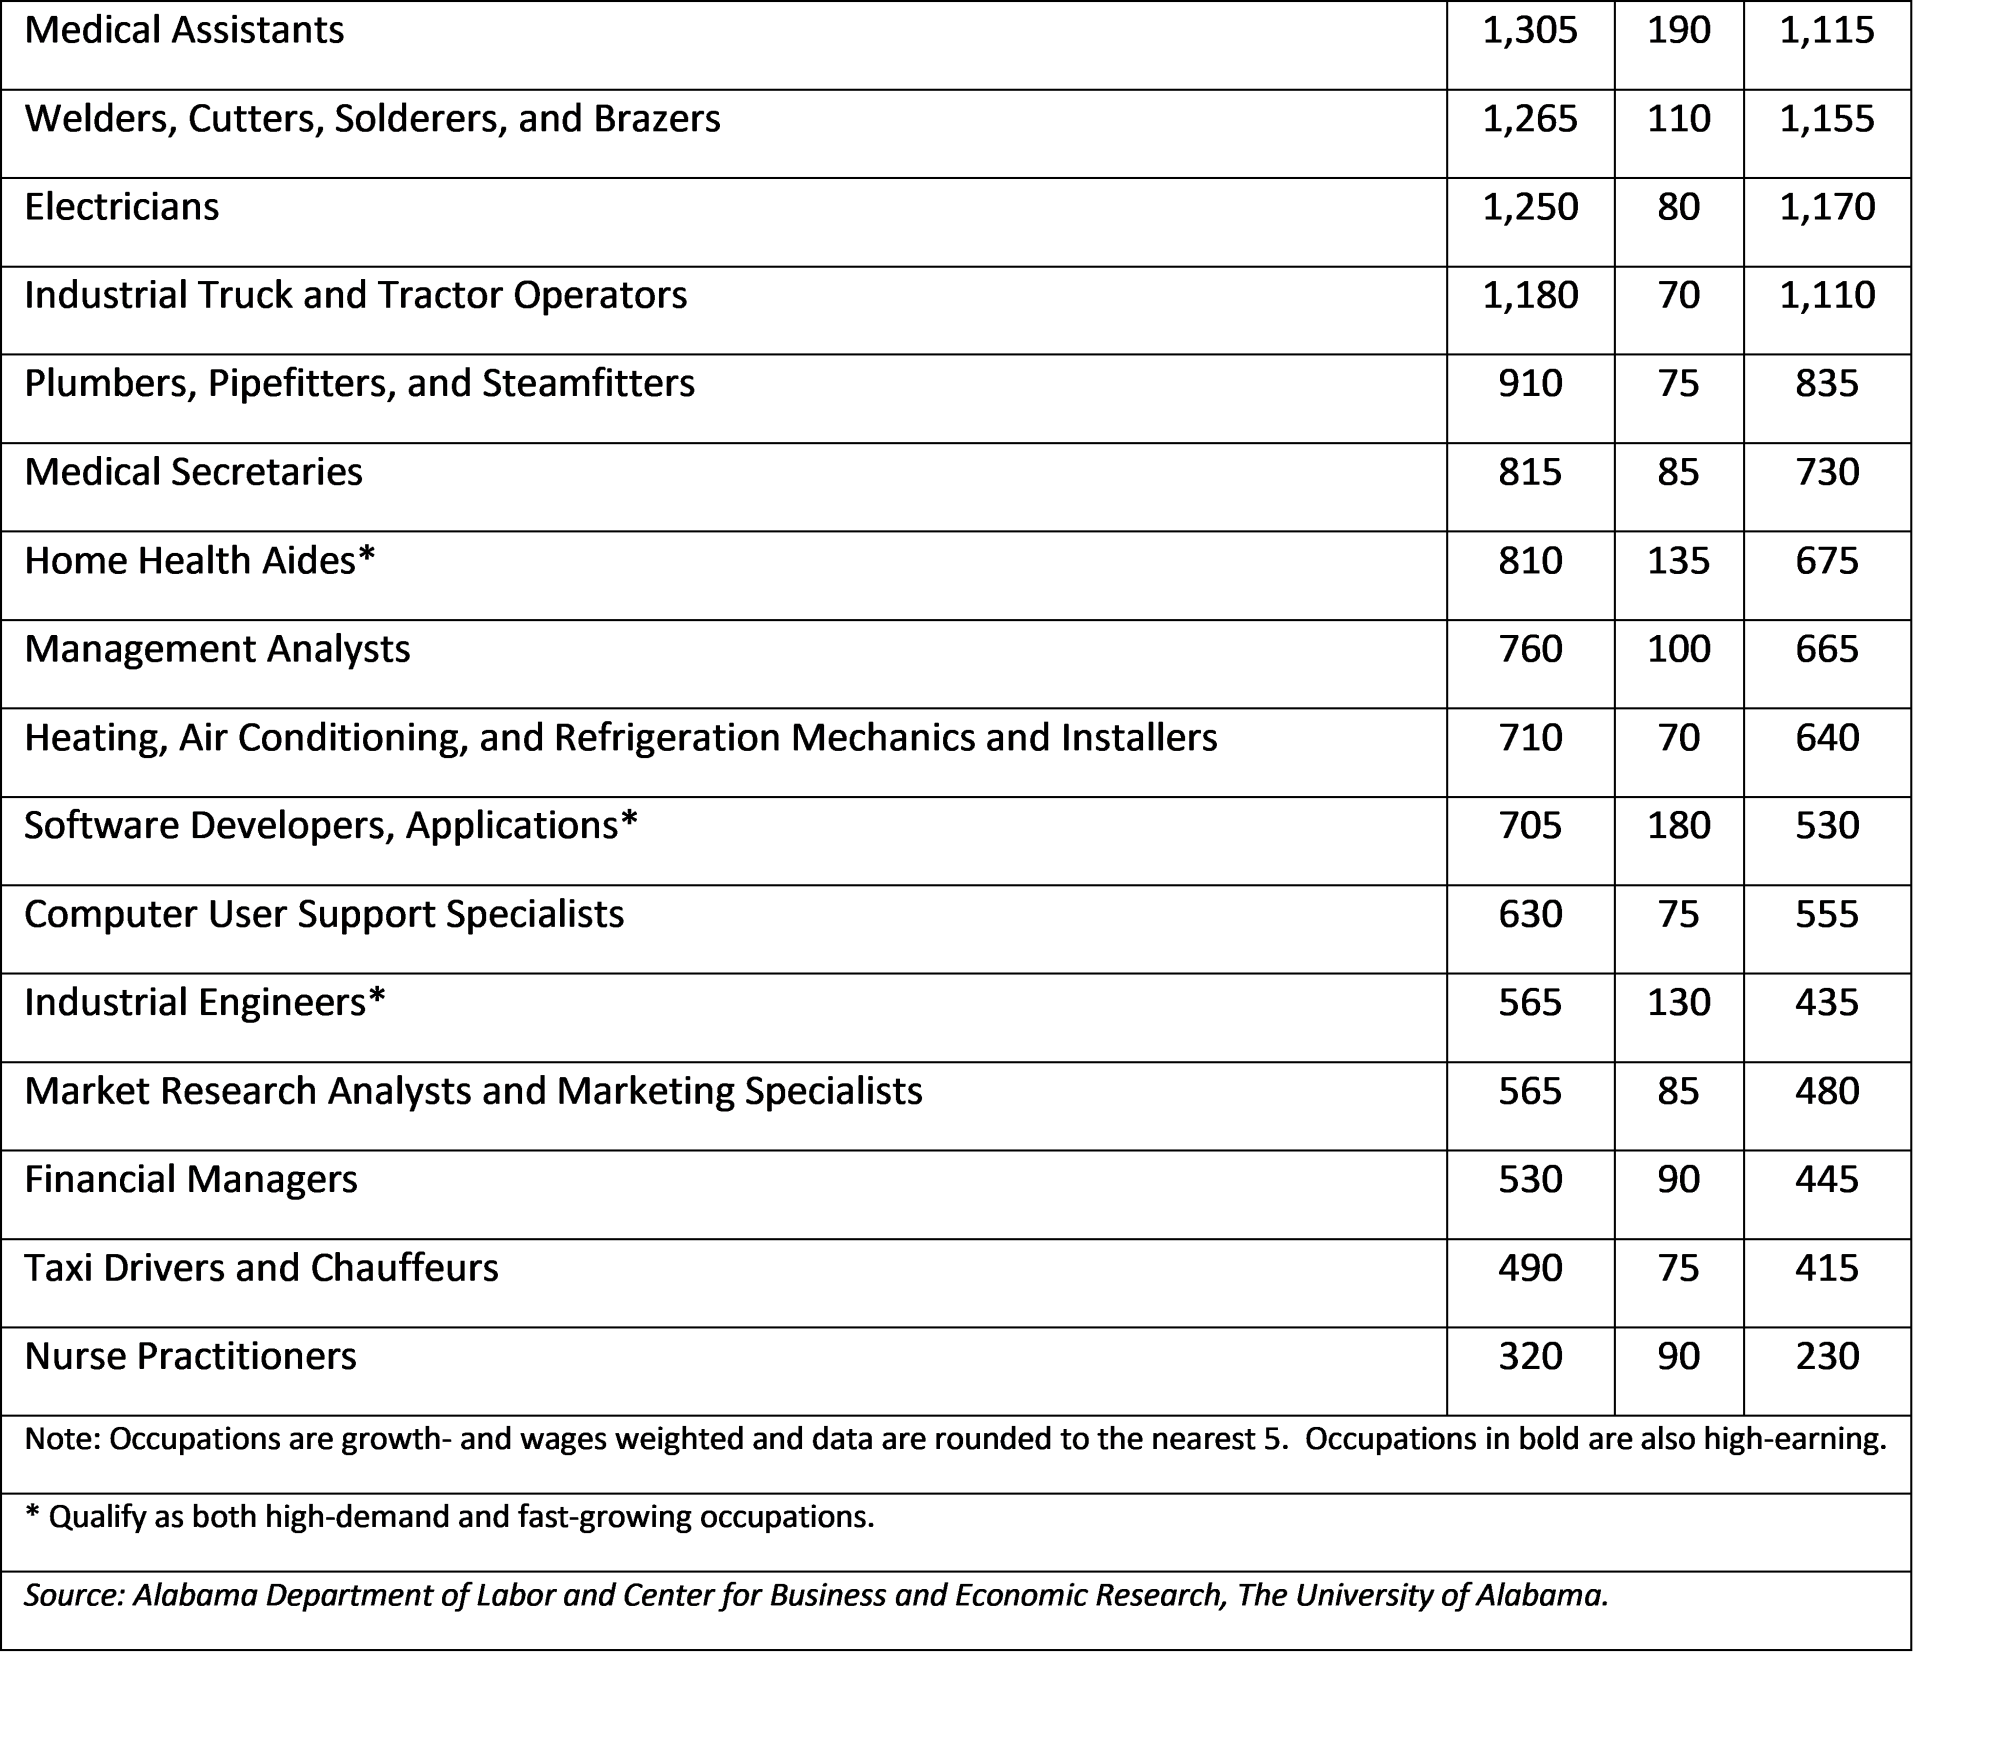
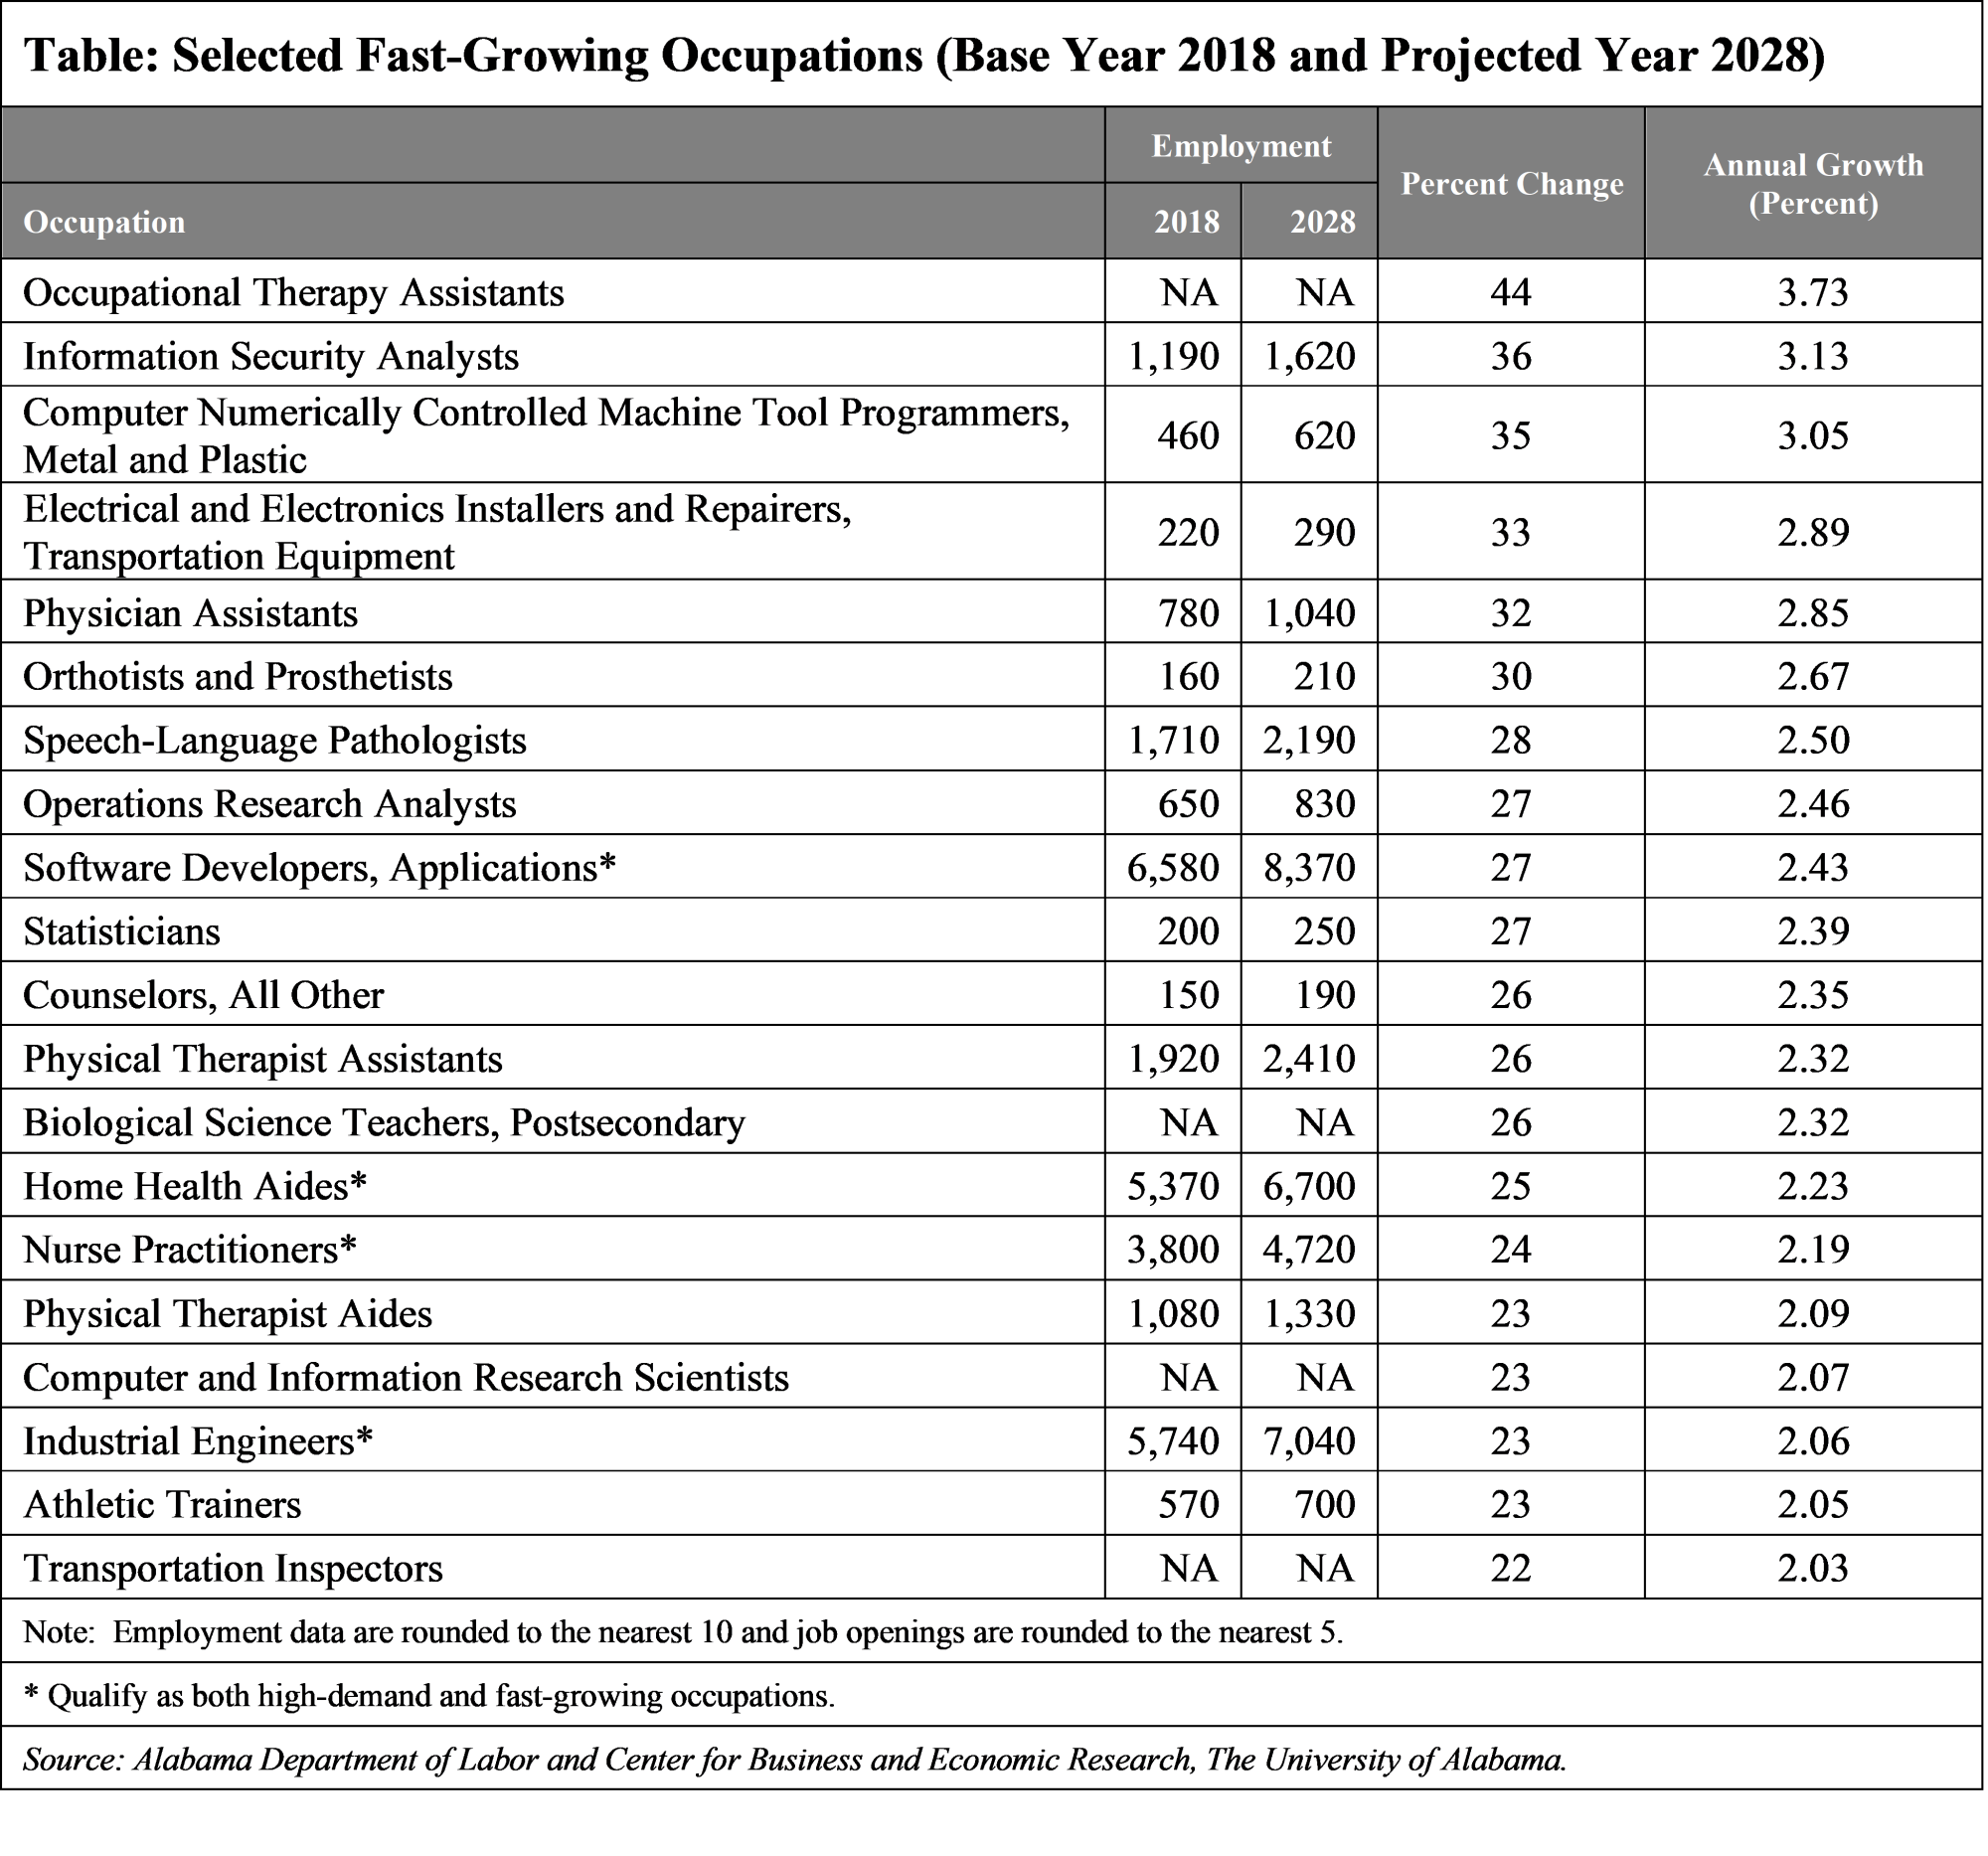
The high demand occupations in the state are reflective of the industries that are presently in high demand and are expected to continue that trend into the next decade. Workforce development partners are dedicated to providing training to meet employers’ demands for a skilled workforce in these high demand industries and occupations. The goal to lift the state’s economy is to provide its citizens with the necessary tools so that they are successful in careers that are high demand, fast-growing, and also provide sustainable wages. The current high demand occupations in Alabama are based on the 2018-2028 occupational employment projections (see tables below). Working with the ACCCP, The Alabama Department of Labor, Labor Market Information division identifies demand occupations in accordance with ACCCP demand criteria, and aligns its list of demand occupations with the ACCCP. The current list of demand occupations across all career clusters totals over 230 occupations.
Manufacturing leads the demand list with 40 demand occupations. Architecture & Construction, Health Science, Transportation, and Human Services round out the top five career clusters based on the number of demand occupations included in the list. of these healthcare occupations that are in demand are in nursing and assisting, or aides, most of them requiring a post-secondary certificate or associate degree or higher. Assemblers and Fabricators have the highest projected annual openings in Manufacturing with over 4,000 through 2028. Landscaping and grounds-keeping workers lead the with the most annual openings in Architecture and Construction. In Health Science, Registered Nurses have the highest annual openings with over 3,400. Laborers & Freight, Stock, & Material Movers, and Heavy and Tractor Trailer Truck Drivers top the demand list for Transportation with over 6,000 and 4,000 annual openings, respectively.
For Manufacturing, over 75 percent of the occupations on the demand list require a high school diploma or less. In Architecture and Construction, as well as Transportation and Distribution, over 60 percent of the occupations in the demand list also require a high school diploma or less. The highest percent of demand occupations in Health Science require an Associate’s degree. This would include Registered Nurses with a 2-year degree. For Human Services, a majority of their demand occupations a Bachelor’s degree or above.
Nearly a third of the high demand occupations are highly skilled trade jobs, which typically appear in construction and manufacturing industries. Four of them, industrial machinery mechanics, assemblers and fabricators, and multiple machine tool operators are a direct result of a fast-growing transportation and aerospace manufacturing industries in the state. There is also a high demand for welders and various types of machinists across the state due to the state’s expanding manufacturing industries. While these are statewide demand occupations, the demand for skilled trade occupations in the state varies depending on regional economies.
The most in-demand occupations that occur statewide include occupations for IT, engineers, managers, and various financial and data analyst type occupations. Computer occupations will continue to be in high demand as technology increases the careers that require computers and robotics. In recent years, however, interest in the pursuit of advanced IT careers has waned, so workforce development is working on efforts to increase the number of students trained in this field. The three engineering occupations are all imperative for the success of the state’s thriving manufacturing sector; industrial engineers, mechanical engineers, and aerospace engineers. Demand for market research analysts is a reflection of an emphasis on making effective and efficient decisions based on data analysis. With the advancement of technology, more data is being collected than ever before. Companies are beginning to see the advantages of regular data analysis to increase success.
Twenty-five occupations were selected as the fastest growing in the state for the 2018-2028 period. Each of these occupations was expected to grow from 3.73 percent to 1.46 percent each year during the period. The majority of the twenty are healthcare-related occupations and manufacturing occupations.
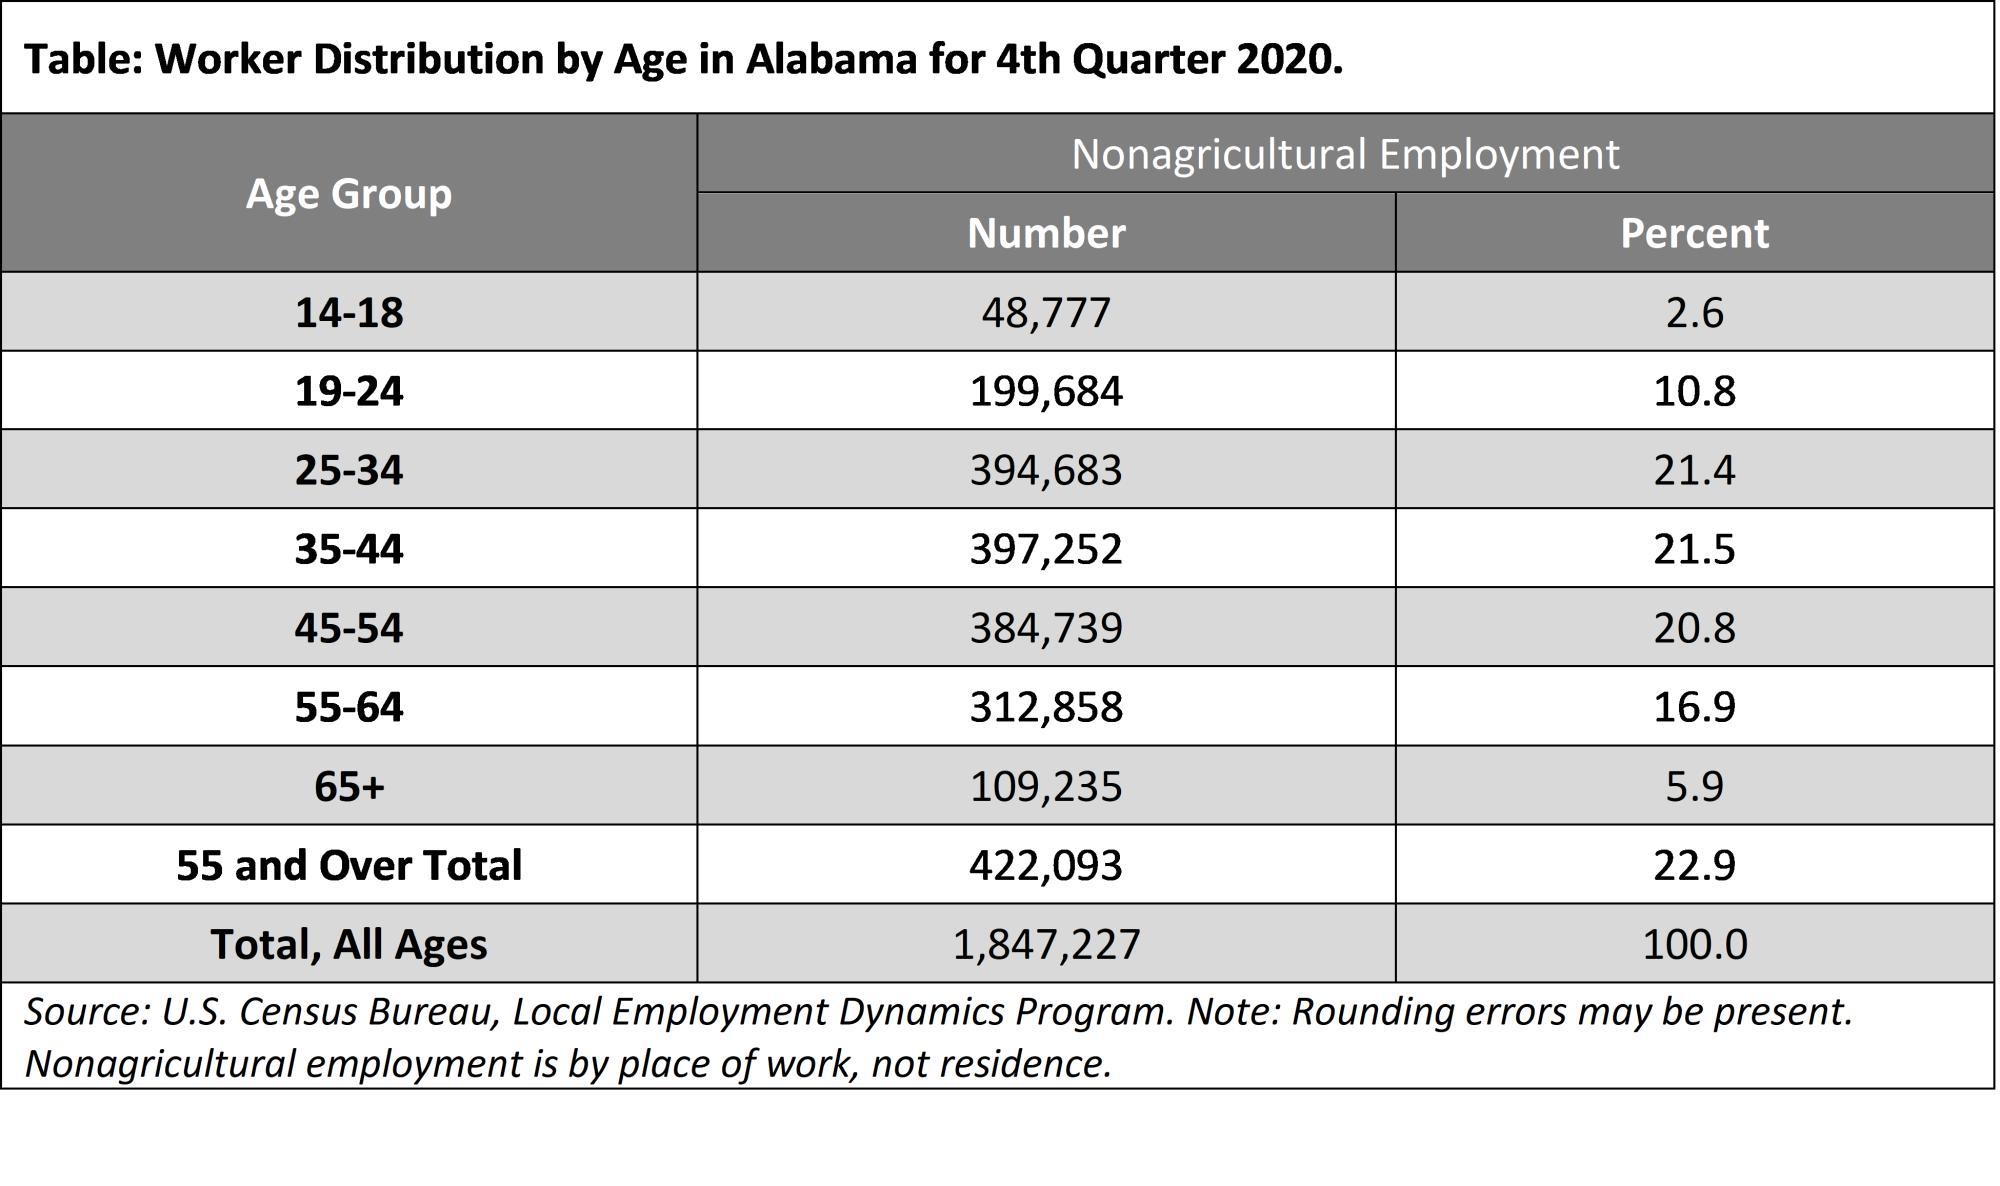
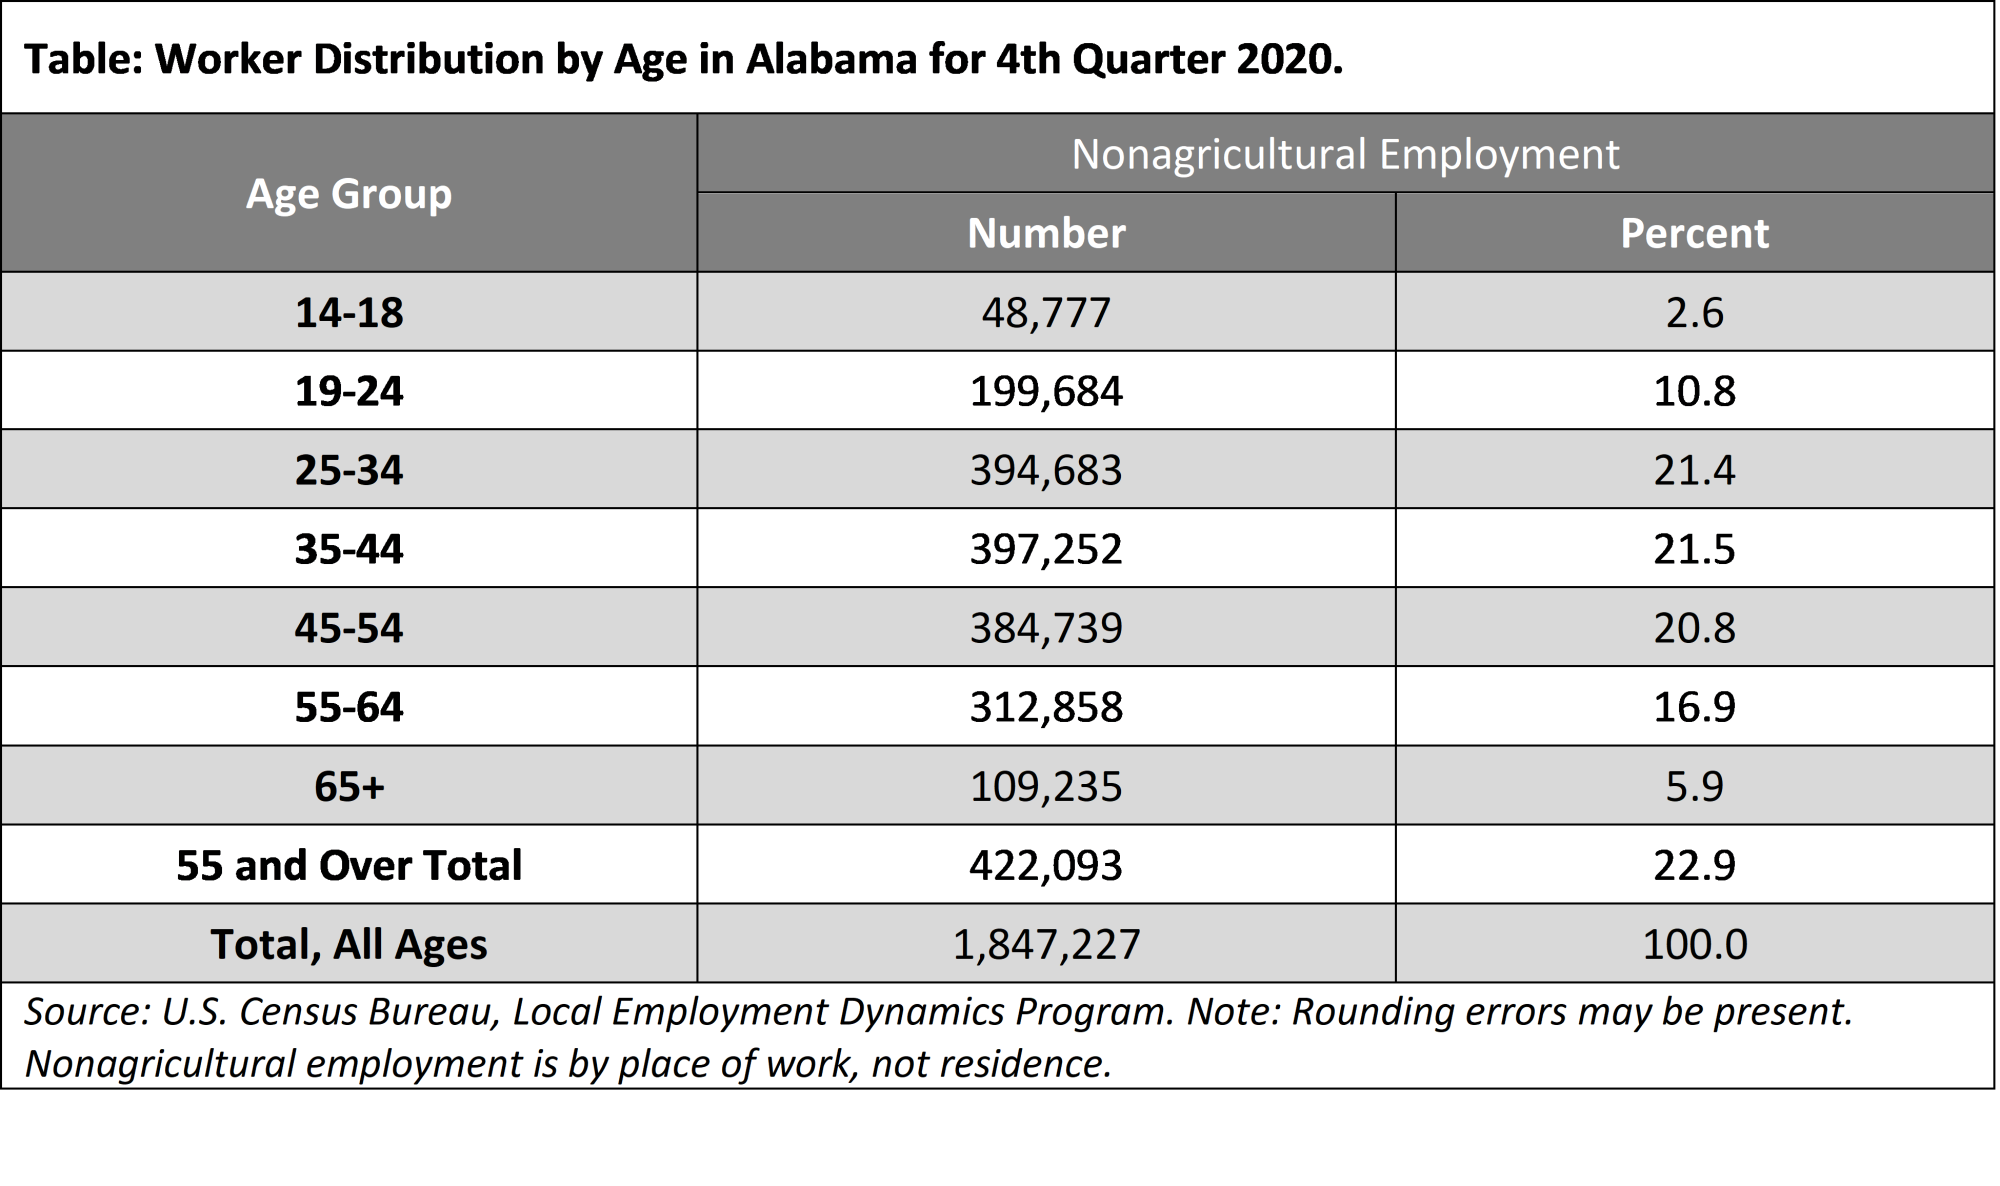
At 23.0 percent, older workers (age 55 and over) constitute a significant and growing part of total nonagricultural employment. The share of older workers for the WDRs ranged from 21.6 percent for Region 7 to 23.0 percent for Region 1. To meet long term occupational projections for growth and replacement, labor force participation of younger residents must increase; otherwise, older workers may be required to work longer.
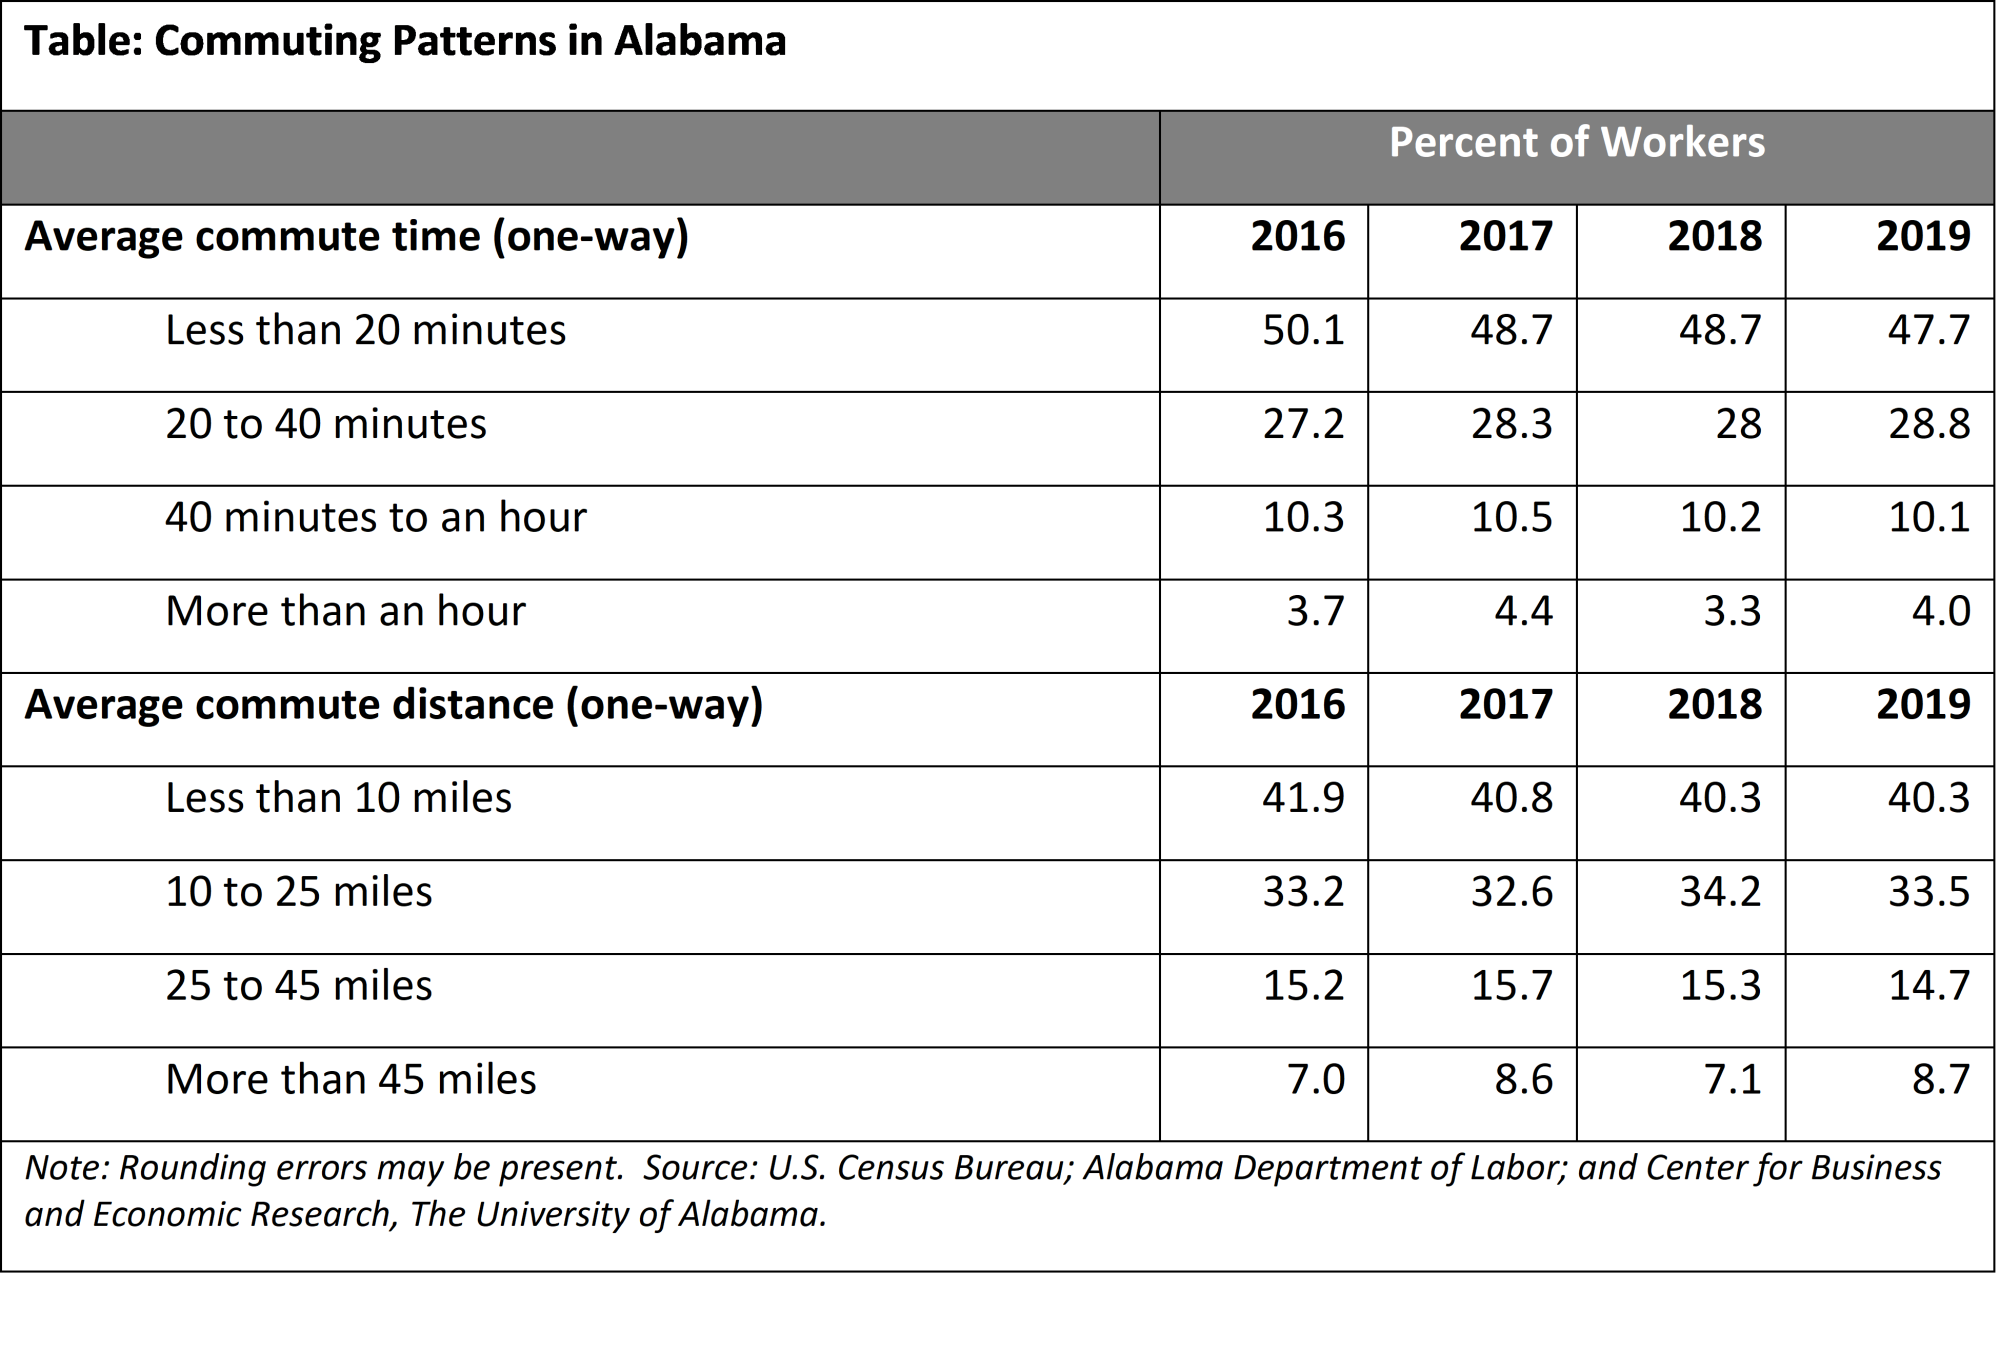
Alabama continues to lose workers to surrounding states, for the latest data (2019) indicates there was a net out-commute of approximately 20,000 people. The total number of out-commuters in 2019 was over 97,000, down almost 19,000 from 2018. The data indicates that the largest increase in out-commuters appeared in the 30 to 54 age group. While the largest percentage of these commuters worked in Georgia, there was minimal change over the year. There was minimal change to the percent of workers commuting to Florida and Tennessee as well.
Some of the increase in out-commuters among the state’s younger workers could have been college graduates who couldn’t find local jobs and settled with long commutes. According to a survey conducted by the University of AL, Center for Business and Economic Research (CBER), figures for 2019 indicate a notable reduction in both commute distance and commute time, with commute time less than 20 minutes and 40 minutes to an hour; dropping below the 2016 rates. Distances travelled less than 10 miles and 25 to 45 miles saw drops in commuting distance. While this is great for the economy, leaders both in business and public service still must explore strategies to bring workers back to Alabama and reduce the number of graduates who move out of state to pursue careers.
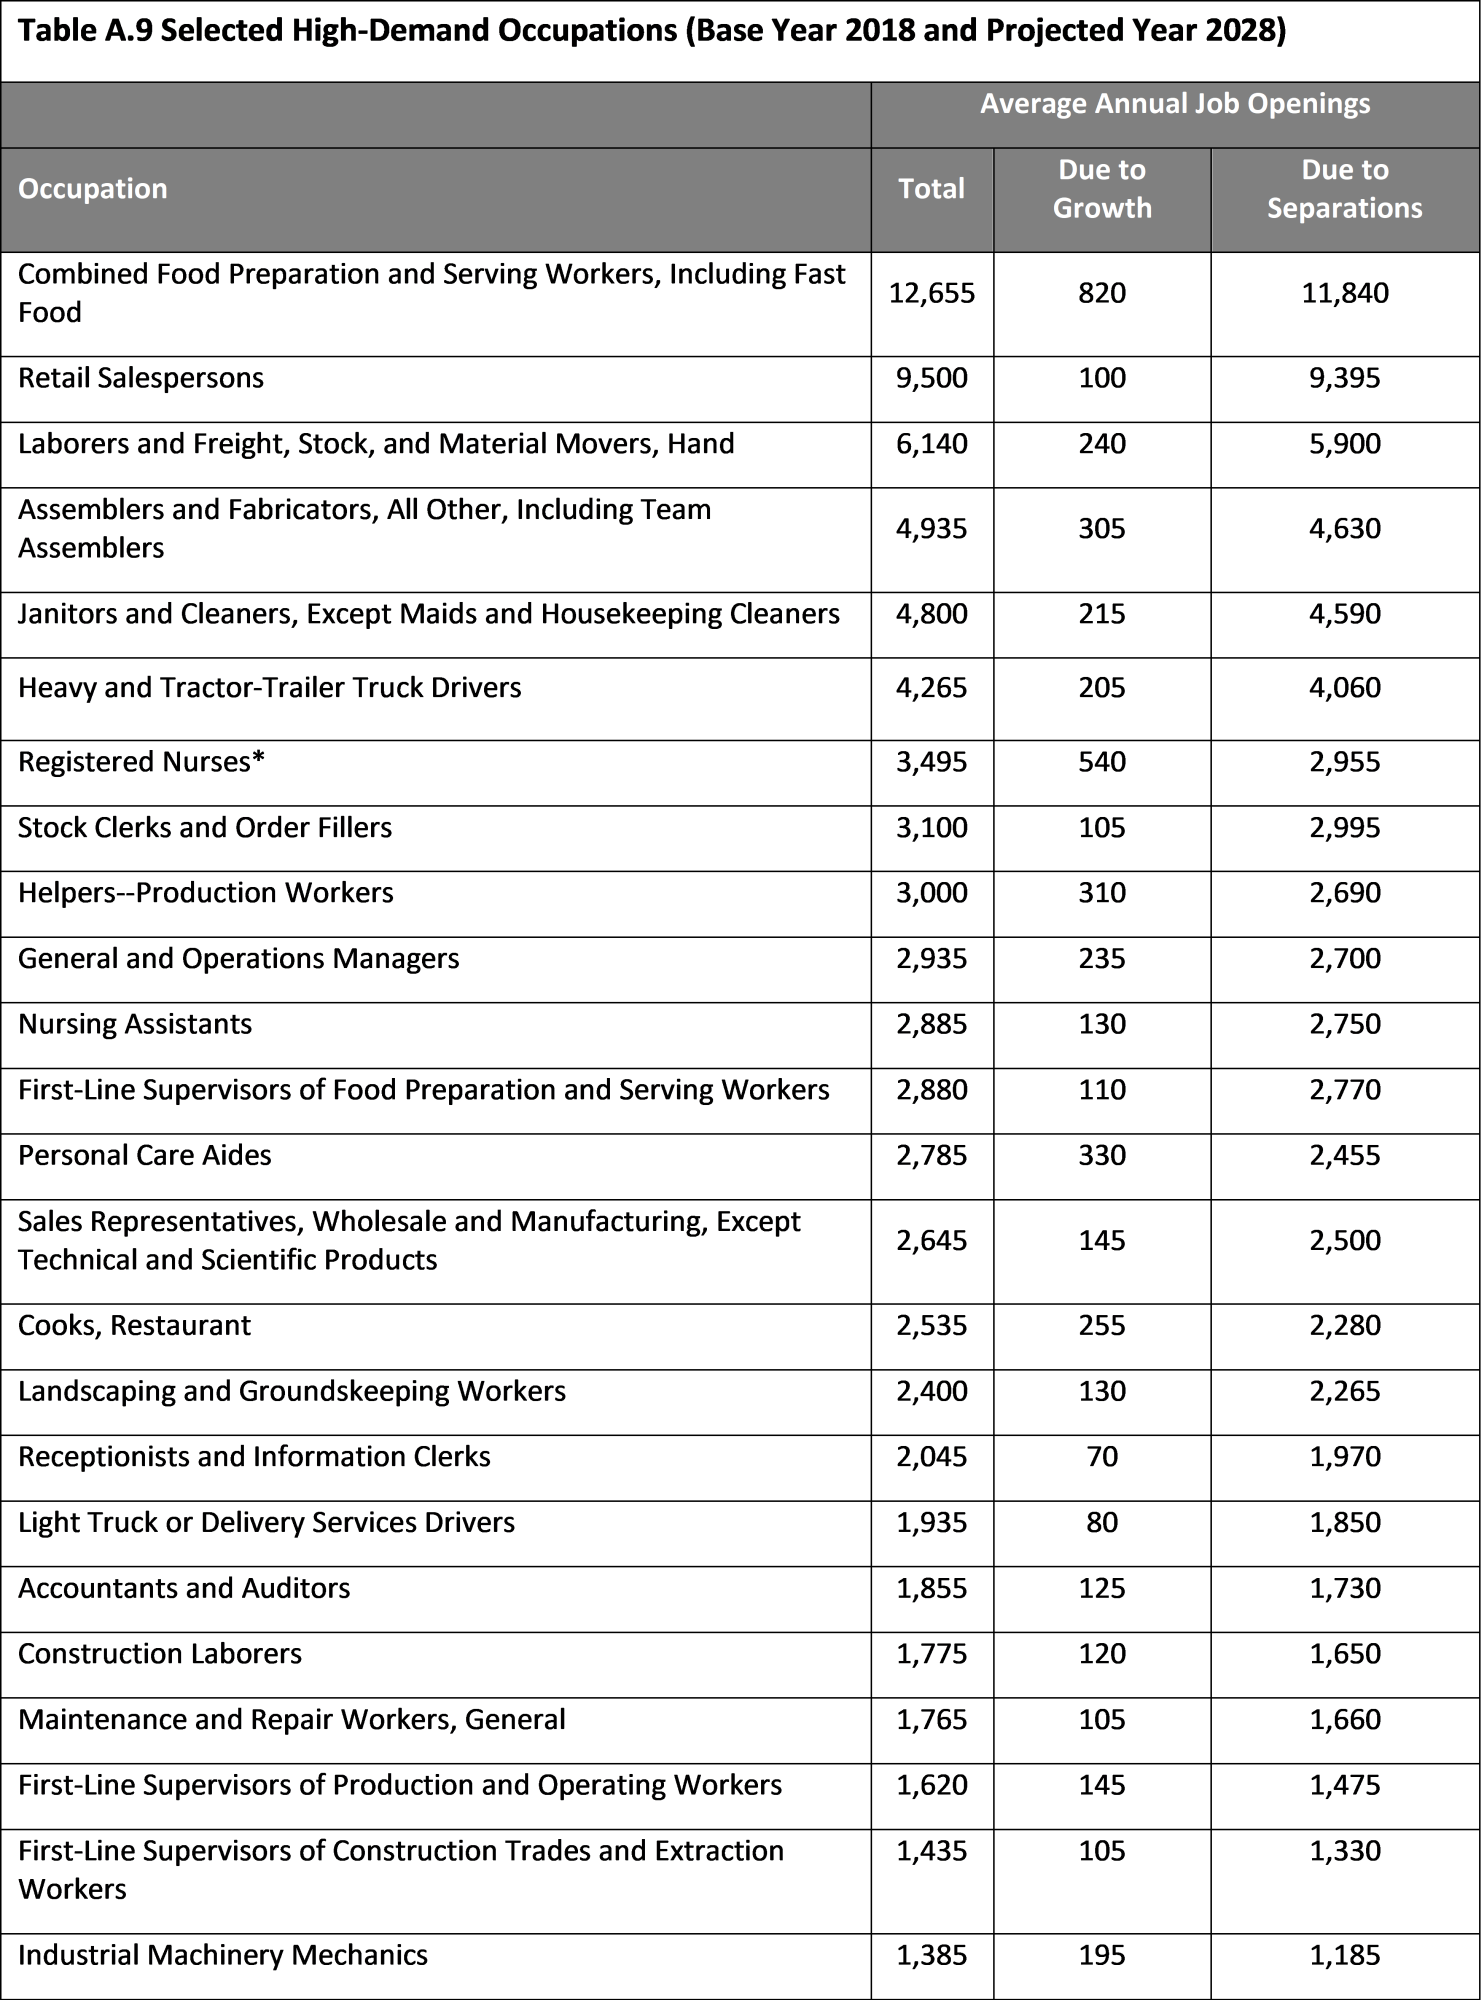
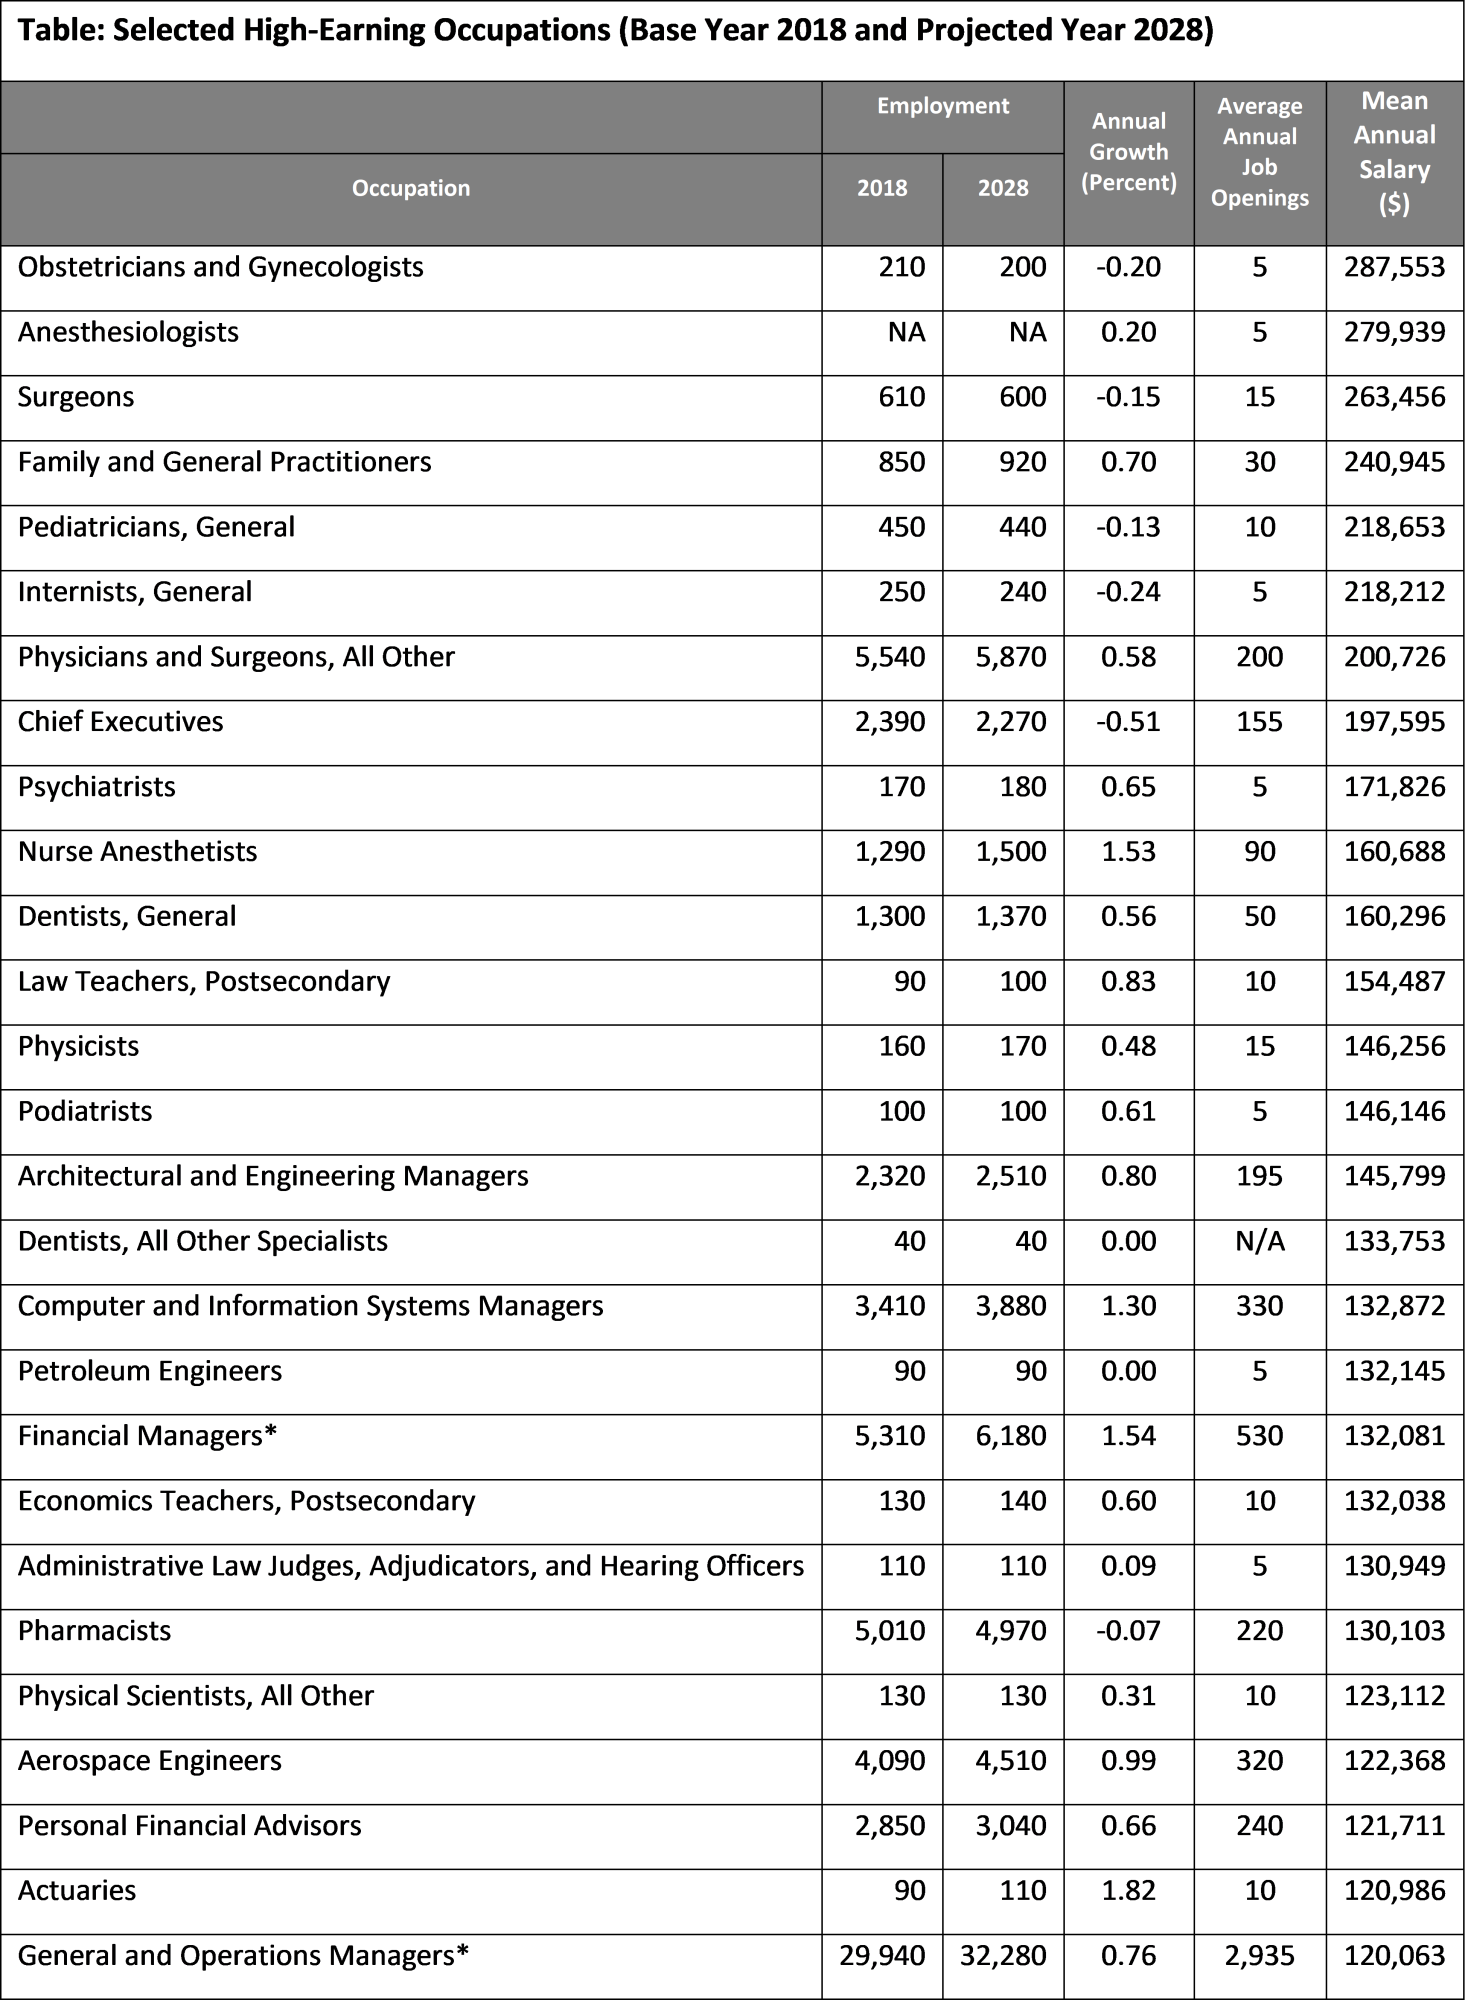
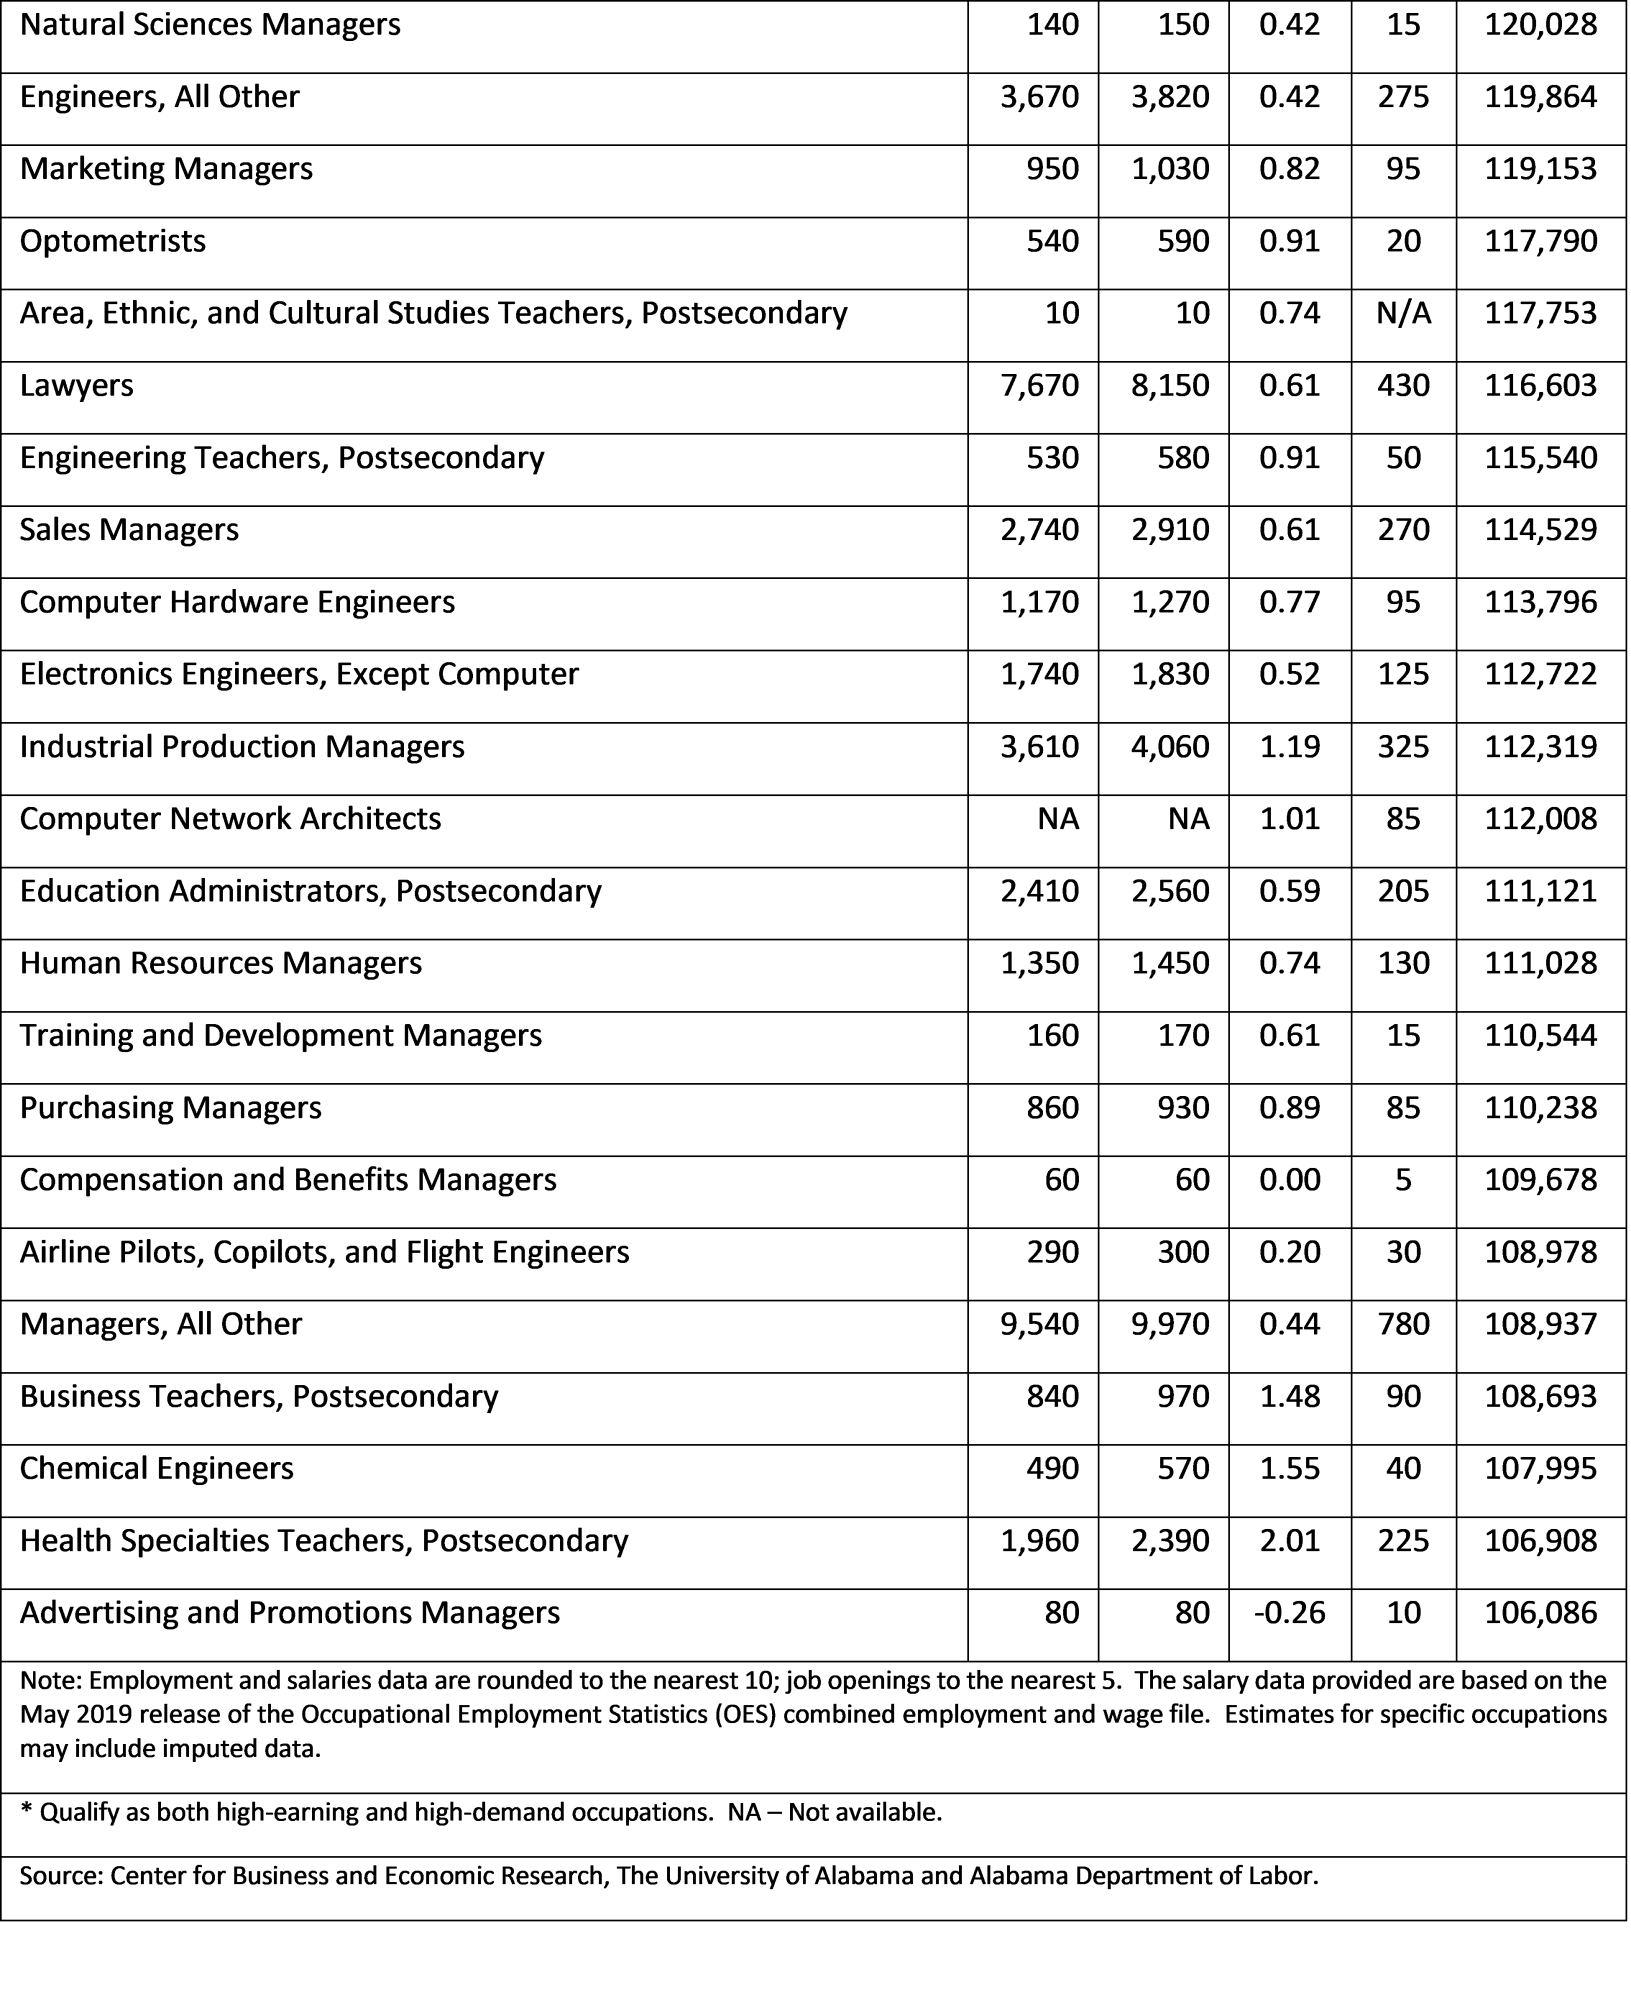
The average monthly wage across all industries in the state was $3,817. New hire monthly earnings averaged $2,489 or 65.2 percent of the average monthly wage. The highest average monthly wages were for professional, scientific, and technical services at $6,146; utilities at $6,124; mining at $6,116; and finance and insurance at $5,486. Accommodation and food services paid the least at $1,620. Mining had the highest average monthly new hire wage at $5,411, followed by professional, scientific, and technical services at $4,877 and utilities at $4,649. Accommodation and food services paid newly hired workers the least, $1,163.
The leading employers were not the highest paying sectors. Of the top five employers, only manufacturing paid wages above the state average. The highest wages were in small employers—mining; professional, scientific, and technical services; utilities; and finance and insurance.
At 21.8 percent, older workers (age 55 and over) constitute a significant and growing part of total nonagricultural employment. The share of older workers for the WDRs ranged from 20.6 percent for Region 3 to 23.2 percent for Region 6. To meet long term occupational projections for growth and replacement, labor force participation of younger residents must increase; otherwise, older workers may be required to work longer.
(iii) Education and Skill Levels of the Workforce
Based on 2017 census figures, 85 percent of the population over age 25 had a high school diploma, but only approximately 33 percent had an associate degree or higher. Furthermore, over 100,000 individuals never received a high school diploma or equivalent, making it nearly impossible in the present day to gain employment. A study initiated by the Alabama Workforce Council estimated that another 16 percent of individuals had some type of credential of value or license, which typically requires some amount of postsecondary training after high school. Using data from multiple sources, the study found that Alabama’s present postsecondary attainment level for individuals age 25-64 was approximately 43 percent, when accounting for those with licenses and credentials. In order to meet the demand for the workforce through 2026, postsecondary attainment for working age individuals in the state will need to reach over 50 percent. Due to the older population outpacing the high school age, there is a great need to recruit individuals in that 25-64 age group for additional training and upskilling, so workforce demands can be realized.
In 2016, only 32.0 percent of the people worked in occupations that required formal education beyond high school. In other words, only 32.0 percent of 2016 jobs required at least some college or postsecondary award or certification to qualify them to enter employment. However, around half the people in jobs that didn’t require formal training, high school diploma or less, were still required to successfully complete some level of moderate to long term training to learn the specific duties of the job. When looking at the projected employment through 2026, the state is expected to grow 6.9 percent. Analyzing the projected growth by formal training categories, jobs requiring a master’s degree are expected to grow the most at 13.4 percent, significantly higher than the state average. Furthermore, all categories from postsecondary non-degree award all the way through a doctoral or professional degree are expected to grow at a rate higher than the state average. This is the norm throughout the country. Those jobs only requiring a high school diploma or less are projected to grow near 5.7 percent over the period.
Looking at projected growth by on-the-job training requirements, jobs requiring internships/residencies are projected to grow faster than the state average, at 7.3 percent. In 2016, in Alabama, the average salary for workers in jobs requiring an associate degree ($51,787) surpassed the state average for all occupations at $43,790. The data also proves that work experience pays more; people holding jobs that required work experience to enter the occupation, received higher than the average wage for all occupations in the state. Those requiring at least five years of work experience received over double the salary of the state average.
In recent years, national attention has been drawn to skills requirements for jobs. Employers can’t find people with the skills to fill their open positions. Often employers and public officials will use the term “high skilled jobs” or that they can’t find skilled people to fill these jobs. The understanding is that these gaps are often in skilled trades that do require training past high school, some more intensive than others, but don’t require as high as a bachelor’s degree to enter the job and be successful. Some researchers have begun using terms such as low skill, medium skill, and high skill jobs. Low skill are jobs that require a high school diploma or GED or less and no further training to enter the occupation. High skill jobs require a bachelor’s degree or higher. Medium skill jobs have become the focus of workforce development efforts. These are jobs that may not require a degree, but do require at least some training after high school, whether it’s extensive on the job training, or a certification, license, or apprenticeship, or maybe an associate degree. Alabama is experiencing a tremendous challenge filling these middle skilled jobs. Over a third of the jobs in Alabama fall into this category. Furthermore, in ADOL’s top forty high demand occupations for the 2016-2026 projection period, there are more people currently employed in high-demand medium-skill jobs than in high- and low-skilled jobs combined. This means that there will be more growth- and replacement-related openings in medium-skill jobs than in high- and low-skilled jobs combined. Medium skilled high demand jobs alone are projected to create over 25,000 new jobs through 2026. These are the jobs that are important to fill, for these grow faster than average, produce many job openings, and provide a sustainable wage
(iv) Skill Gaps
With unemployment rates at a historical low, workforce skill gaps become more apparent. In 2018, the Alabama Workforce Council initiated a study on the state’s postsecondary educational attainment level to determine a strategy for increasing skilled workers. Research found that in 2017 Alabama’s postsecondary education attainment rate for individuals age 25-64 was 43 percent. Employment projections through 2025 indicate that the attainment level for all workers needs to be at 51 percent to meet occupational demand. Another challenge the state faces is many experienced workers who will soon retire out of the workforce. There are currently over 100,000 workers 65 and older. While some of these may be just working part time to supplement retirement benefits, a majority have not retired yet. Slightly over 300,000 workers are between ages 55 and 64. Furthermore, many young people, who obtain advanced degrees in Alabama, leave the state for better opportunities and higher wages. The state must develop strategies to increase the labor force participation rate and keep Alabama’s best and brightest in the state.
Preliminary figures show that the 2018 high school graduation rate in Alabama was 90 percent, increasing from 87 percent in 2016. While reaching 90 percent is significant, leaders in higher education and industry are concerned about the graduates who are not college and career ready (CCR). Graduates are classified as college and career ready in Alabama if they meet at least one of the following standards: 1. Score college ready in at least one subject on the ACT 2. Score silver level or higher on WorkKeys assessment 3. Passing score on an Advanced Placement Exam 4. Earn a career technical education credential 5. Earn dual enrollment credit at a college. 6. Acceptance into Military service. In 2016 there was over a 20 percent gap in the percent of high school graduates (87 percent) and college and career readiness (66 percent). Over two years, CCR rate has increased nearly 10 percent, to 75 percent, and narrowed the gap between CCR rate and graduation rates down to approximately 15 percent. Generally, school systems with lower CCR rates also had lower graduation rates. Systems with exceptionally high gaps between CCR and graduation rates may call for state assistance. Systems with the highest gaps tend to appear in rural counties.
Another challenge is the high rate of students are required to take remedial Math and/or English classes when entering college. In 2018 over 6,000 students, who graduated from public high schools in the state and enrolled in an Alabama college, had to take remedial Math and/or English; 5,000 in Math. 2017 data indicates that in 6 counties, all located in South Alabama, over 50 percent of the students enrolled in college had to take remedial classes; Barbour 69 percent, Butler 61 percent, Wilcox 57 percent, Bullock 55 percent, Crenshaw 53 percent, and Conecuh 51 percent. Data shows an even larger disparity when examining various subpopulations. During 2017-2018 school year, only 22.5 percent of African American students in 11th grade reached level 3 or 4 in Math on the Alabama Scantron ACT statewide. The high percentage of Alabama students required to take remedial classes beyond high school intensifies the gaps in decision making and problem-solving skills. Alabamians who are weak in the basic math and English skills will be less likely to be able to apply these to everyday workplace decisions.
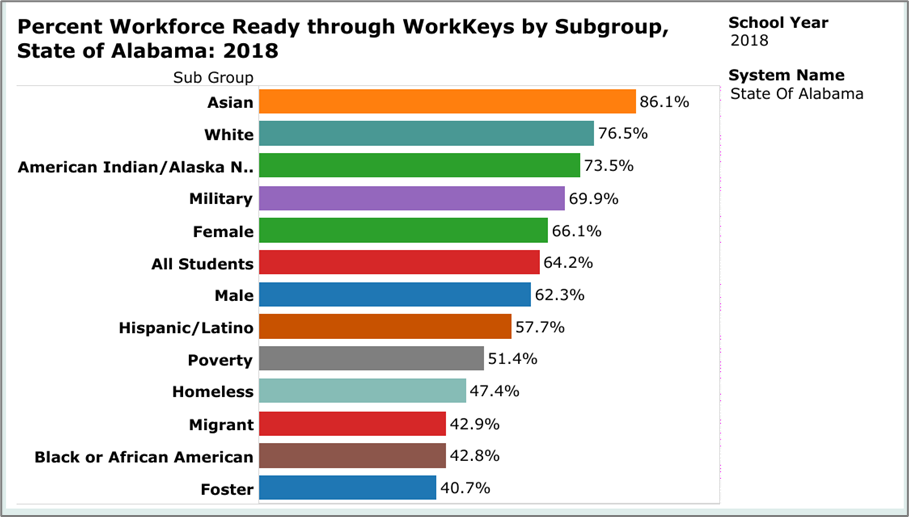
Since 2015, all 12th graders in Alabama’s public high schools are given the WorkKeys Assessment, which measures skills proficiency in relation to today’s work environment. It consists of 3 tests; Applied Math, Graphic Literacy, and Workplace Documents. Students receive varying levels of certificates, Bronze, Silver, Gold or Platinum, based on their scores. Bronze certificate indicates that the student should be ready for 16 percent of jobs, while the highest certificate, Platinum, signifies that he student has demonstrated applied skills for 96 percent of the occupations in the ACT database. In Alabama, students earning a Silver, Gold, or Platinum certificate, are deemed as workforce ready; prepared for at least 71 percent of jobs. Since 2015, Alabama 12th graders have shown a slow but steady increase, with 59 percent workforce ready in 2015 and 64 percent in 2018. Students in 15 of the state’s 67 counties had workforce readiness below rates below 50 percent, 5 below 30 percent; Greene, Wilcox, Perry, Bullock, and Sumter. The lowest scores were apparent in the most rural counties in the state. A statewide examination of workforce readiness by demographic subgroups clearly shows disparity in workforce readiness among groups with barriers to successful employment. Less than 50 percent of Homeless, migrant, African American, and students in foster care scored as workforce ready on the WorkKeys assessment.
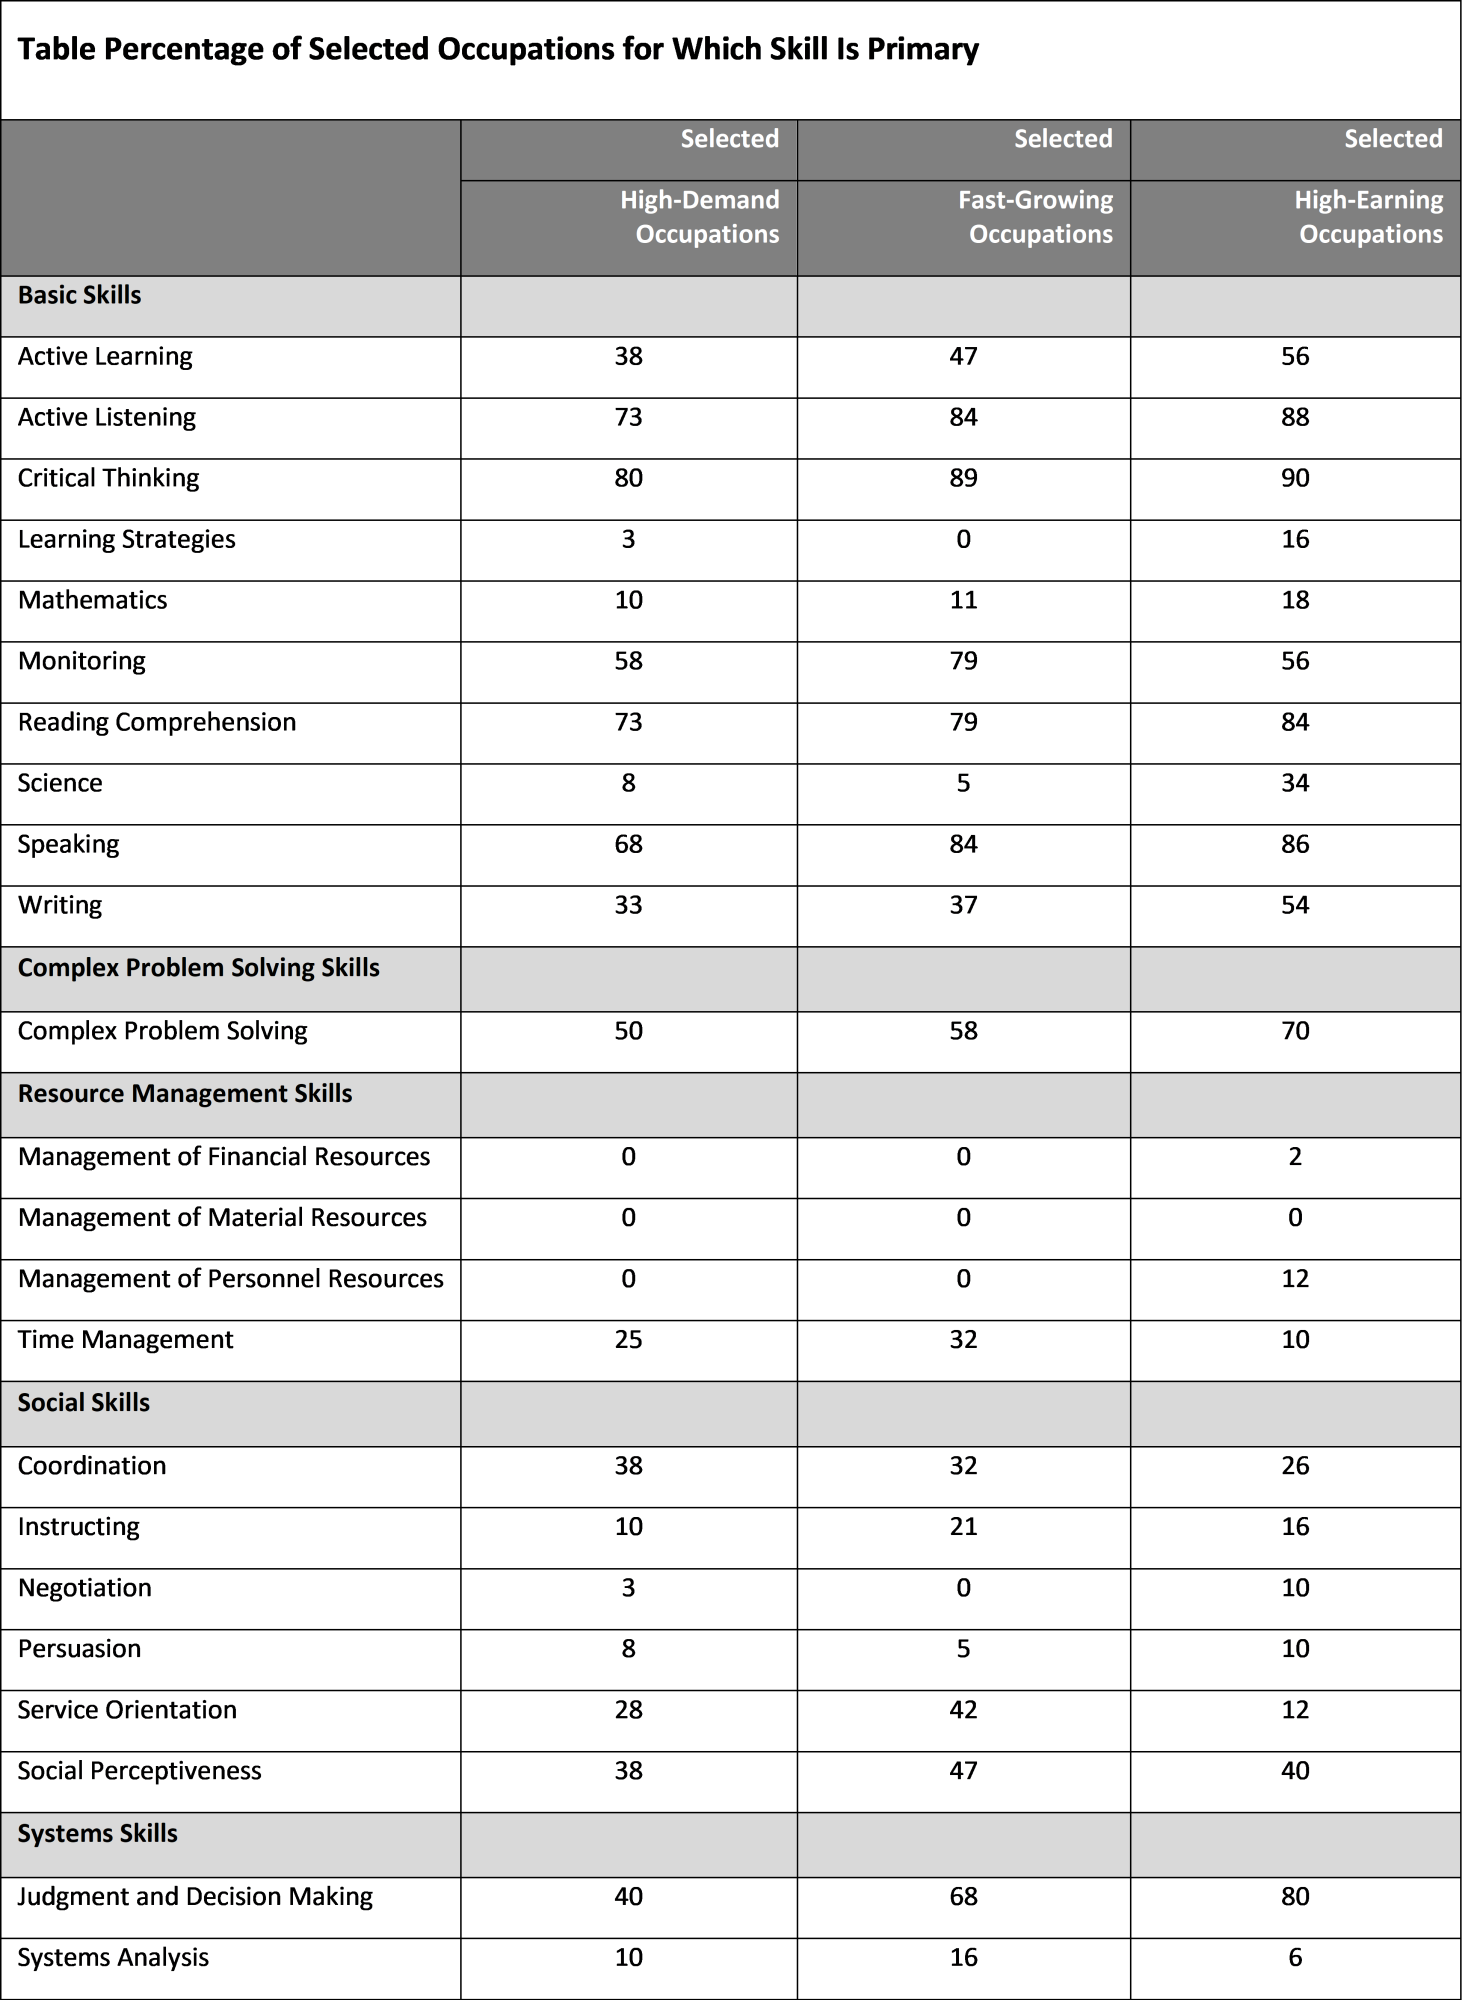
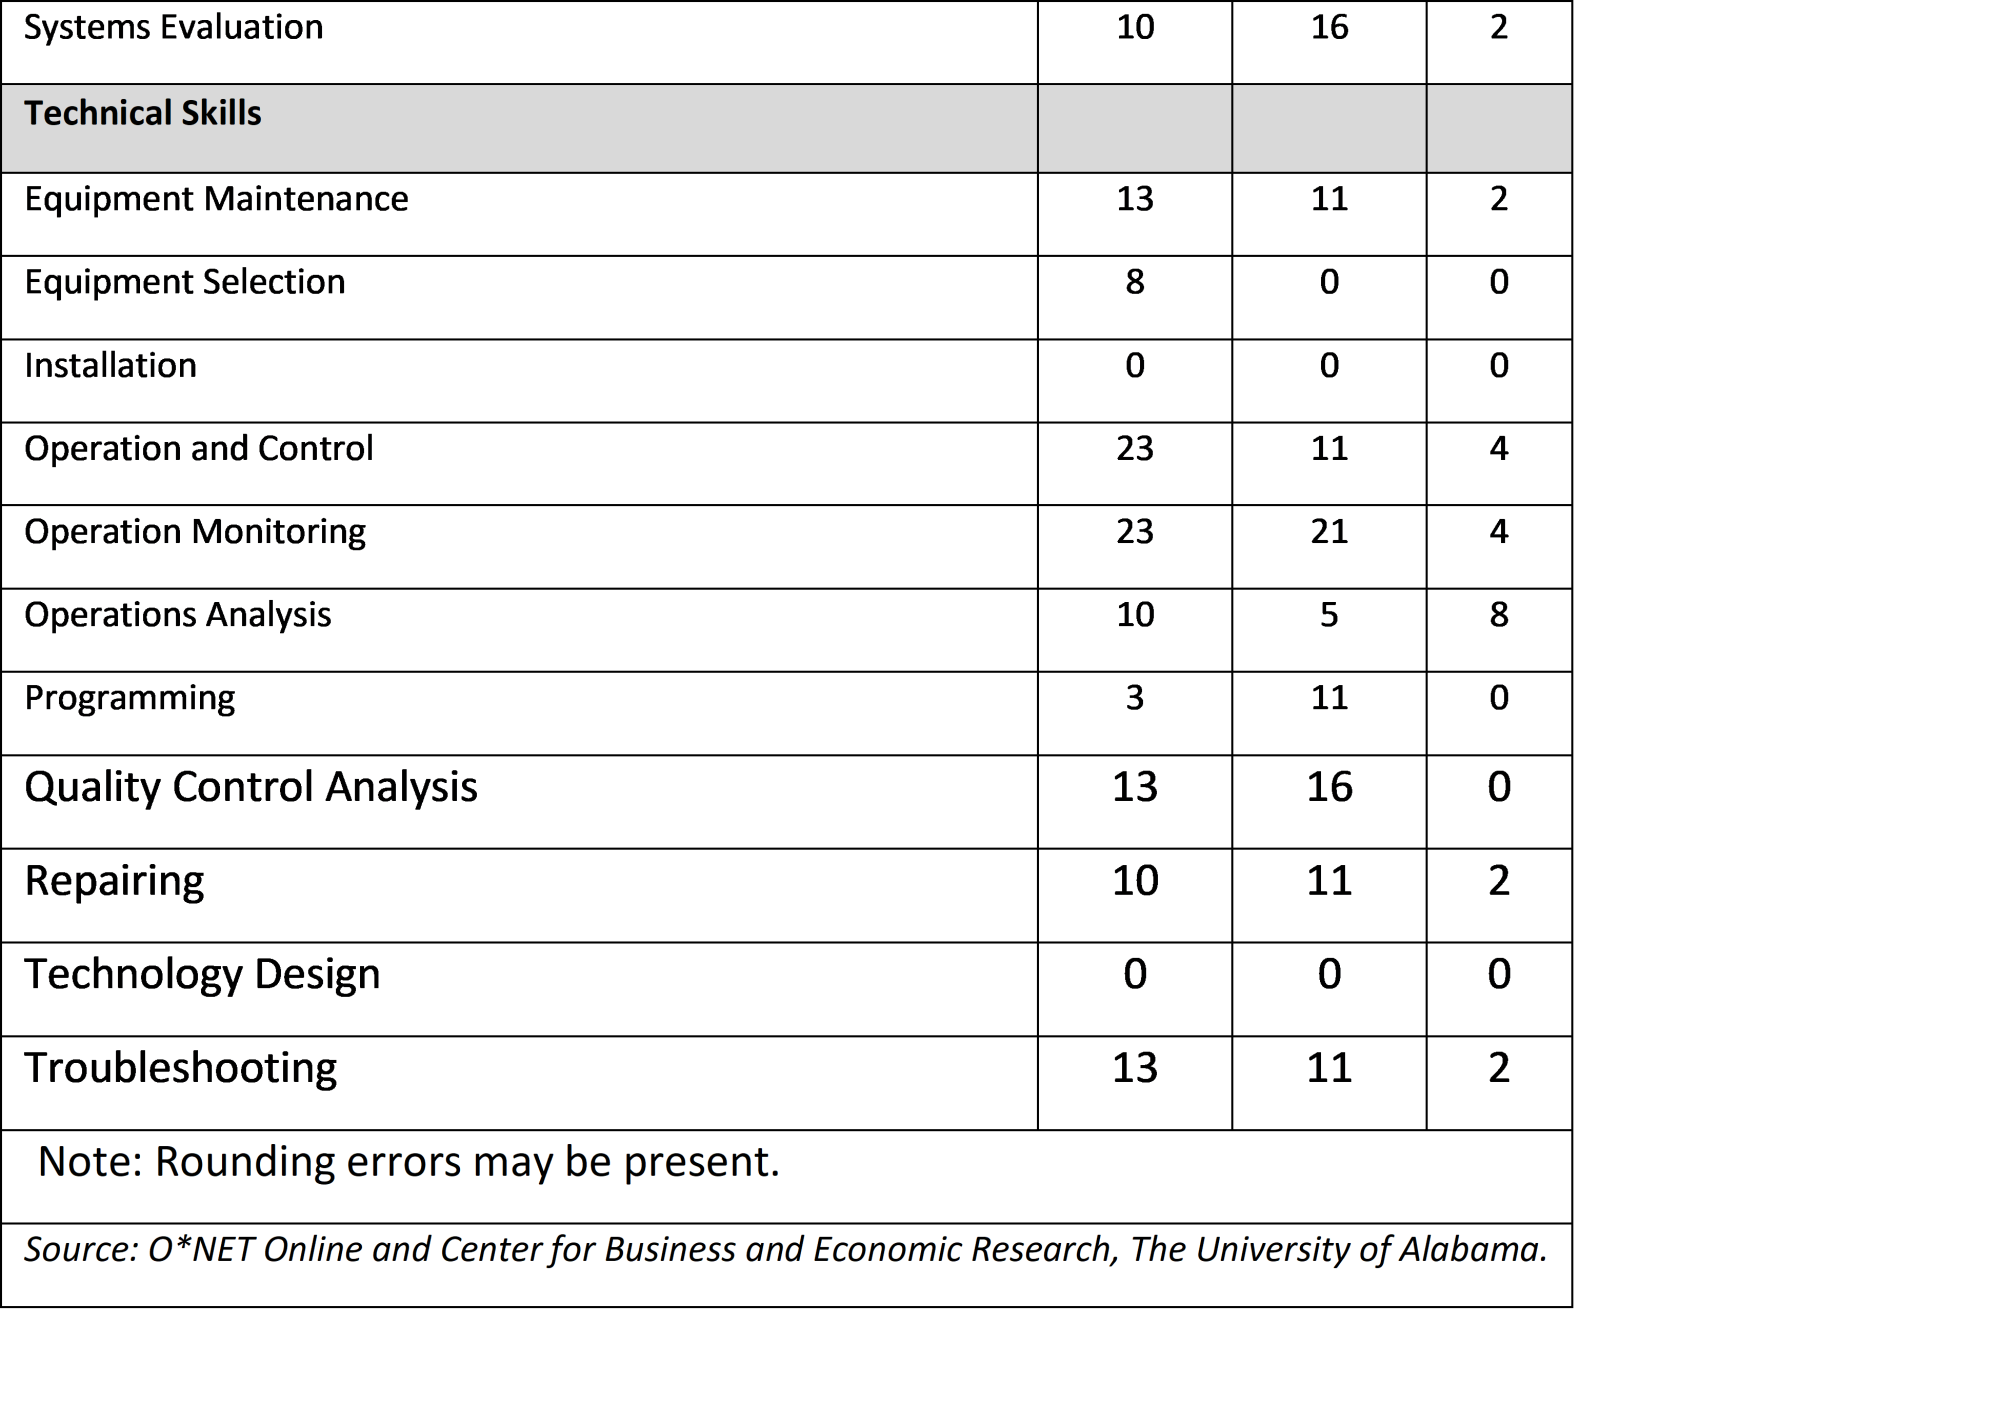
Using the O*NET database, skills were matched to three significant occupational categories from the 2016-2026 projections; high demand, fast growing, and high wage. The table below displays the percentage of the respective occupations in each category where the skill is classified as a primary skill, which is defined as one of the ten skills with the highest importance scores, according to O*NET. Basic skills are required across all occupations as the scores show. The biggest similarity between these three different sets of occupations is all three totals listed the same basic skill with the highest score: critical thinking. Generally, the remaining five skills categories displayed some significant differences across these occupational lists. The high wage occupations had much higher scores in complex problem solving as well as judgement and decision making. Technical skills scores appeared notably higher across the high demand and fast-growing occupations, as opposed to those in high wage occupations all below a score of 8. Another interesting finding is that the high demand and fast-growing occupations had higher scores in time management than the high wage occupations. These are important indications of skill demands in the coming years. The occupations in greatest demand are going to require significant technical and time management skills, while the highest wage occupations in the state require more problem solving and decision making.