


Located in:
- II. Strategic Elements
The Unified or Combined State Plan must include a Strategic Planning Elements section that analyzes the State’s current economic environment and identifies the State’s overall vision for its workforce development system. The required elements in this section allow the State to develop data-driven goals for preparing an educated and skilled workforce and to identify successful strategies for aligning workforce development programs to support economic growth. Unless otherwise noted, all Strategic Planning Elements apply to Combined State Plan partner programs included in the plan as well as to core programs. Where requirements identify the term “populations”, these must include individuals with barriers to employment as defined at WIOA Section 3. This includes displaced homemakers; low-income individuals; Indians, Alaska Natives, and Native Hawaiians; individuals with disabilities, including youth who are individuals with disabilities; older individuals; ex-offenders; homeless individuals, or homeless children and youths; youth who are in or have aged out of the foster care system; individuals who are English language learners, individuals who have low levels of literacy, and individuals facing substantial cultural barriers; farmworkers (as defined at section 167(i) of WIOA and Training and Employment Guidance Letter No. 35-14); individuals within 2 years of exhausting lifetime eligibility under the Temporary Assistance for Needy Families program; single parents (including single pregnant women); and long-term unemployed individuals. Additional populations include veterans, unemployed workers, and youth, and others that the State may identify.
- a. Economic, Workforce, and Workforce Development Activities Analysis
The Unified or Combined State Plan must include an analysis of the economic conditions, economic development strategies, and labor market in which the State’s workforce system and programs will operate.
- a. Economic, Workforce, and Workforce Development Activities Analysis
II. a. 1. B. Workforce Analysis
The Unified or Combined State Plan must include an analysis of the current workforce in the State and within various state regions. Provide key analytical conclusions in aggregate as well as disaggregated among populations to identify potential disparities in employment and educational attainment and understand labor force conditions for items (i)-(iii) below. Populations analyzed must include individuals with barriers to employment described in the first paragraph of Section II. Analysis must include—
i. Employment and Unemployment
Provide an analysis of current employment and unemployment data, including labor force participation rates, and trends in the State.
ii. Labor Market Trends
Provide an analysis of key labor market trends, including across existing industries and occupations.
iii. Education and Skill Levels of the Workforce
Provide an analysis of the educational and skill levels of the workforce.
Current Narrative:
(i) Employment and Unemployment
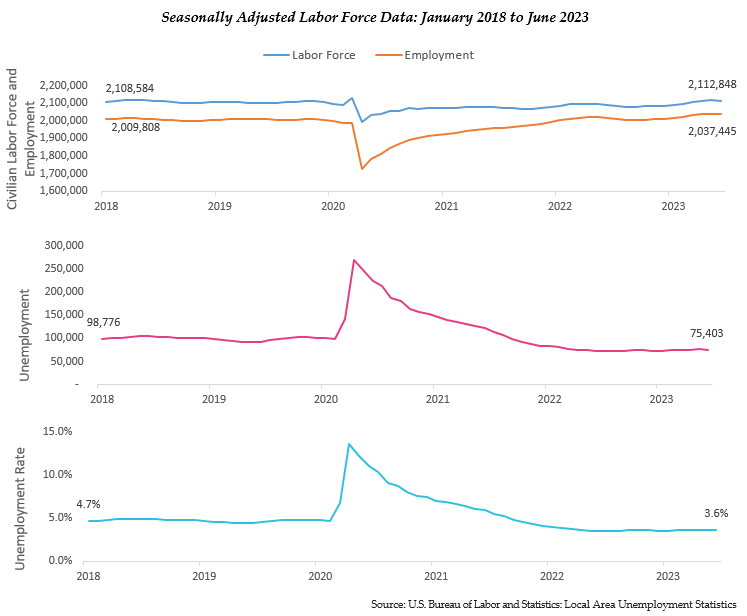
Between January 2018 and June 2023, Louisiana exhibited an increase in the civilian labor force and total employment, according to seasonally adjusted household survey data. Louisiana’s unemployment rate decreased from 4.7% to 3.6% during this time.
- Civilian labor force increased from 2,108,584 to 2,112,848.
- Employment increased from 2,009,808 to 2,037,445.
- Unemployment decreased from 98,776 to 75,403.
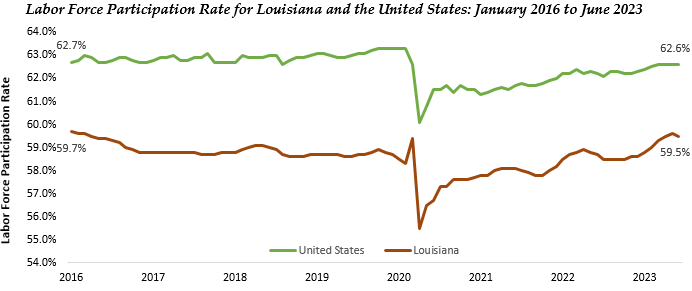
- Given that Louisiana's labor force participation rate was 3.0 percentage points below the national average in January 2016, and still lagged by 3.1 percentage points in June 2023, it is crucial to concentrate efforts on improving this metric. Despite recovering to its "natural" rate, the state's consistent underperformance compared to the national average, even after adjusting for the pandemic's impact, highlights a persistent challenge. Addressing this gap is vital for strengthening the state’s economic resilience and enhancing workforce engagement. This effort will not only help match or surpass national employment standards but also foster a more robust and inclusive economy in Louisiana.
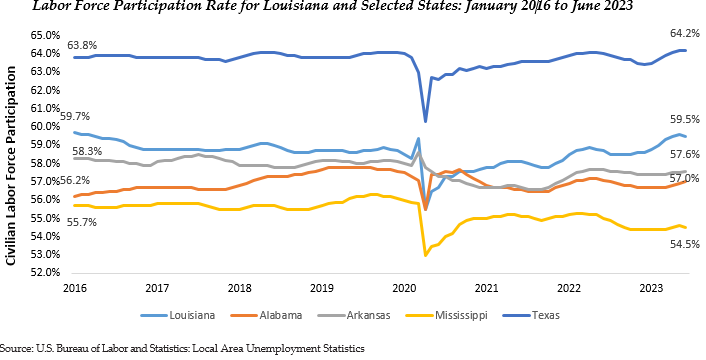
- This chart below shows the percent change in the size of the labor force for southern states since 2015. Louisiana’s labor force has decreased by 2.4 percentage points since 2016. Some other southern states have experienced similar reductions.
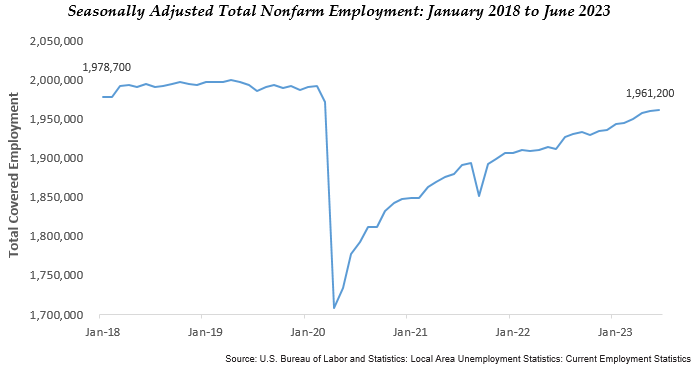
- According to the Current Employment Statistics survey, Louisiana nonfarm employment decreased from 1,990,800 in January 2020 to 1,961,200 in June 2023, which is 1.5 percent decrease. However, nonfarm employment has increased from the 1,708,600 figure in April 2020, the lowest figure during the pandemic, which is a 14.8 percent increase.
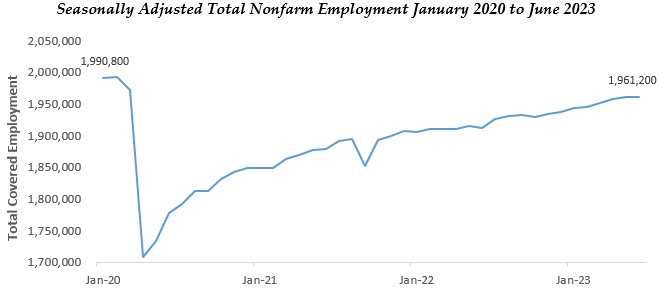
- Due to the pandemic, Louisiana’s total nonfarm employment fell by 263,600 jobs in April 2020 and has recovered 252,600 jobs from the figures in April 2020 to June 2023.
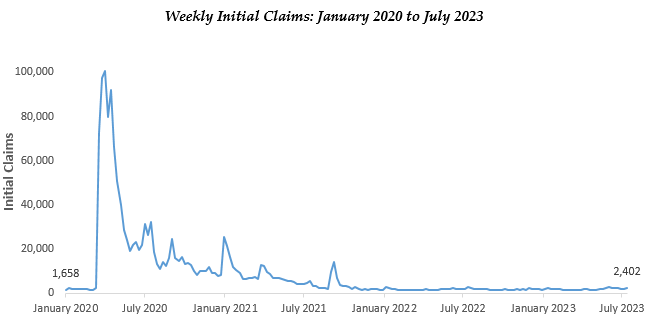
- The chart below displays the changes in weekly initial claims filed over a three-year period. During the recovery from the COVID-19 pandemic effects, levels of claims have decreased to 2,402 as of July 2023.
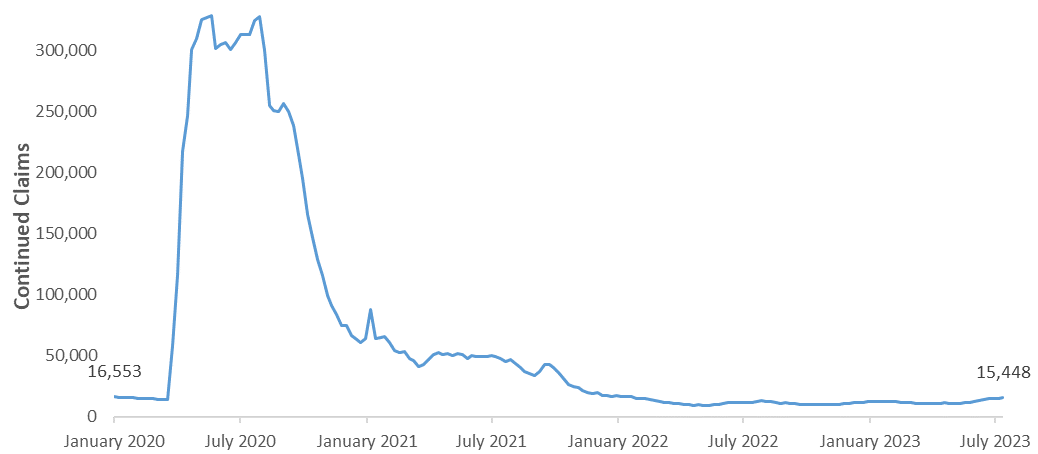
- Louisiana’s number of continued claimants spiked to historically high levels in April 2020 and subsequent months. Continued claims have since decreased significantly, reaching below pre-pandemic levels as of July 2023.
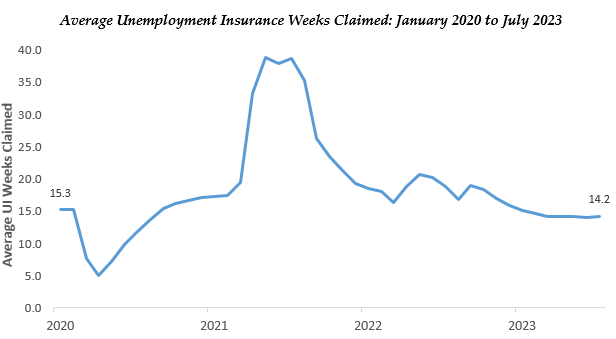
- The chart shows the average number of weeks of benefits claimed by unemployment insurance claimants. The average weeks claimed was 14.2 weeks in July 2023.
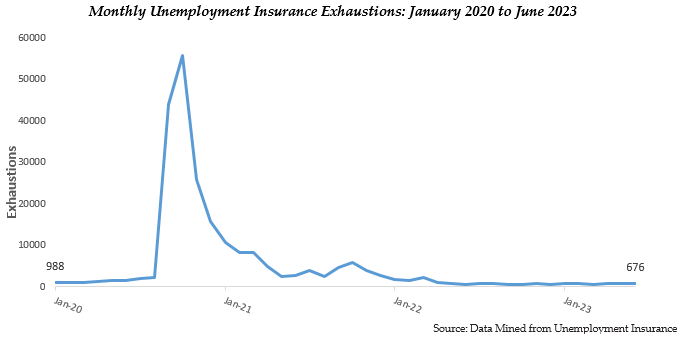
- Monthly unemployment insurance exhaustions data further emphasizes the weakness of the labor market due to the pandemic when claims exhaustions were their highest as 55,831 in October 2020. This data also displays the resilience of the labor force into recovery as exhaustions have decreased to 676 as of June 2023, reaching below pre-pandemic levels.
Continued Claims Filed by Parish between March 1, 2020 and August 15, 2023
| Orleans | 105,397 | Jefferson | 99,267 | East Baton Rouge | 97,378 |
|---|---|---|---|---|---|
| Caddo | 47,294 | Lafayette | 46,795 | Calcasieu | 43,972 |
| Saint Tammany | 43,811 | Tangipahoa | 30,336 | Ouachita | 26,821 |
| Livingston | 24,544 | Terrebonne | 21,520 | Ascension | 21,689 |
| Rapides | 18,438 | Bossier | 18,102 | Saint Landry | 14,914 |
| Lafourche | 14,142 | Iberia | 13,616 | St John The Baptist | 10,681 |
| Saint Bernard | 10,337 | Acadia | 9,335 | Saint Mary | 9,307 |
| Saint Charles | 9,096 | Vermilion | 9,122 | Saint Martin | 8,543 |
| Washington | 7,546 | Lincoln | 6,720 | Iberville | 6,252 |
| Avoyelles | 6,067 | Webster | 5,469 | Natchitoches | 5,393 |
| West Baton Rouge | 4,991 | Jefferson Davis | 4,809 | Vernon | 4,860 |
| Beauregard | 4,816 | Morehouse | 4,606 | Evangeline | 4,556 |
| Plaquemines | 3,961 | Saint James | 3,992 | De Soto | 3,717 |
| Allen | 3,622 | Assumption | 3,515 | Pointe Coupee | 3,486 |
| Richland | 2,908 | Union | 2,851 | East Feliciana | 2,756 |
| Concordia | 2,683 | Franklin | 2,642 | Grant | 2,332 |
| Sabine | 2,329 | Jackson | 1,932 | Bienville | 1,877 |
| Winn | 1,478 | La Salle | 1,435 | Saint Helena | 1,322 |
| West Feliciana | 1,284 | Claiborne | 1,339 | Catahoula | 1,294 |
| Madison | 1,269 | West Carroll | 1,190 | Caldwell | 1,164 |
| East Carroll | 1,008 | Red River | 994 | Cameron | 516 |
| Tensas | 462 |
Source: Data Mined from Unemployment Insurance Claims
- The distribution of unemployment insurance claims across Louisiana from March 1, 2020, to August 15, 2023, reveals a clear correlation between population density and the volume of claims. Larger metropolitan areas such as Orleans, Jefferson, and East Baton Rouge Parishes top the list with claims exceeding 97,000 each, reflecting the significant impact of economic disruptions in densely populated regions. In contrast, rural parishes like Tensas and Cameron, with claims as low as 462 and 516 respectively, show far fewer filings, which is indicative of their smaller workforce sizes.
This pattern underscores the greater vulnerability of urban labor markets to economic shocks, possibly due to higher concentrations of industries such as services and manufacturing that may be more susceptible to layoffs during downturns. Conversely, the lower number of claims in rural areas might reflect a smaller, perhaps more stable, agricultural-based or local-centric economy. Understanding these dynamics is crucial for targeted economic and employment policies, especially in preparing for and responding to economic crises that disproportionately affect larger urban areas.
Worker Profiling and Reemployment Services (WPRS) Model
Changes to the U.S. economy—including the contraction of entire industries as a result of changes in technology and overseas competition—have led to increases in the length of unemployment. Unemployed workers are now less likely to be rehired by their previous employers and are at a greater risk of long-term unemployment than in the past. As a result, the Worker Profiling and Reemployment Services (WPRS) system was established nationwide following the 1993 enactment of PL 103-152. Profiling is designed to identify UI claimants who are most likely to exhaust their regular benefits, so that they may receive reemployment services that will help them find a job more quickly.
Louisiana Workforce Commission’s Labor Market Information developed a model for profiling all new claimants for regular UI benefits. The WPRS system strengthens the link between Unemployment insurance and Employment Services for those most likely to exhaust benefits. The worker profiling model for Louisiana helps us achieve the objectives of reducing the weeks of UI benefits, reducing UI benefits per beneficiary, increasing earnings per beneficiary, and providing a management tool for targeting resources and aiding staff in understanding the customers they serve.
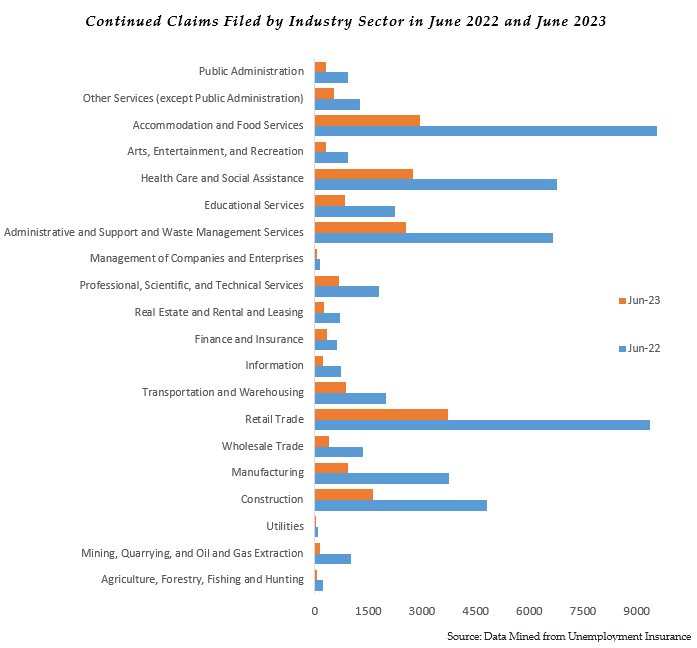
This chart shows the contribution of each industry sector to continued claims in June 2022 and June 2023. Retail Trade had the largest number of continued claims filed with 853 claims in Juned 2022 and 1,013 continued claims filed in June 2023. Health Care and Social Assistance has the second largest number of claims filed with 839 claims in June 2022 and 1, 030 claims in June 2023. All industries, except Utilities and Educational Services, experienced some increase in the levels of continued claims filed from June 2022 to June 2023.
(ii) Labor Market Trends
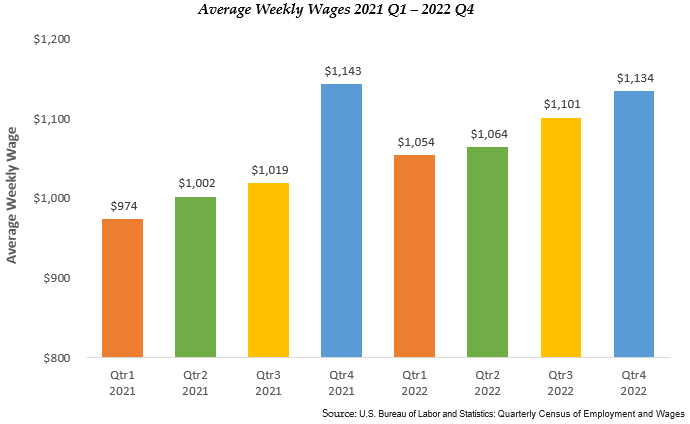
- The average weekly wage in Louisiana has continued to increase since 2015 and weekly wages tend to be highest in Quarter 4 of each year. Workforce composition and changes in distribution will change the average weekly wage value as well as changes in average hours worked by hourly employees. This is why we see seasonal changes in the average weekly wage.
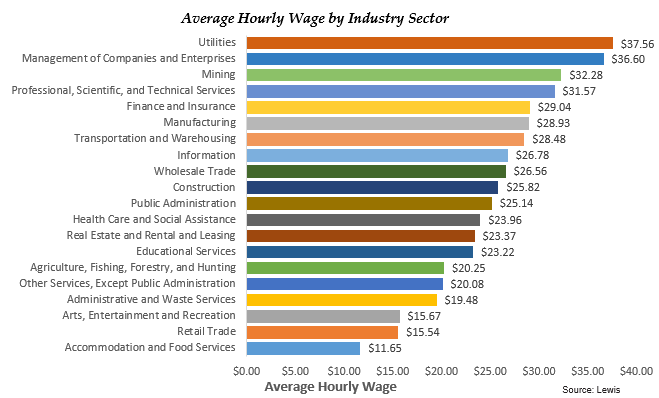
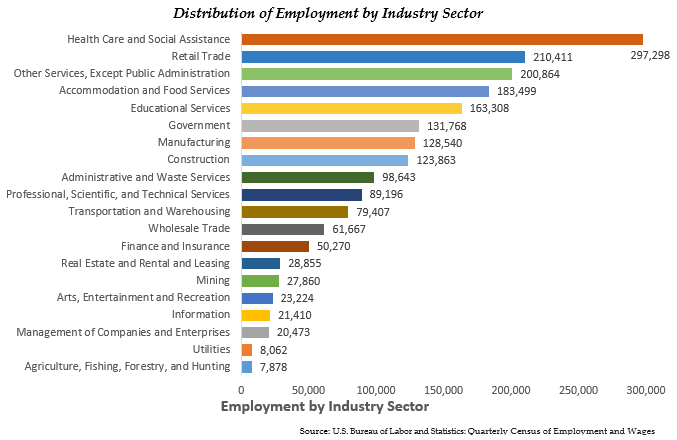
- The Quarterly Census of Employment and Wages (QCEW) provides information on industries, which support Louisiana’s economy. The following charts represent industry sector information as of 2022 Q1. The first chart represents the average hourly wage earned in each industry sector. The second chart represents the distribution of state employment by industry sector.
- Accommodation and Food Services is the third largest industry sector employer (183,499 employees) in the state and pays the lowest average hourly wage of $11.65 an hour. Retail trade (210,411 employees) is the second largest employer in the state and pays the second lowest average hourly wage of $15.54 an hour. The largest industry employer is Healthcare and Social Assistance (297,298 employees) and pays an average hourly wage of $23.96.
(iii) Education and Skill Levels of the Workforce
- The educational attainment data for Louisiana's population aged 18 to 24 reveals distinct trends that reflect both the demographic’s stage in life and their educational pursuits. The relatively low percentage (8.5%) of individuals who have obtained a Bachelor’s degree or higher can be largely attributed to the fact that many within this age group are still engaged in their higher education journeys. Conversely, a substantial 40.7% of this cohort reports having some college education or an Associate’s degree, indicating a significant number are currently enrolled in postsecondary education or have completed a two-year degree.
- The data also shows that 13.8% of the young population has not completed high school, highlighting ongoing educational challenges. Meanwhile, 37.0% have completed high school, including equivalencies, which marks a significant transition point, potentially guiding future decisions about entering the workforce or continuing education.
- These statistics underscore the importance of supporting educational and career guidance programs targeted at this age group, to enhance higher education enrollment and completion rates, and to address barriers faced by those with lower educational attainment levels.
| Population 18 to 24 years | Percent |
|---|---|
| Less than high school graduate | 13.8% |
| High school graduate (includes equivalency) | 37.0% |
| Some college or Associate's degree | 40.7% |
| Bachelor's degree or higher | 8.5% |
Source: U.S. Census American Community Survey 2022 1-year estimates, Table S1501
- The educational attainment levels of Louisiana's adult population aged 25 and over indicate that a significant majority have pursued education beyond high school. Notably, more than half of the adults have engaged in some form of higher education—either completing some college coursework without attaining a degree (20.5%), obtaining an Associate's degree (7.2%), or earning higher degrees such as a Bachelor's (17.0%) or a graduate or professional degree (10.2%).
- However, there remains a portion of the population (12.7%) that has not completed high school, which might limit their job opportunities and economic potential. High school graduates, including those with equivalency degrees, constitute 32.5% of the population, indicating that while a substantial number have basic secondary education, advancing beyond this level could provide more significant economic benefits.
- These statistics emphasize the importance of access to and the promotion of higher education, as the data suggests that higher educational attainment correlates with broader career options and potential for economic advancement. Addressing the educational needs of those without a high school diploma and encouraging further education among high school graduates could significantly impact individual well-being and overall economic health in Louisiana.
| Population 25 years and over | Percent |
|---|---|
| Less than high school graduate | 12.7% |
| High school graduate (includes equivalency) | 32.5% |
| Some college, no degree | 20.5% |
| Associate's degree | 7.2% |
| Bachelor's degree | 17.0% |
| Graduate or professional degree | 10.2% |
Source: U.S. Census American Community Survey 2022 1-year estimates, Table S1501
- The data on Louisiana veterans aged 18 to 64 reveals a robust engagement with the labor market. Notably, a significant 73.4% of these veterans are active participants in the labor force, which is commendable. This high participation rate is reflective of the proactive nature of veterans in seeking employment or being employed. Moreover, the employment rate among these veterans is impressively high at 96.5%, indicating that most of the veterans who are in the labor force are successfully employed.
- However, there is a small segment (3.5%) of the veteran labor force that is unemployed, suggesting that while most find work, there are still challenges to achieving full employment for all veterans. Additionally, 26.6% of veterans are not participating in the labor force, which could be due to a variety of factors including retirement, disability, or other personal reasons.
- Given that veterans constitute 3.8% of Louisiana’s overall population, these figures underscore the importance of targeted support programs to aid veteran employment and address any barriers they face in the labor market. The overall high rates of participation and employment among veterans speak to their significant contributions to the workforce, yet the existence of any unemployment highlights a need for continued supportive measures.
| Labor Force Status | Percent |
|---|---|
| Population | 3.8% |
| Labor Force Participation Rate | 73.4% |
| Employed | 96.5% |
| Unemployed | 3.5% |
| Not in Labor Force | 26.6% |
Source: U.S. Census American Community Survey 2022 1-year estimates, Table 21005
- Louisiana's incarceration rate stands significantly higher than the national average, marking it as the state with the most pronounced rate of imprisonment in the U.S. With 581 individuals per 100,000 residents incarcerated as of 2020, Louisiana's rate far exceeds the national rate of 357 per 100,000. This disparity points to Louisiana's tougher sentencing laws or more stringent criminal justice policies compared to other states.
- Despite having the highest imprisonment rate, Louisiana's total prison population constitutes only 2.2 percent of the entire U.S. prison population, which numbered 1,204,322 in 2020. This indicates that while the rate of imprisonment per capita is extremely high, the absolute number of incarcerated individuals is relatively small due to the overall smaller population of the state.
- This information underscores critical areas for policy review and potential reform within Louisiana's criminal justice system. It suggests a need for examining the factors contributing to such high rates of incarceration, including the nature of offenses leading to imprisonment and the sentencing policies in place. Reducing the incarceration rate not only aligns with broader criminal justice reform efforts but could also have significant social and economic impacts for the state.
| Jurisdiction | Imprisonment Rate | Total Prison Population |
|---|---|---|
| National Statistics (US Total) | 357 | 1,204,322 |
| Louisiana | 581 | 26,074 |
Source: U.S. Department of Justice - Bureau of Justice Statistics: Prisoners in 2021, Table 1 & 7
- In Louisiana, the proportion of the employed population aged 18-64 years living with disabilities is relatively high at 8.2%. The data further reveals a more pronounced representation of individuals with disabilities among the unemployed (16.4%) and those not in the labor force (32.3%). This indicates significant barriers that individuals with disabilities face in securing and maintaining employment.
- Examining specific disabilities, those with cognitive difficulties have the highest rates of unemployment (52.0%) and are also highly represented among those not in the labor force (48.1%). This suggests that cognitive impairments might present substantial challenges in both job acquisition and retention. Conversely, individuals with hearing difficulties seem to have a slightly better employment scenario, with a lower percentage of unemployment and not in the labor force, compared to other disabilities.
- The data also underscores the challenges faced by those with ambulatory difficulties, as they have the highest percentage not in the labor force (58.0%), indicating possible physical barriers or inadequate workplace accommodations that hinder their employment opportunities.
- Overall, these figures highlight the need for focused policy interventions and support systems to facilitate access to employment for people with disabilities in Louisiana. Enhancements in workplace accommodations, increased availability of adaptive technologies, and targeted vocational training could be beneficial strategies to improve employment outcomes for this demographic.
| Disability Characteristic | Employed | Unemployed | Not in Labor Force |
|---|---|---|---|
| With a Hearing Difficulty | 24.1% | 17.5% | 15.0% |
| With a Vision Difficulty | 26.3% | 24.4% | 18.8% |
| With a Cognitive Difficulty | 37.0% | 52.0% | 48.1% |
| With an Ambulatory Difficulty | 26.9% | 31.2% | 58.0% |
| With a Self-Care Difficulty | 4.8% | 5.9% | 22.3% |
| With an Independent Living Difficulty | 15.1% | 25.4% | 45.1% |
*Disabilities are not mutually exclusive
Source: U.S. Census American Community Survey 2022 1-year estimates
| Disability | No Disability | |||||
|---|---|---|---|---|---|---|
| Parish | Total | Employed | %1 | Total | Employed | %2 |
| Louisiana | 374,682 | 126,746 | 33.8% | 2,376,718 | 1,738,180 | 73.1% |
| Acadia Parish | 6,030 | 1,765 | 29.3% | 27,748 | 19,579 | 70.6% |
| Allen Parish | 1,921 | 656 | 34.1% | 8,959 | 6,481 | 72.3% |
| Ascension Parish | 8,739 | 3,908 | 44.7% | 67,328 | 53,532 | 79.5% |
| Assumption Parish | 1,962 | 868 | 44.2% | 10,562 | 7,263 | 68.8% |
| Avoyelles Parish | 5,174 | 1,721 | 33.3% | 15,775 | 11,899 | 75.4% |
| Beauregard Parish | 3,949 | 880 | 22.3% | 17,226 | 12,362 | 71.8% |
| Bienville Parish | 1,392 | 250 | 18.0% | 5,894 | 3,645 | 61.8% |
| Bossier Parish | 8,241 | 3,092 | 37.5% | 65,117 | 46,911 | 72.0% |
| Caddo Parish | 19,898 | 5,413 | 27.2% | 119,002 | 84,134 | 70.7% |
| Calcasieu Parish | 15,201 | 4,789 | 31.5% | 111,056 | 82,348 | 74.1% |
| Caldwell Parish | 869 | 89 | 10.2% | 4,428 | 2,638 | 59.6% |
| Caldwell Parish | 869 | 89 | 10.2% | 4,428 | 2,638 | 59.6% |
| Cameron Parish | 343 | 161 | 46.9% | 3,032 | 2,172 | 71.6% |
| Catahoula Parish | 630 | 174 | 27.6% | 3,704 | 2,392 | 64.6% |
| Claiborne Parish | 872 | 336 | 38.5% | 6,484 | 4,012 | 61.9% |
| Concordia Parish | 2,061 | 327 | 15.9% | 7,655 | 4,642 | 60.6% |
| De Soto Parish | 2,734 | 829 | 30.3% | 12,698 | 8,485 | 66.8% |
| East Baton Rouge Parish | 35,176 | 14,987 | 42.6% | 248,965 | 188,126 | 75.6% |
| East Carroll Parish | 318 | 144 | 45.3% | 2,041 | 1,166 | 57.1% |
| East Feliciana Parish | 1,309 | 316 | 24.1% | 8,322 | 5,709 | 68.6% |
| Evangeline Parish | 4,467 | 1,391 | 31.1% | 13,769 | 9,610 | 69.8% |
| Franklin Parish | 1,262 | 282 | 22.3% | 9,106 | 5,938 | 65.2% |
| Grant Parish | 1,743 | 490 | 28.1% | 9,565 | 6,774 | 70.8% |
| Iberia Parish | 6,272 | 1,850 | 29.5% | 34,801 | 24,942 | 71.7% |
| Iberville Parish | 2,238 | 543 | 24.3% | 14,387 | 10,696 | 74.3% |
| Jackson Parish | 1,473 | 274 | 18.6% | 6,430 | 4,304 | 66.9% |
| Jefferson Davis Parish | 3,134 | 918 | 29.3% | 15,466 | 10,958 | 70.9% |
| Jefferson Parish | 33,905 | 13,833 | 40.8% | 228,971 | 177,094 | 77.3% |
| Lafayette Parish | 14,399 | 4,615 | 32.1% | 135,743 | 105,228 | 77.5% |
| Lafourche Parish | 8,893 | 2,618 | 29.4% | 50,304 | 37,086 | 73.7% |
| LaSalle Parish | 990 | 303 | 30.6% | 6,741 | 5,053 | 75.0% |
| Lincoln Parish | 3,286 | 998 | 30.4% | 28,411 | 19,032 | 67.0% |
| Livingston Parish | 9,001 | 2,645 | 29.4% | 76,308 | 57,185 | 74.9% |
| Madison Parish | 1,062 | 328 | 30.9% | 3,698 | 2,428 | 65.7% |
| Morehouse Parish | 2,011 | 596 | 29.6% | 12,076 | 7,663 | 63.5% |
| Natchitoches Parish | 2,612 | 385 | 14.7% | 19,529 | 11,552 | 59.2% |
| Orleans Parish | 28,729 | 9,814 | 34.2% | 215,748 | 153,300 | 71.1% |
| Ouachita Parish | 10,332 | 3,420 | 33.1% | 82,646 | 59,647 | 72.2% |
| Plaquemines Parish | 1,784 | 902 | 50.6% | 11,435 | 7,895 | 69.0% |
| Pointe Coupee Parish | 3,131 | 1,069 | 34.1% | 8,858 | 6,658 | 75.2% |
| Rapides Parish | 11,844 | 3,994 | 33.7% | 63,339 | 46,553 | 73.5% |
| Red River Parish | 891 | 218 | 24.5% | 3,489 | 2,506 | 71.8% |
| Richland Parish | 1,599 | 540 | 33.8% | 9,476 | 6,291 | 66.4% |
| Sabine Parish | 2,040 | 474 | 23.2% | 10,344 | 6,286 | 60.8% |
| St. Bernard Parish | 4,715 | 1,383 | 29.3% | 22,135 | 16,316 | 73.7% |
| St. Charles Parish | 4,208 | 1,901 | 45.2% | 27,584 | 20,938 | 75.9% |
| St. Helena Parish | 1,520 | 501 | 33.0% | 4,856 | 2,863 | 59.0% |
| St. James Parish | 1,096 | 463 | 42.2% | 10,955 | 7,908 | 72.2% |
| St. John the Baptist Parish | 3,396 | 967 | 28.5% | 22,009 | 15,788 | 71.7% |
| St. Landry Parish | 6,092 | 1,882 | 30.9% | 40,757 | 27,062 | 66.4% |
| St. Martin Parish | 3,822 | 665 | 17.4% | 27,560 | 20,222 | 73.4% |
| St. Mary Parish | 4,974 | 1,305 | 26.2% | 23,940 | 16,238 | 67.8% |
| St. Tammany Parish | 20,079 | 8,589 | 42.8% | 132,032 | 102,146 | 77.4% |
| Tangipahoa Parish | 15,762 | 5,419 | 34.4% | 64,395 | 46,935 | 72.9% |
| Tensas Parish | 181 | 43 | 23.8% | 2,027 | 912 | 45.0% |
| Terrebonne Parish | 9,951 | 3,434 | 34.5% | 54,996 | 39,949 | 72.6% |
| Union Parish | 1,954 | 499 | 25.5% | 9,889 | 6,684 | 67.6% |
| Vermilion Parish | 5,347 | 1,402 | 26.2% | 28,554 | 20,749 | 72.7% |
| Vernon Parish | 4,886 | 1,651 | 33.8% | 19,657 | 13,045 | 66.4% |
| Washington Parish | 5,311 | 1,491 | 28.1% | 19,579 | 13,672 | 69.8% |
| Webster Parish | 3,172 | 632 | 19.9% | 17,680 | 11,422 | 64.6% |
| West Baton Rouge Parish | 1,655 | 574 | 34.7% | 14,351 | 10,993 | 76.6% |
| West Carroll Parish | 889 | 191 | 21.5% | 4,640 | 3,225 | 69.5% |
| West Feliciana Parish | 546 | 271 | 49.6% | 6,776 | 5,025 | 74.2% |
| Winn Parish | 1,209 | 278 | 23.0% | 5,710 | 3,913 | 68.5% |
Source: U.S. Census Bureau, American Community Survey (ACS) 2021 5-year estimates
1Percentage of individuals with disabilities employed
2Percentage of individuals without disabilities employed.
Skill Gaps
- The employment data from Louisiana illustrates notable trends in workforce composition and projected growth through 2024. In 2022, a large segment of the workforce, amounting to 24%, had no formal educational credentials, with this group expected to see a growth of 34.5% by 2024. Similarly, those with a high school diploma or equivalent, who made up 46.7% of the workforce, are projected to experience a growth of 36.4%. Together, these two categories, which do not require postsecondary education, account for a substantial 70.9% of the total projected employment growth, highlighting a significant demand for jobs that do not necessitate higher education degrees.
- In contrast, employment growth for higher education levels is relatively less substantial. For instance, job growth for those with a bachelor's degree is projected at 13.0%, while those with master's and doctoral or professional degrees are expected to see smaller increases of 4.4% and 3.3%, respectively.
- This pattern indicates that the majority of job opportunities in Louisiana over the next few years will predominantly benefit individuals without postsecondary degrees. This trend might reflect the nature of the industries prevalent in the state, possibly emphasizing sectors like manufacturing, construction, or services, which traditionally require less formal education but are vital for the state’s economy. Such insights could guide educational and workforce development policies to align more closely with the actual demands of the state's labor market.
| 2022 Jobs | Projected 2024 Jobs | Growth | ||||
|---|---|---|---|---|---|---|
| No formal educational credential | 409,702 | 24.0% | 423,571 | 24.3% | 13,869 | 34.5% |
| High school diploma or equivalent | 795,604 | 46.7% | 810,222 | 46.4% | 14,618 | 36.4% |
| Postsecondary non-degree award | 62,445 | 3.7% | 64,214 | 3.7% | 1,769 | 4.4% |
| Associate's degree | 59,794 | 3.5% | 61,337 | 3.5% | 1,543 | 3.8% |
| Some college, no degree | 8,717 | 0.5% | 8,791 | 0.5% | 74 | 0.2% |
| Bachelor's degree | 263,997 | 15.5% | 269,233 | 15.4% | 5,236 | 13.0% |
| Master's degree | 72,553 | 4.3% | 74,305 | 4.3% | 1,752 | 4.4% |
| Doctoral or professional degree | 32,029 | 1.9% | 33,342 | 1.9% | 1,313 | 3.3% |
| Total | 1,704,841 | 100% | 1,745,015 | 100% | 40,174 | 100% |
- The educational composition and job market requirements in Louisiana reveal some significant skill gaps across different levels of educational attainment. A pronounced discrepancy exists for individuals with less than a high school education and high school graduates, where the demand in jobs significantly exceeds the population percentages by 11.3% and 14.2%, respectively. This indicates a substantial shortage in the workforce at these education levels, suggesting that lower education jobs are in higher demand than the current supply.
- Conversely, there is a notable surplus in the population with higher educational qualifications than the job market currently demands. Specifically, those with some college but no degree show a stark surplus of 20.0%, and those with associate’s degrees have a surplus of 3.7%. Additionally, there is a 1.5% surplus of individuals with bachelor’s degrees and a 4.0% surplus for those with graduate or professional degrees.
- These figures indicate a mismatch where the state’s job market has not kept pace with the educational achievements of its population, particularly at the higher education levels. This misalignment suggests that many individuals may be underemployed or working in fields that do not fully utilize their qualifications. Addressing these skill gaps could involve enhancing job creation in sectors that require higher education levels or facilitating vocational and technical training programs for less-educated sectors of the population to better align with job market demands.
| % Population | % Jobs | Skill Gap | |
|---|---|---|---|
| Less than high school graduate | 12.7% | 24.0% | -11.3% |
| High school graduate (includes equivalency) | 32.5% | 46.7% | -14.2% |
| Some college, no degree | 20.5% | 0.5% | 20.0% |
| Associate's degree | 7.2% | 3.5% | 3.7% |
| Bachelor's degree | 17.0% | 15.5% | 1.5% |
| Graduate or professional degree | 10.2% | 6.2% | 4.0% |