


Located in:
- II. Strategic Elements
The Unified or Combined State Plan must include a Strategic Planning Elements section that analyzes the State’s current economic environment and identifies the State’s overall vision for its workforce development system. The required elements in this section allow the State to develop data-driven goals for preparing an educated and skilled workforce and to identify successful strategies for aligning workforce development programs to support economic growth. Unless otherwise noted, all Strategic Planning Elements apply to Combined State Plan partner programs included in the plan as well as to core programs.
- a. Economic, Workforce, and Workforce Development Activities Analysis
The Unified or Combined State Plan must include an analysis of the economic conditions, economic development strategies, and labor market in which the State’s workforce system and programs will operate.
- a. Economic, Workforce, and Workforce Development Activities Analysis
II. a. 1. B. Workforce Analysis
The Unified or Combined State Plan must include an analysis of the current workforce, including individuals with barriers to employment, as defined in section 3 of WIOA4. This population must include individuals with disabilities among other groups5 in the State and across regions identified by the State. This includes—
[4] Individuals with barriers to employment include displaced homemakers; low-income individuals; Indians, Alaska Natives, and Native Hawaiians; individuals with disabilities, including youth who are individuals with disabilities; older individuals; ex-offenders; homeless individuals, or homeless children and youths; youth who are in or have aged out of the foster care system; individuals who are English language learners, individuals who have low levels of literacy, and individuals facing substantial cultural barriers; farmworkers (as defined at section 167(i) of WIOA and Training and Employment Guidance Letter No. 35-14); individuals within 2 years of exhausting lifetime eligibility under the Temporary Assistance for Needy Families program; single parents (including single pregnant women); and long-term unemployed individuals.
[5] Veterans, unemployed workers, and youth, and others that the State may identify.
i. Employment and Unemployment
Provide an analysis of current employment and unemployment data, including labor force participation rates, and trends in the State.
ii. Labor Market Trends
Provide an analysis of key labor market trends, including across existing industries and occupations.
iii. Education and Skill Levels of the Workforce
Provide an analysis of the educational and skill levels of the workforce.
iv. Skill Gaps
Describe apparent ‘skill gaps’.
Current Narrative:
(i) Employment and Unemployment
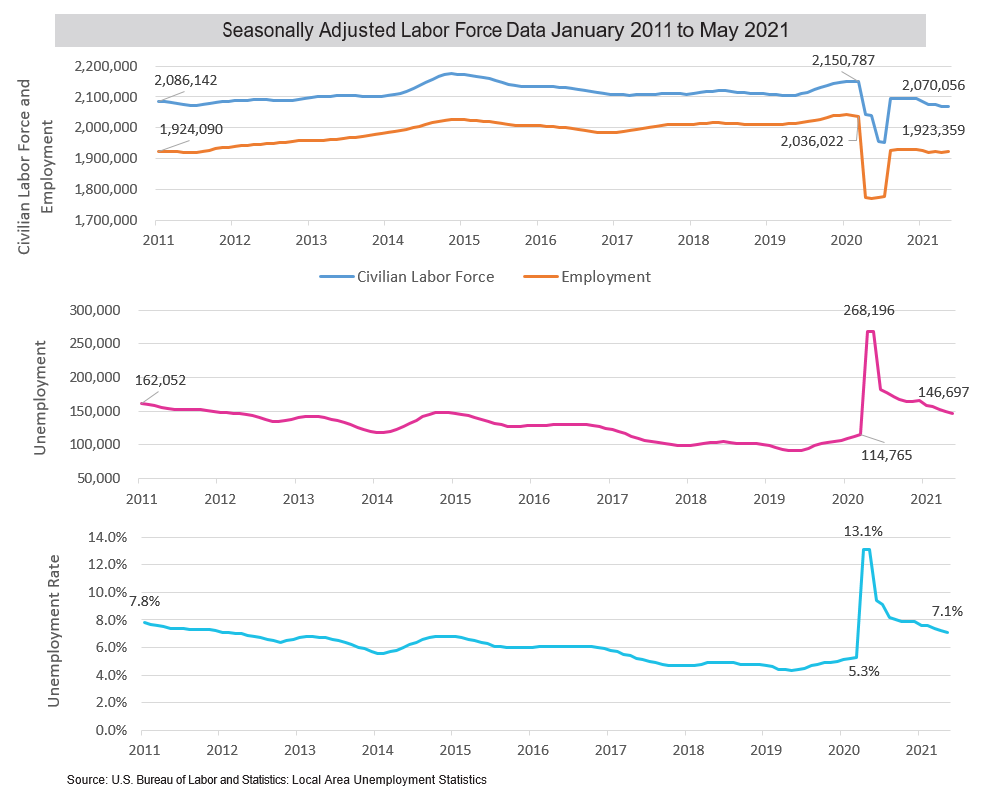
- Civilian labor force had grown to 2,150,787 before the pandemic began and was at 2,070,056 as of May 2021.
- Employment grew to 2,036,022 prior to the pandemic and has recovered to 1,923,359 as of May 2021.
- Unemployment has decreased overall since 2011 and experienced a large spike due to the beginning of the pandemic in 2020.
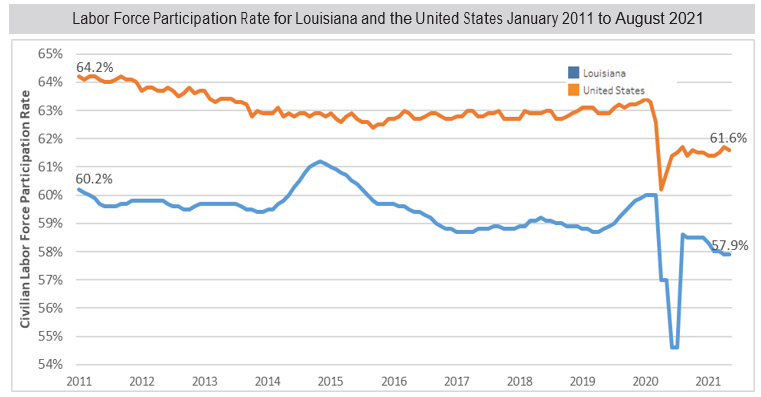
- In January 2011, Louisiana’s Labor Force participation rate was 4.0 percentage points below the national average. In May 2021, the state participation rate was 3.7 percentage points below the national average after suffering a large decline from the COVID-19 pandemic.
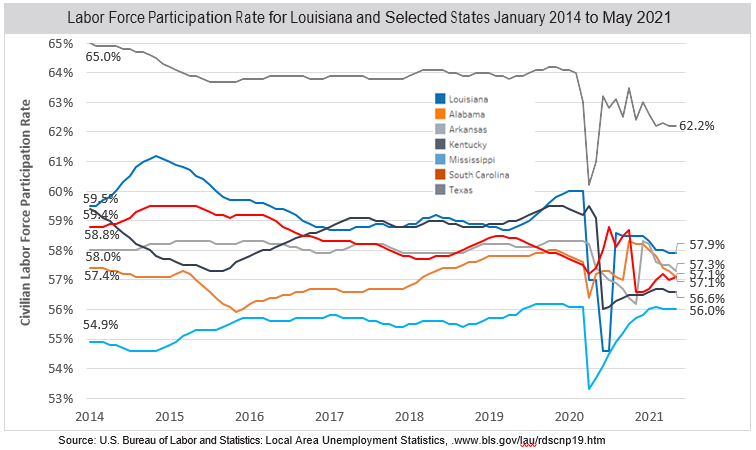
- This chart shows the percent change in the size of the labor force for southern states since 2014. Louisiana’s labor force has decreased by 2.7 percent during that time, while many other southern states have seen similar reductions.
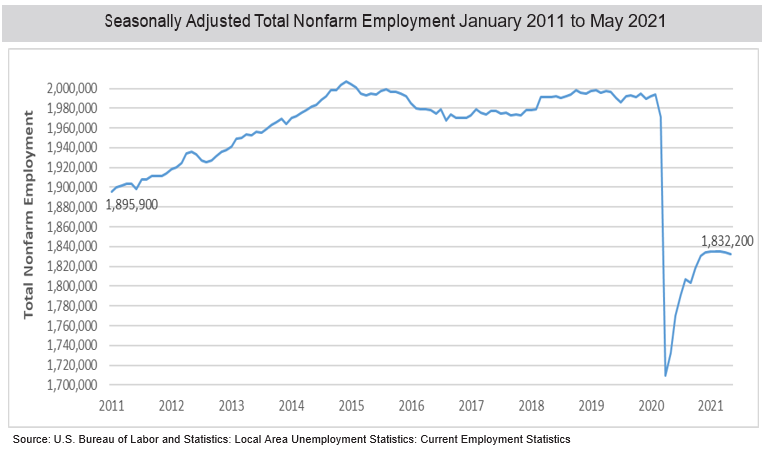
- According to the Current Employment Statistics survey, Louisiana nonfarm employment decreased from 1,993,500 in February 2020 to 1,832,200 in May 2021, which is 8.1 percent decrease. However, it has increased from 1,732,800 in March 2020, which is 5.7 percent increase.
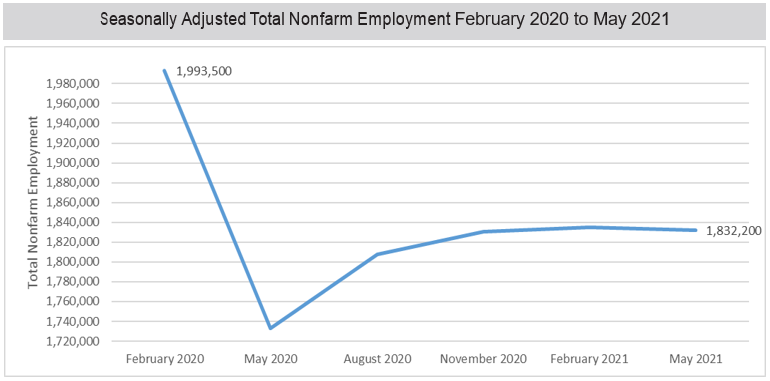
- Due to the pandemic, Louisiana’s total nonfarm employment fell in 2020 but is recovering in 2021.
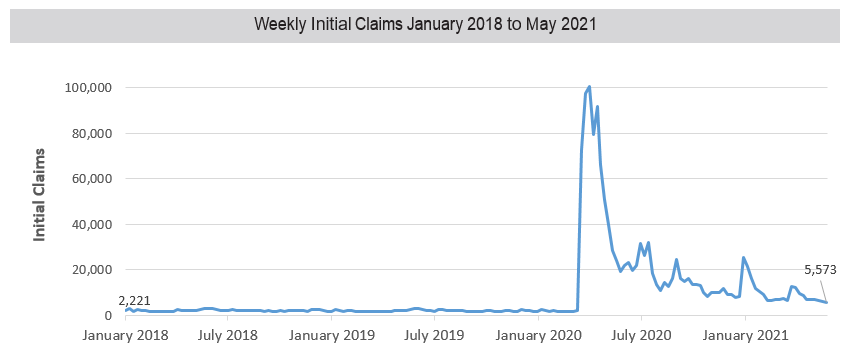
- The chart presents initial unemployment insurance claims by each week from January 2018 to May 2021. The COVID-19 pandemic led to historic levels of claims in April 2020, but the levels have decreased to 5,573 in May 2021.
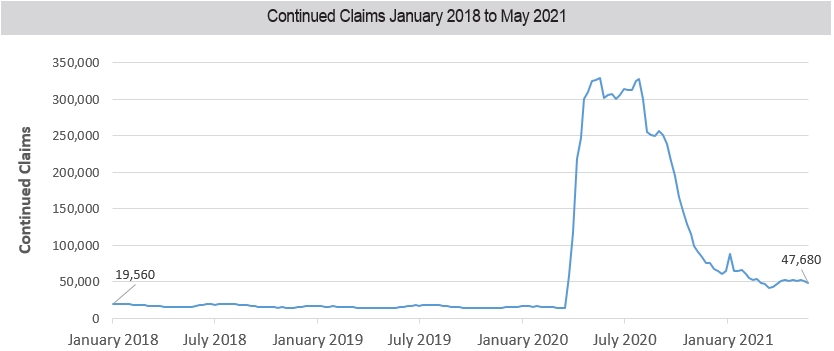
- Louisiana’s number of continued claimants showed a downward trend between January 2017 and March 2020. However, claims have spiked to historically high levels in April 2020 and subsequent months. Continued claims began to decrease after the summer of 2020 but have not yet reached pre-pandemic levels.
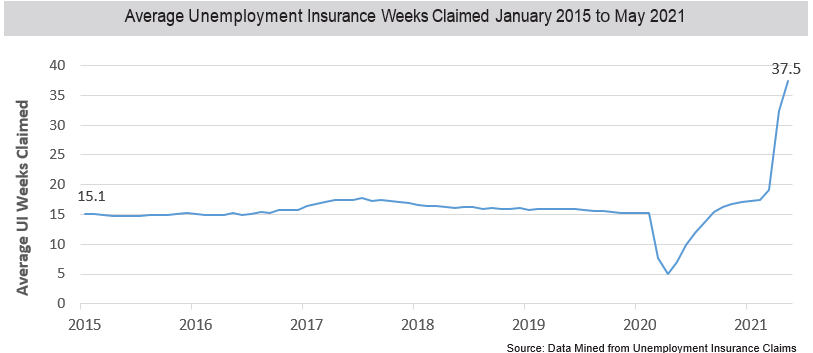
- The chart below shows the average number of weeks of benefits claimed by unemployment insurance claimants. The average weeks claimed was 37.5 weeks in May 2021.
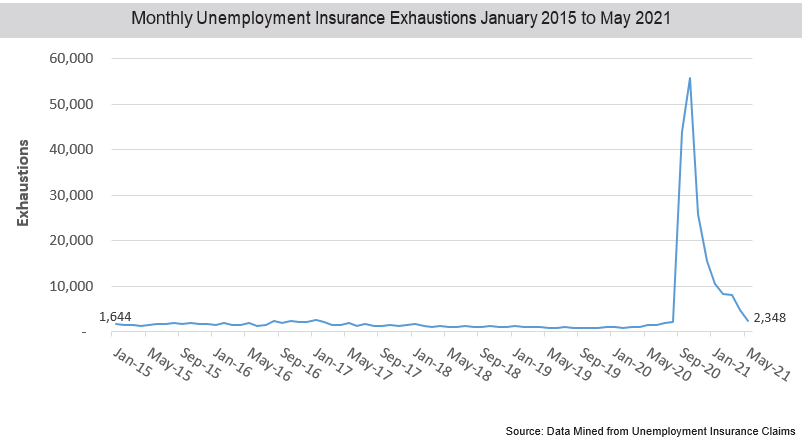
- Monthly unemployment insurance exhaustions data further emphasizes the weakness of the labor market because of the pandemic. Claim exhaustions were highest in October 2020 with 55,831 claimants using up their UI benefits. Exhaustions have since decreased in frequency and continue to follow this downward trend.
| Orleans | 121,579 | East Baton Rouge | 115,038 | Jefferson | 111,198 |
| Lafayette | 55,039 | Caddo | 53,360 | Calcasieu | 50,535 |
| Saint Tammany | 48,723 | Tangipahoa | 32,845 | Ouachita | 29,843 |
| Livingston | 26,500 | Ascension | 24,133 | Terrebonne | 23,123 |
| Rapides | 22,920 | Bossier | 20,585 | Saint Landry | 16,593 |
| Iberia | 15,034 | Lafourche | 14,954 | St John The Baptist | 11,294 |
| Saint Bernard | 11,270 | Saint Mary | 10,301 | Acadia | 10,283 |
| Vermilion | 10,235 | Saint Charles | 9,757 | Saint Martin | 9,186 |
| Washington | 8,202 | Lincoln | 7,655 | Avoyelles | 7,072 |
| Iberville | 6,551 | Natchitoches | 6,133 | Webster | 6,090 |
| Vernon | 5,789 | Beauregard | 5,537 | Jefferson Davis | 5,396 |
| West Baton Rouge | 5,316 | Evangeline | 5,056 | Morehouse | 4,836 |
| Plaquemines | 4,339 | Saint James | 4,176 | De Soto | 4,014 |
| Pointe Coupee | 4,009 | Allen | 3,936 | Assumption | 3,655 |
| Union | 3,152 | Richland | 3,046 | East Feliciana | 3,042 |
| Franklin | 2,864 | Concordia | 2,859 | Grant | 2,625 |
| Sabine | 2,554 | Bienville | 2,087 | Jackson | 2,066 |
| La Salle | 1,721 | Winn | 1,661 | West Feliciana | 1,529 |
| Claiborne | 1,474 | Saint Helena | 1,391 | Catahoula | 1,373 |
| Madison | 1,363 | West Carroll | 1,294 | Caldwell | 1,282 |
| East Carroll | 1,067 | Red River | 1,057 | Cameron | 672 |
| Tensas | 510 |
- The table above shows the number of unemployment insurance claims filed in each parish for the period between March 2020 and June 2021. Parishes that contain metropolitan areas and larger populations have a higher concentration of claims filed. Parishes with more rural areas and lower populations have a lower concentration of claims filed.
Worker Profiling and Reemployment Services (WPRS) Model
Changes to the U.S. economy—including the contraction of entire industries as a result of changes in technology and overseas competition—have led to increases in the length of unemployment. Unemployed workers are now less likely to be rehired by their previous employers and are at a greater risk of long-term unemployment than in the past. As a result, the Worker Profiling and Reemployment Services (WPRS) system was established nationwide following the 1993 enactment of PL 103-152. Profiling is designed to identify UI claimants who are most likely to exhaust their regular benefits, so that they may receive reemployment services that will help them find a job more quickly.
Louisiana Workforce Commission’s Labor Market Information developed a model for profiling all new claimants for regular UI benefits. The WPRS system strengthens the link between Unemployment insurance and Employment Services for those most likely to exhaust benefits. The worker profiling model for Louisiana helps us achieve the objectives of reducing the weeks of UI benefits, reducing UI benefits per beneficiary, increasing earnings per beneficiary, and providing a management tool for targeting resources and aiding staff in understanding the customers they serve.
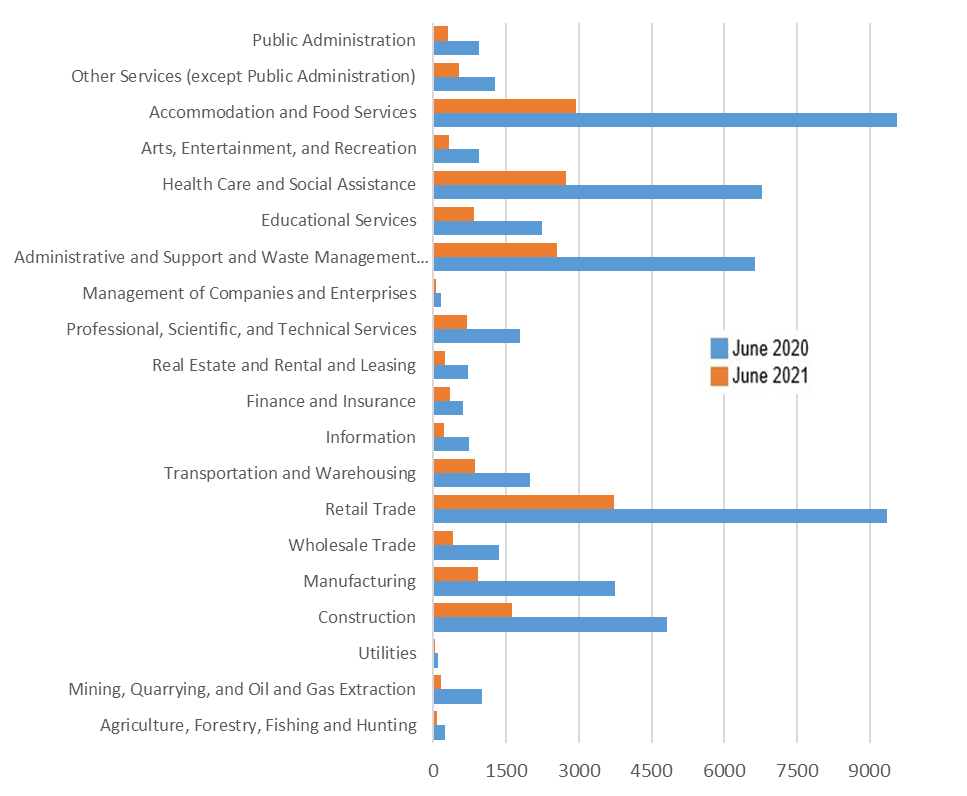
- This chart shows the contribution of each industry sector to continued claims in June 2020 and June 2021. Accommodation and Food Services had the most claims in June 2020 with 9,565 continued claims filed. Retail trade had the second largest number of claims filed in June 2020 with 9,368 claims. Retail Trade had the highest amount of claims filed in June 2021 with 3,733 claims filed. Accommodation and Food Services had the second highest number of claims filed in June 2021 with 2,950. These sectors have borne the worst of the COVID-19 related pandemic effects on industry and labor force. All industries experienced some higher levels of unemployment claims in June 2020 due to the pandemic.
(ii) Labor Market Trends
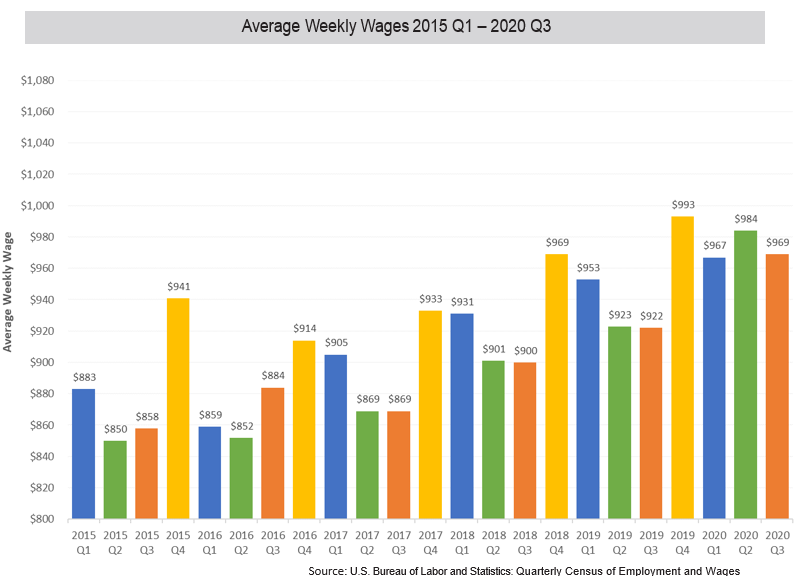
- The average weekly wage in Louisiana has continued to increase since 2015 and weekly wages tend to be highest in Quarter 4 of each year. Workforce composition and changes in distribution will change the average weekly wage value as well as changes in average hours worked by hourly employees. This is why we see seasonal changes in the average weekly wage.
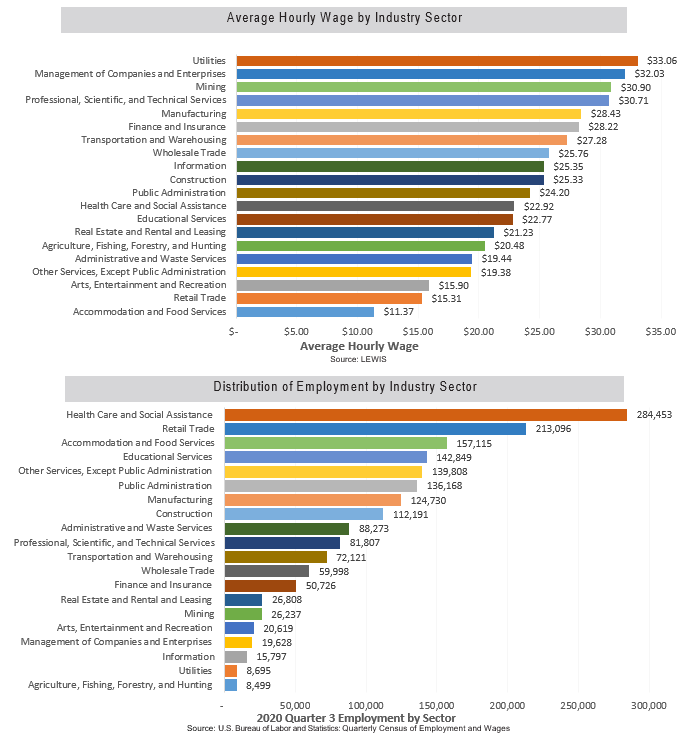
- The Quarterly Census of Employment and Wages (QCEW) provides information on industries, which support Louisiana’s economy. The charts on the following pages represent industry sector information as of the third quarter of 2020. The first chart represents the average hourly wage earned in each industry sector. The second chart represents the distribution of state employment by industry sector.
- Accommodation and Food Services is the fourth largest industry sector employer (157,504 employees) in the state and pays the lowest average hourly wage of $11.37 an hour. Retail trade (212,900 employees) is the second largest employer in the state and pays the second lowest average hourly wage of $15.31 an hour. The largest industry employer is Healthcare and Social Assistance (262,120 employees) and pays an average hourly wage of $22.92
(iii) Education and Skill Levels of the Workforce
- Table below highlights the educational achievements of Louisiana’s population. Table below looks at a younger cohort, aged 18 to 24, who may still be in postsecondary education. Their relative age likely accounts for the low percentage of Bachelor’s degree or higher completers, and the high percentage of ‘some college or associate’s degree’ completers.
| Population 18 to 24 years | Percent |
|---|---|
| Less than high school graduate | 15.8% |
| High school graduate (includes equivalency) | 35.1% |
| Some college or Associate's degree | 40.6% |
| Bachelor's degree or higher | 8.5% |
Source: U.S. Census American Community Survey 2019 1-year estimates, Table S1501
- Table belowpresents the population above age 24, which is more likely to have left the educational system. More than half of Louisiana’s adult population has completed some college coursework or graduated from a secondary institution.
| Population 25 years and over | Percent |
|---|---|
| Less than high school graduate | 14.0% |
| High school graduate (includes equivalency) | 33.9% |
| Some college, no degree | 20.6% |
| Associate's degree | 6.4% |
| Bachelor's degree | 16.0% |
| Graduate or professional degree | 8.9% |
Source: U.S. Census American Community Survey 2019 1-year estimates, Table S1501
- Table below breaks out the labor force status of Louisiana veterans aged 18 to 64. Veterans in Louisiana have a fairly high labor force participation rate, with 72.5 percent of those aged 18 to 64 are in the labor force. Veterans account for 4.1 percent of Louisiana’s population and only 5.1 percent of veterans are unemployed.
| Labor Force Status | Percent |
|---|---|
| Population | 4.1% |
| Labor Force Participation Rate | 72.5% |
| Employed | 94.9% |
| Unemployed | 5.1% |
| Not in Labor Force | 27.5% |
Source: U.S. Census American Community Survey 2019 1-year estimates, Table C21005
- Table below compares incarceration rates statewide and nationally. Louisiana has the highest incarceration rate in the nation, with 680 of every 100,000 residents behind bars in 2019. 99.9 percent of those incarcerated have sentences in excess of one year. According to the Bureau of Justice Statistics, Louisiana had the highest imprisonment rate among the 50 states but the total prison population in Louisiana was only 2.2 percent of the nation’s entire prison population.
| Jurisdiction | Imprisonment Rate | Total Prison Population |
|---|---|---|
| National Statistics (US Total) | 385 | 1,215,821 |
| Louisiana | 581 | 26,964 |
Source: U.S. Department of Justice - Bureau of Justice Statistics: Prisoners in 2020, Table 7
- In Louisiana, 7.0 percent of the employed population aged 18-64 years lives with one or more disabilities. Individuals with disabilities account for 16 percent of the unemployed and 31 percent of those not in the labor force in Louisiana.
| Disability Characteristic | Employed | Unemployed | Not in Labor Force |
|---|---|---|---|
| With a Hearing Difficulty | 23.7% | 14.4% | 14.4% |
| With a Vision Difficulty | 32.0% | 21.6% | 21.8% |
| With a Cognitive Difficulty | 32.0% | 51.3% | 48.5% |
| With an Ambulatory Difficulty | 30.4% | 33.5% | 54.7% |
| With a Self-Care Difficulty | 8.0% | 13.2% | 22.7% |
| With an Independent Living Difficulty | 15.2% | 29.2% | 46.9% |
*Disabilities are not mutually exclusive
Source: U.S. Census American Community Survey 2019 1-year estimates
| Disability | No Disability | |||||
|---|---|---|---|---|---|---|
| Parish | Total | Employed | %1 | Total | Employed | %2 |
| Louisiana | 371,186 | 123,894 | 33.4% | 2,408,880 | 1,772,989 | 73.6% |
| Acadia | 6,286 | 1,788 | 28.4% | 30,197 | 22,107 | 73.2% |
| Allen | 1,980 | 559 | 28.2% | 10,133 | 7,495 | 74.0% |
| Ascension | 8,490 | 3,396 | 40.0% | 66,773 | 53,013 | 79.4% |
| Assumption | 2,508 | 972 | 38.8% | 10,961 | 7,834 | 71.5% |
| Avoyelles | 4,508 | 1,419 | 31.5% | 16,717 | 12,481 | 74.7% |
| Beauregard | 4,164 | 1,197 | 28.7% | 17,475 | 12,244 | 70.1% |
| Bienville | 1,579 | 278 | 17.6% | 5,961 | 3,870 | 64.9% |
| Bossier | 7,542 | 2,834 | 37.6% | 64,613 | 48,274 | 74.7% |
| Caddo | 18,611 | 5,823 | 31.3% | 125,283 | 89,640 | 71.6% |
| Calcasieu | 15,753 | 5,412 | 34.4% | 104,707 | 78,864 | 75.3% |
| Caldwell | 703 | 136 | 19.3% | 4,772 | 3,006 | 63.0% |
| Cameron | 322 | 167 | 51.9% | 3,901 | 2,727 | 69.9% |
| Catahoula | 547 | 175 | 32.0% | 4,244 | 3,032 | 71.4% |
| Claiborne | 1,020 | 290 | 28.4% | 7,136 | 4,397 | 61.6% |
| Concordia | 1,233 | 330 | 26.8% | 8,613 | 5,676 | 65.9% |
| De Soto | 2,417 | 650 | 26.9% | 13,334 | 9,377 | 70.3% |
| East Baton Rouge | 35,805 | 15,859 | 44.3% | 244,282 | 187,191 | 76.6% |
| East Carroll | 250 | 58 | 23.2% | 1,932 | 1,128 | 58.4% |
| East Feliciana | 1,275 | 352 | 27.6% | 8,105 | 5,652 | 69.7% |
| Evangeline | 4,388 | 1,162 | 26.5% | 14,403 | 9,781 | 67.9% |
| Franklin | 1,689 | 362 | 21.4% | 8,914 | 5,710 | 64.1% |
| Grant | 1,793 | 421 | 23.5% | 9,667 | 6,637 | 68.7% |
| Iberia | 6,542 | 1,961 | 30.0% | 35,617 | 25,855 | 72.6% |
| Iberville | 3,294 | 952 | 28.9% | 14,722 | 11,269 | 76.5% |
| Jackson | 1,608 | 422 | 26.2% | 6,570 | 4,543 | 69.1% |
| Jefferson | 32,151 | 12,445 | 38.7% | 232,324 | 181,300 | 78.0% |
| Jefferson Davis | 2,918 | 974 | 33.4% | 15,261 | 10,576 | 69.3% |
| LaSalle | 1,086 | 203 | 18.7% | 6,644 | 4,622 | 69.6% |
| Lafayette | 15,877 | 5,476 | 34.5% | 136,653 | 106,865 | 78.2% |
| Lafourche | 8,877 | 2,859 | 32.2% | 51,043 | 37,754 | 74.0% |
| Lincoln | 3,343 | 975 | 29.2% | 27,630 | 18,861 | 68.3% |
| Livingston | 9,692 | 3,255 | 33.6% | 74,585 | 57,029 | 76.5% |
| Madison | 927 | 303 | 32.7% | 4,282 | 2,831 | 66.1% |
| Morehouse | 1,722 | 394 | 22.9% | 12,404 | 8,138 | 65.6% |
| Natchitoches | 2,453 | 520 | 21.2% | 20,229 | 10,662 | 52.7% |
| Orleans | 30,915 | 9,558 | 30.9% | 221,059 | 160,918 | 72.8% |
| Ouachita | 10,098 | 3,012 | 29.8% | 80,162 | 56,556 | 70.6% |
| Plaquemines | 1,572 | 600 | 38.2% | 11,558 | 8,516 | 73.7% |
| Pointe Coupee | 3,240 | 1,168 | 36.0% | 9,408 | 6,910 | 73.4% |
| Rapides | 11,298 | 3,239 | 28.7% | 64,412 | 47,315 | 73.5% |
| Red River | 929 | 284 | 30.6% | 3,857 | 2,726 | 70.7% |
| Richland | 1,289 | 459 | 35.6% | 10,042 | 6,684 | 66.6% |
| Sabine | 1,702 | 338 | 19.9% | 11,638 | 7,091 | 60.9% |
| St. Bernard | 5,175 | 1,105 | 21.4% | 23,292 | 16,592 | 71.2% |
| St. Charles | 3,227 | 1,247 | 38.6% | 29,030 | 21,896 | 75.4% |
| St. Helena | 926 | 247 | 26.7% | 5,114 | 3,362 | 65.7% |
| St. James | 1,319 | 396 | 30.0% | 11,435 | 8,236 | 72.0% |
| St. John the Baptist | 2,844 | 773 | 27.2% | 23,203 | 17,110 | 73.7% |
| St. Landry | 4,723 | 1,285 | 27.2% | 42,496 | 27,716 | 65.2% |
| St. Martin | 4,308 | 1,084 | 25.2% | 28,354 | 20,129 | 71.0% |
| St. Mary | 4,919 | 1,562 | 31.8% | 24,919 | 16,257 | 65.2% |
Source: U.S. Census Bureau, American Community Survey (ACS) 2019 5-year estimates
1Percentage of individuals with disabilities employed
2Percentage of individuals without disabilities employed.
(iv) Skill Gaps
- Table below presents employment in 2020, projected employment in 2022, and growth by education level. As of 2020, 24% of the workforce had no formal educational credential, 40% had high school diploma or equivalent, 2% had associate’s degree, 2% had some college experience but no degree, 19% had bachelor’s degree, 2% had master’s degree, and 2% had doctoral or professional degree. The majority of the projected employment growth (71.7%) is for occupations that require no formal educational credential or high school diploma or equivalent in Louisiana.
| 2020 Jobs | Projected 2022 Jobs | Growth | ||||
|---|---|---|---|---|---|---|
| No formal educational credential | 433,407 | 24.2% | 467,461 | 24.7% | 34,054 | 34.1% |
| High school diploma or equivalent | 722,899 | 40.4% | 760,506 | 40.3% | 37,607 | 37.6% |
| Postsecondary non-degree award | 135,570 | 7.6% | 141,841 | 7.5% | 6,271 | 6.3% |
| Associate's degree | 39,853 | 2.2% | 42,707 | 2.3% | 2,854 | 2.9% |
| Some college, no degree | 40,265 | 2.3% | 41,331 | 2.2% | 1,066 | 1.1% |
| Bachelor's degree | 346,577 | 19.4% | 361,824 | 19.2% | 15,247 | 15.3% |
| Master's degree | 31,905 | 1.8% | 33,074 | 1.8% | 1,169 | 1.2% |
| Doctoral or professional degree | 38,470 | 2.2% | 40,116 | 2.1% | 1,646 | 1.6% |
| Total | 1,788,946 | 100.0% | 1,888,860 | 100.0% | 99,914 | 100.0% |
- The first column of the table below presents the education level of the population, and the second column presents the education level of jobs in Louisiana. The third column presents a proxy for “skill gaps” by subtracting the second column from the first column. The table shows that Louisiana has 4.9% excess of highly-skilled workforce with graduate or professional degrees, 3.37% shortage of workforce with bachelor’s degrees, 4.17% excess of workforce with associate’s degrees, 18.35% excess of workforce with some college (no degree), and 16.74% shortage of workforce with high school or less education.
| % Population | % Jobs | Skill Gap | |
|---|---|---|---|
| Less than high school graduate | 14.00% | 24.2% | -10.23% |
| High school graduate (includes equivalency) | 33.90% | 40.4% | -6.51% |
| Some college, no degree | 20.60% | 2.3% | 18.35% |
| Associate's degree | 6.40% | 2.2% | 4.17% |
| Bachelor's degree | 16.00% | 19.4% | -3.37% |
| Graduate or professional degree | 8.90% | 4.0% | 4.90% |