Located in:
- II. Strategic Elements
The Unified or Combined State Plan must include a Strategic Planning Elements section that analyzes the State’s current economic environment and identifies the State’s overall vision for its workforce development system. The required elements in this section allow the State to develop data-driven goals for preparing an educated and skilled workforce and to identify successful strategies for aligning workforce development programs to support economic growth. Unless otherwise noted, all Strategic Planning Elements apply to Combined State Plan partner programs included in the plan as well as to core programs.
- a. Economic, Workforce, and Workforce Development Activities Analysis
The Unified or Combined State Plan must include an analysis of the economic conditions, economic development strategies, and labor market in which the State’s workforce system and programs will operate.
- a. Economic, Workforce, and Workforce Development Activities Analysis
II. a. 1. B. Workforce Analysis
The Unified or Combined State Plan must include an analysis of the current workforce, including individuals with barriers to employment, as defined in section 3 of WIOA4. This population must include individuals with disabilities among other groups5 in the State and across regions identified by the State. This includes—
[4] Individuals with barriers to employment include displaced homemakers; low-income individuals; Indians, Alaska Natives, and Native Hawaiians; individuals with disabilities, including youth who are individuals with disabilities; older individuals; ex-offenders; homeless individuals, or homeless children and youths; youth who are in or have aged out of the foster care system; individuals who are English language learners, individuals who have low levels of literacy, and individuals facing substantial cultural barriers; farmworkers (as defined at section 167(i) of WIOA and Training and Employment Guidance Letter No. 35-14); individuals within 2 years of exhausting lifetime eligibility under the Temporary Assistance for Needy Families program; single parents (including single pregnant women); and long-term unemployed individuals.
[5] Veterans, unemployed workers, and youth, and others that the State may identify.
i. Employment and Unemployment
Provide an analysis of current employment and unemployment data, including labor force participation rates, and trends in the State.
ii. Labor Market Trends
Provide an analysis of key labor market trends, including across existing industries and occupations.
iii. Education and Skill Levels of the Workforce
Provide an analysis of the educational and skill levels of the workforce.
iv. Skill Gaps
Describe apparent ‘skill gaps’.
Current Narrative:
Population Data
The U.S. Census Bureau estimates that Missouri’s population grew to over 6.1 million, up by 0.3 percent in 2018 from the previous year.
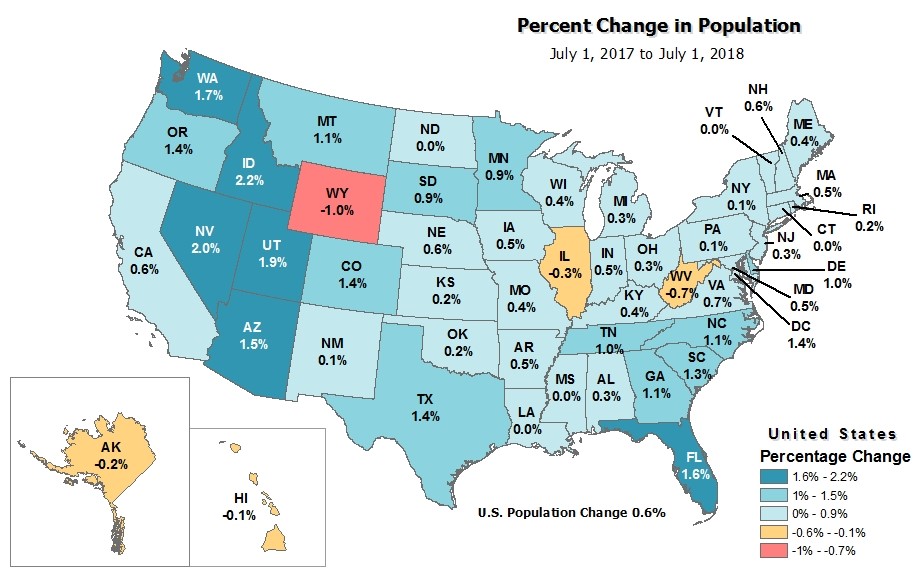
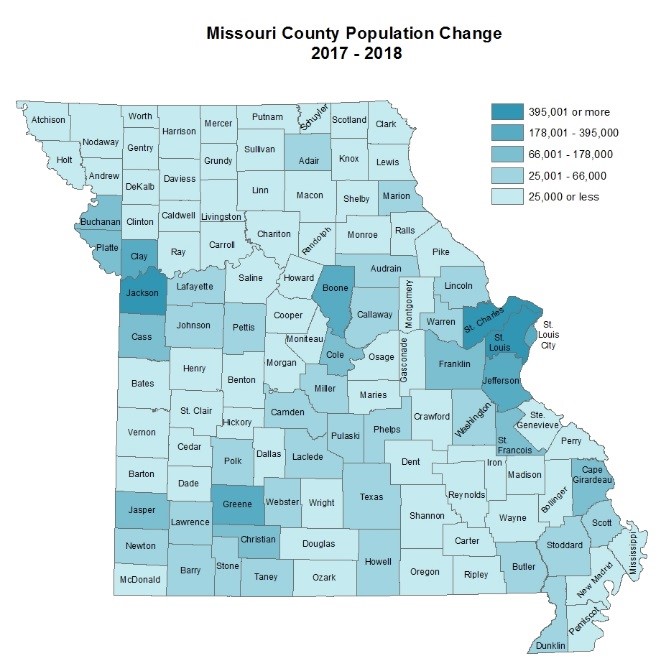
Counties with the largest population are St. Louis County (996,945), Jackson County (700,307), St. Charles County (399,182), St. Louis City (302,838), and Green County (291,823). The county with the smallest population is Worth County (2,040).
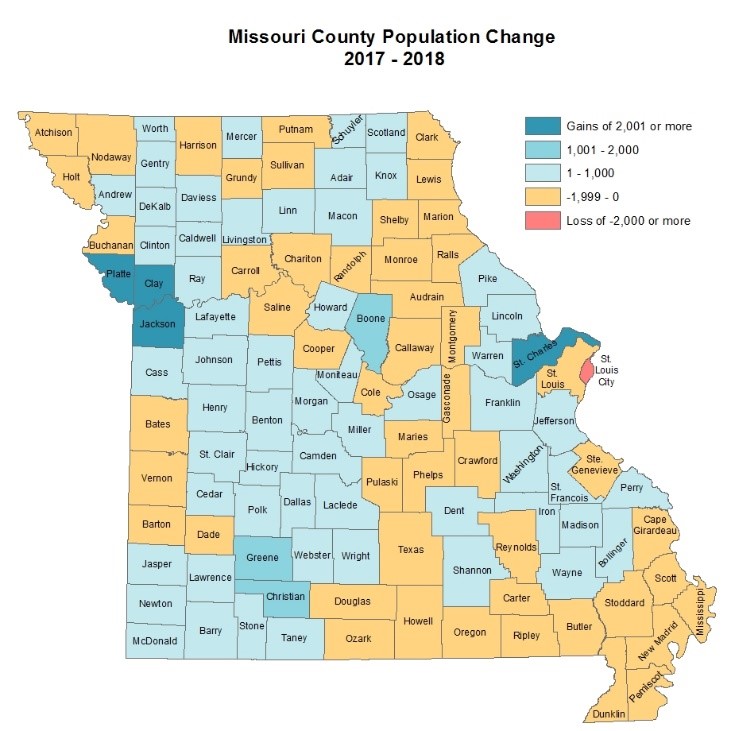
Counties with the largest population increase between 2017 and 2018 include St. Charles County (3,937), Clay County (3,772), Jackson County (2,587), and Greene County (2,104), Platte County (1,766). St. Louis City had the largest population loss of 5,028.
Demographics
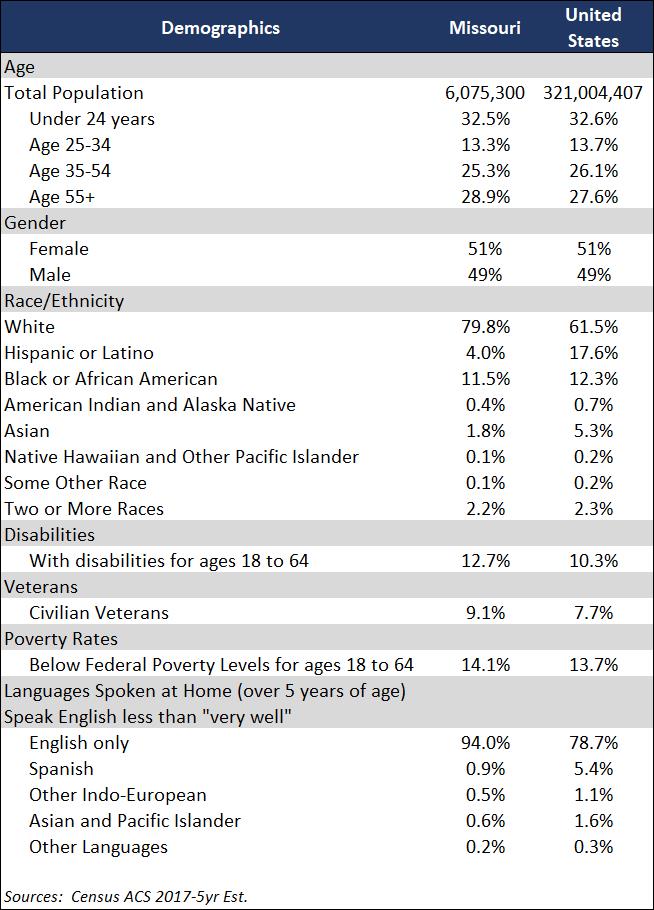
In some ways, Missouri’s population is similar to the U.S. population. Age group percentages are within one percentage point comparatively. The exception is Missouri’s population of residents age 55 and up is 1.3 percent higher than the U.S. average. The male/female gender makeup mirrors the U.S. with 51 percent female and 49 male.
Race/Ethnicity statistics for Missouri are different from the national averages. A higher percentage of Missouri’s residents are white than the U.S. and lower than the national average in all other race/ethnicity categories. Languages spoken at home for Missourians follow a similar pattern. Compared to U.S. averages, more Missourians speak only English while a lower percentage of Missourians speak other languages.
More working age Missourians report a disability compared to the national average. Missouri is also home to more veterans than the national average. The poverty rate for the state is slightly higher than the nation.
Employment and Unemployment
The number of Missourians in the labor force has remained relatively steady over the past 10 years at over 3 million. The number of persons employed has increased steadily since the recession, from 2.77 million in 2009 to 2.95 million.

During the recession, the number of Missourians employed in the state decreased, while the number of unemployed increased to over 9 percent statewide. Over time, employment has rebounded, and the unemployment rate has decreased to 3.3 percent in May 2019. By comparison, Missouri’s unemployment rate has remained at or below the U.S. unemployment rate since 2009.

Another measure of the workforce is a comparison of the number of job openings to the number of unemployed people, or more simply stated, supply vs. demand. Missouri reached its peak of 7.1 workers per job opening in January 2010. By August 2018, that ratio shrank to less than 1 worker for each job opening.

Labor Force Participation
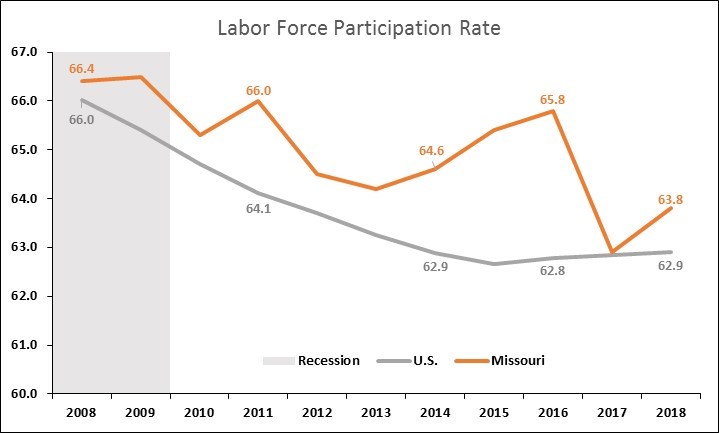
Missouri’s population participates in the workforce at a higher rate than the national average. Missouri’s labor participation peaked before the recession and has fluctuated over the last 10 years, while the national average declined steadily through 2015, rising slightly through 2018.
(ii) Labor Market Trends. Provide an analysis of key labor market trends, including across existing industries and occupations.
Top Growing Occupations
Over the long term, industry needs for certain occupations grow while others decline. A trained and ready workforce is needed to fill employer demand and offer job seekers bright prospects for employment.
Long-term projections are produced in each state in conjunction with the Bureau of Labor Statistics and provide insight on the occupations that are growing and declining. The annual number of openings account for 3 different types of vacancies - exits, transfers, and growth. Exits occur as individuals leave the workforce for reasons such as retirement. Transfers occur as a person leaves an occupation to work in a different occupation. Growth simply means that more people are needed to work in the occupation. No matter the reason for the vacancy, skilled workers are needed to fill the job openings.
Missouri adds value to the standard projections template by including the ACT Workkeys Assessment Levels typically required for success in each of the 800+ occupations. Since most of Missouri’s counties participate in the Certified Work Ready Communities program, the levels help those researching careers find good options based on their personal assessment.
Missouri uses a system of Now, Next and Later to categorize the occupations according to the training and education typically required for success on the job. Now occupations typically require a high school education or less along with short-term training. Next occupations typically require moderate to long-term training or experience and or education beyond high school. Later occupations typically require a bachelor’s degree or higher.
While long-term projections offer a solid understanding of longer-term employer needs, job ads placed by employers help in recognizing the current needs of employers. When projections predict a high number of future openings and job ads show current demand for the same occupation, the occupation may be a good career possibility.
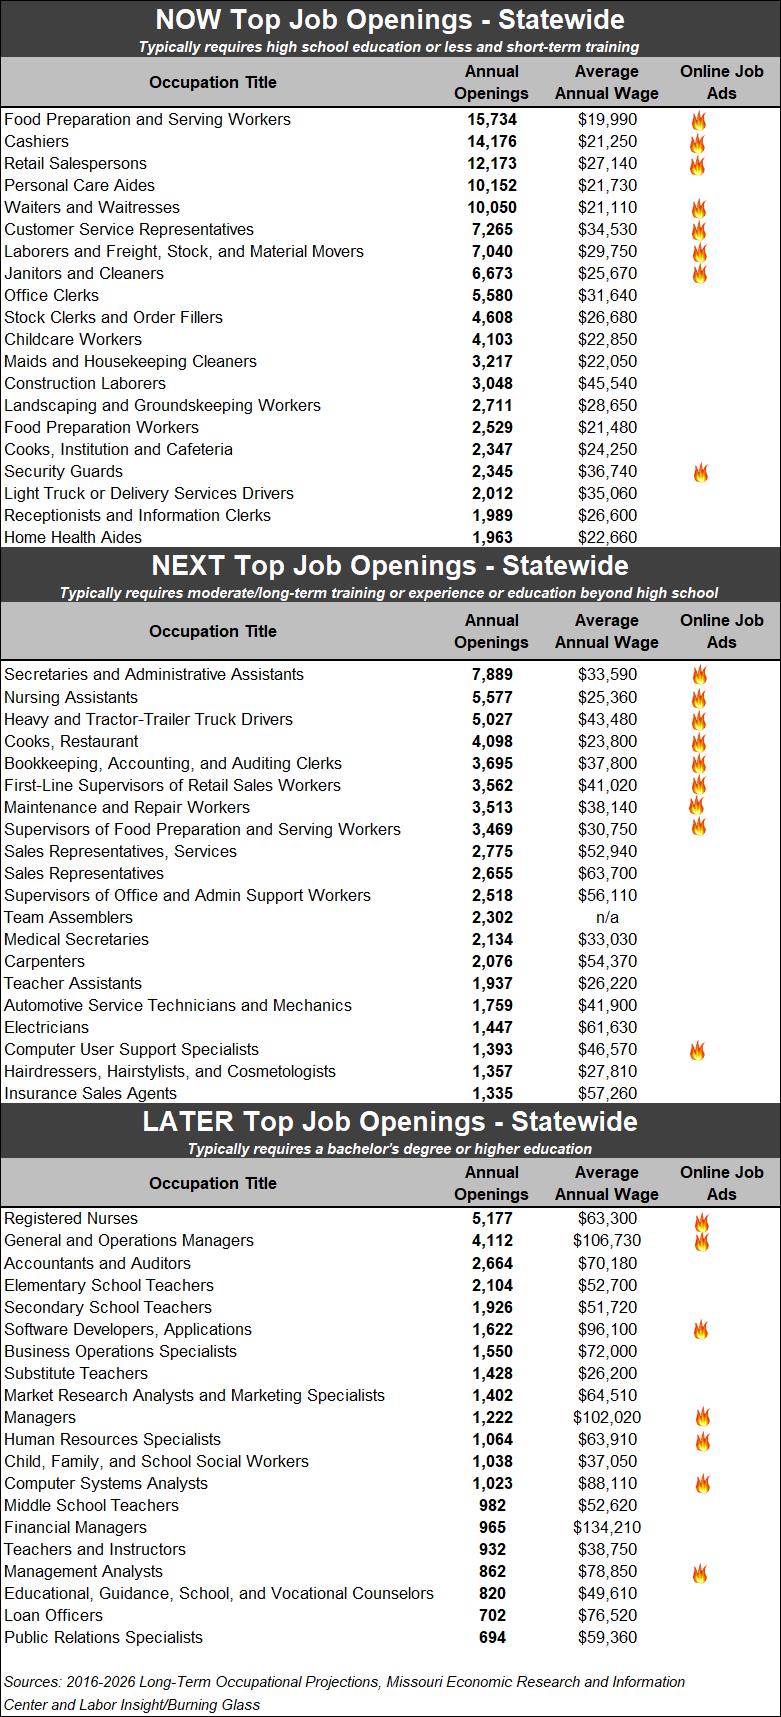
The table below displays the top 20 jobs by the number of projected openings in the Now, Next and Later categories. The flame beside some of the occupations represents “hot jobs” determined by the number of job ads placed by employers.
Top occupations in the Now category with over 10,000 annual openings each are Food Preparation and Serving Workers (15,734 annual openings), Cashiers (14,176 annual openings), Retail Salespersons (12,173 annual openings), Personal Care Aides (10,152 annual openings), and Waiters and Waitresses (10,050 annual openings). The reason for a high number of openings is turnover within these jobs. All but one of the occupations also had a high number of job ads in 2018.
Occupations with the highest number of annual openings in the Next category are Secretaries and Administrative Assistants (7,889), Nursing Assistants (5,577), Heavy and Tractor-Trailer Truck Drivers (5,027), Restaurant Cooks (4,098), and Bookkeeping, Accounting, and Auditing Clerks (3,695). The top 5 occupations by the number of projected openings also saw a high number of job ads.
Later occupations with the highest number of annual openings are Registered Nurses (5,177), General and Operations Managers (4,112), Accountants and Auditors (2,664), Elementary School Teachers (2,104), and Secondary School Teachers (1,926). The growth rate of Later category occupations is higher than the other two categories. Seven of the jobs in this top 20 category are also in high demand according the job ads.
Many high demand occupations correspond directly with the high growth industry groups, such as Laborers and Freight, Stock, and Material Movers, Supervisors of Food Prep and Serving Workers, and Registered Nurses. Other high demand occupations cross many industry groups, like Customer Service Representatives, Sales Representatives, General and Operations Managers, and Accountants and Auditors.
Educational Attainment
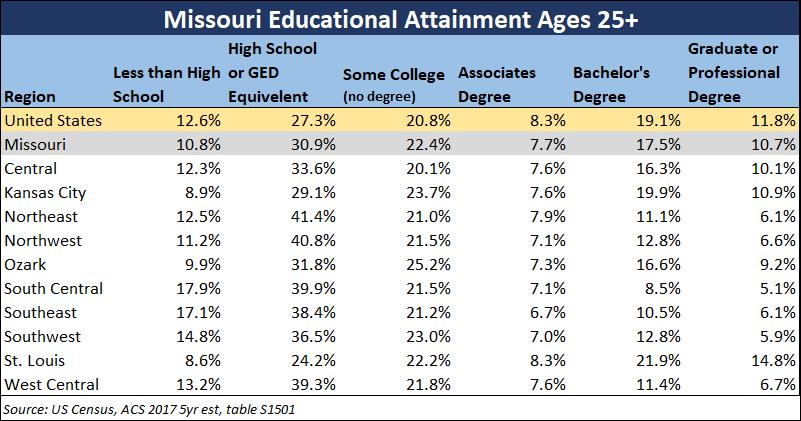
The educational attainment rate for Missourians varies by education level. More Missourians have either a high school diploma or some college education but no degree than the national average. However, less Missourians have earned an associate’s degree, bachelor’s degree, or graduate/professional degree than the national average.
The regional economies in the state vary, as do the educational attainment rates in those regions. In general, a greater percentage of the workforce has a high school diploma in Missouri’s rural areas than urban, and more have an associate’s degree, bachelor’s degree, graduate/professional degree in urban areas of the state.
Occupational Projections
Long-term projections are used to identify the fastest growing occupations, as well as occupations with a high number of openings through 2026.
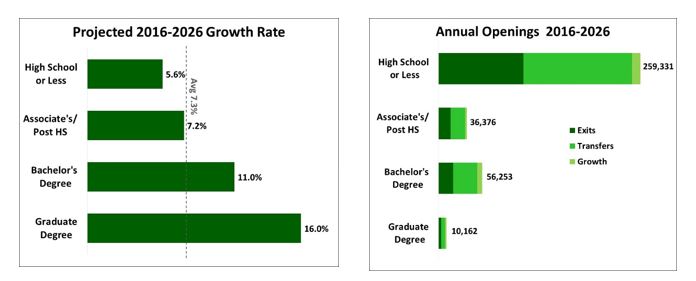
The growth rate of an occupation measures the percentage of jobs added by occupation. According to the projections, occupations requiring a bachelor’s degree or more are growing at a faster rate than the Missouri average. The greatest growth is occurring in the areas of Computer and Mathematical, Healthcare, and Education.
The projections also predict the total number of openings by occupation. Openings occur for several reasons including growth, people moving into a different occupation, and workers leaving the workforce. No matter the reason, qualified individuals are still needed to fill job vacancies. Most openings will be in entry-level jobs, mostly due to high turnover rates as workers either transfer to another occupation or leave the workforce.
Missouri Workforce 2019 Survey
In April through June of 2019, over 1,600 Missouri companies were surveyed to gauge the state of Missouri’s workforce from the employers’ point of view. Companies were randomly selected from a categorized list of Missouri Businesses queried from the Reference USA employer database. Employers surveyed represented the mix of industries found in Missouri and were equally located in metro and non-metro areas of the state. The 14 questions help with understanding hiring trends, skill needs and shortages, experience, and education requirements of Missouri employers.
One of the survey questions asked employers about any planned changes in employment levels during the next 12 months. While 49 percent anticipate employment remaining the same as previous years, 33 percent plan to increase employment. This statistic is significant as we begin to understand employer skill needs and gaps, as well as barriers to expanding employment.
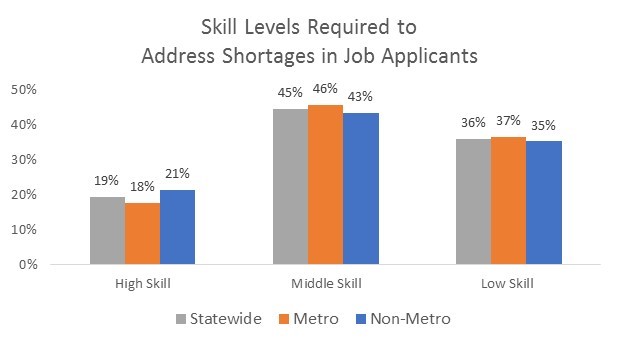
Twenty-eight percent of employers responded that they are experiencing a shortage of skilled applicants, and the responses were similar in the metro and non-metro areas. Most of the shortages were in middle-skill jobs, or jobs that require education and/or training beyond a high school diploma but do not require a four-year degree.
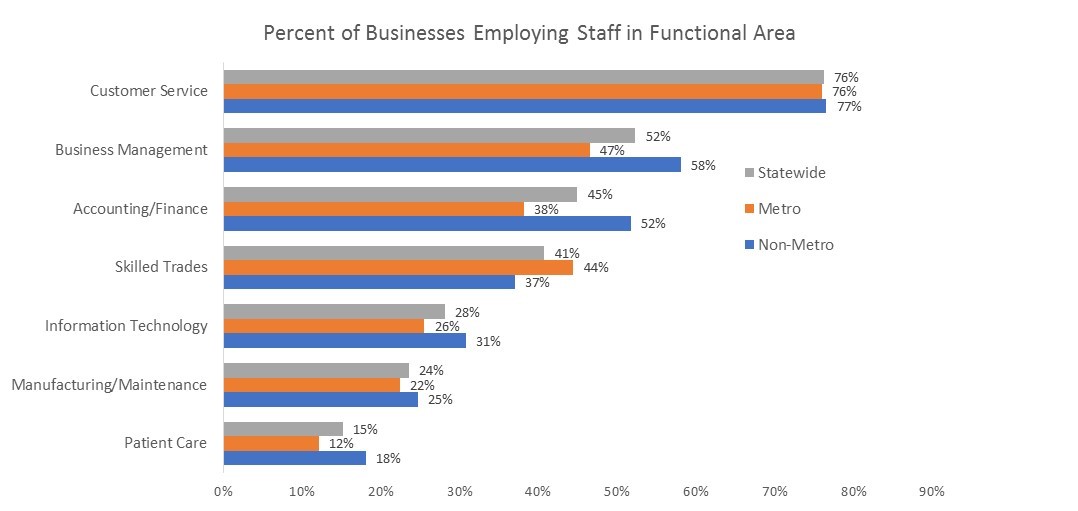
Companies employ workers in a variety of occupations, or functional areas. The companies were asked about employment within those functional areas of their businesses as a means of understanding the types of jobs Missouri employers have working in their businesses.
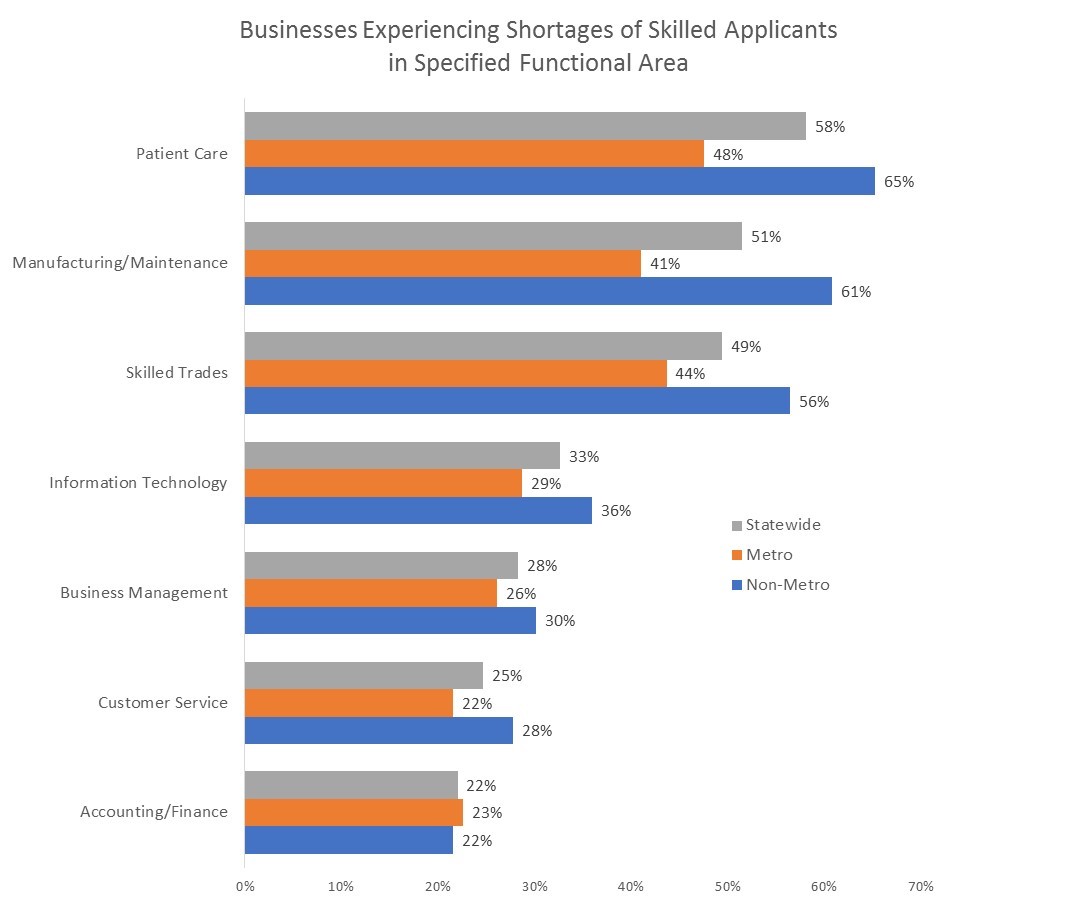
Companies indicating that they had employees in each functional area were then asked if they were seeing a shortage of skilled applicants in those areas. In every area except Accounting, a greater number of non-metro than metro areas are seeing a shortage of skilled applicants.
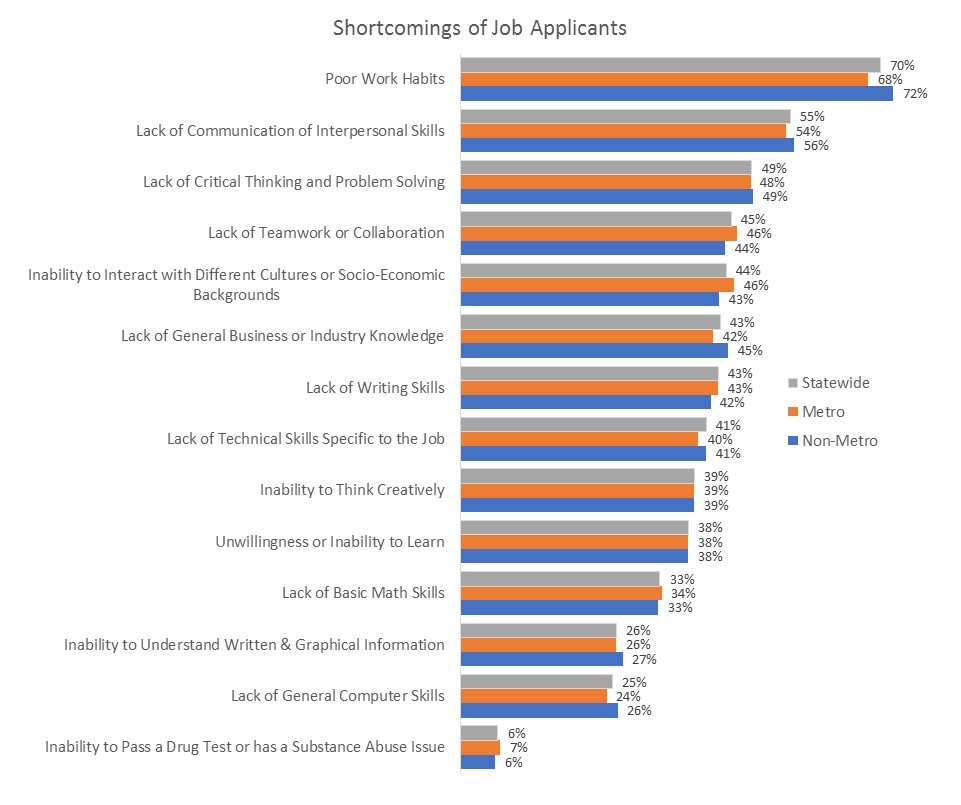
Over 90 percent of companies surveyed reported at least one shortcoming in recent job applicants. The most common shortcoming cited is poor work habits, followed by lack of communication skills and lack of critical thinking and problem solving. The results are similar in Missouri’s metro and non-metro areas, indicating that applicant shortcomings, particularly in soft skills, is consistent across the state.
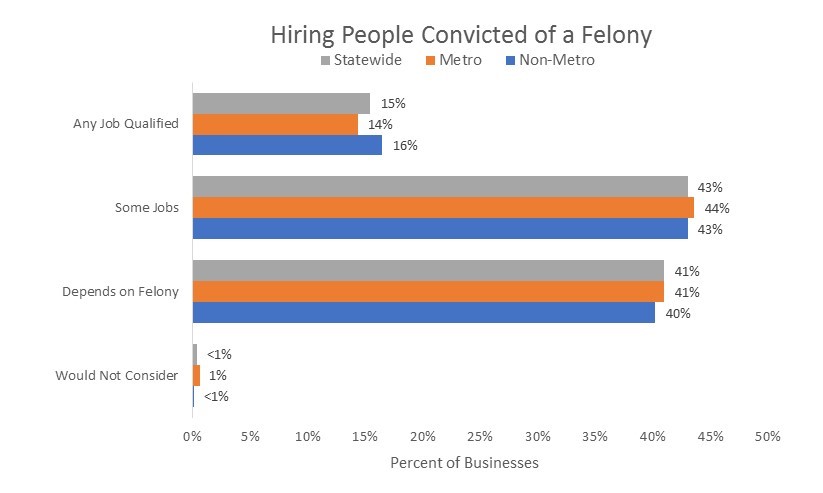
Individuals who are justice-involved or have difficulty passing a drug screen or background check often have a more difficult time finding employment. With low unemployment and high job opening rates, many employers are considering traditionally overlooked groups of potential employees.
Nearly all employers report that they require a background check prior to employment for at least half of their positions. Results were similar for metro and non-metro areas. Despite nearly all employers requiring a background check, less than 1 percent stated they would not hire a person convicted of a felony.
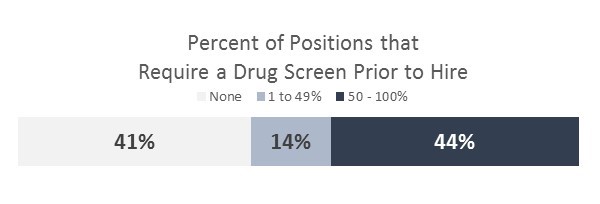
Forty-one percent of employers statewide report they do not require a drug screen prior to hire for any of their positions, while another 14 percent require the screen for up to half of their positions. The results are similar for metro and non-metro areas.