Located in:
- II. Strategic Elements
The Unified or Combined State Plan must include a Strategic Planning Elements section that analyzes the State’s current economic environment and identifies the State’s overall vision for its workforce development system. The required elements in this section allow the State to develop data-driven goals for preparing an educated and skilled workforce and to identify successful strategies for aligning workforce development programs to support economic growth. Unless otherwise noted, all Strategic Planning Elements apply to Combined State Plan partner programs included in the plan as well as to core programs.
- a. Economic, Workforce, and Workforce Development Activities Analysis
The Unified or Combined State Plan must include an analysis of the economic conditions, economic development strategies, and labor market in which the State’s workforce system and programs will operate.
- a. Economic, Workforce, and Workforce Development Activities Analysis
II. a. 1. A. Economic Analysis
The Unified or Combined State Plan must include an analysis of the economic conditions and trends in the State, including sub-State regions and any specific economic areas identified by the State. This must include—
i. Existing Demand Industry Sectors and Occupations
Provide an analysis of the industries and occupations for which there is existing demand.
ii. Emerging Demand Industry Sectors and Occupations
Provide an analysis of the industries and occupations for which demand is emerging.
iii. Employers’ Employment Needs
With regard to the industry sectors and occupations identified in (A)(i) and (ii), provide an assessment of the employment needs of employers, including a description of the knowledge, skills, and abilities required, including credentials and licenses.
Current Narrative:
Gross Domestic Product
The broadest measure of economic activity is Gross Domestic Product, or GDP. This measure tracks the market value of goods and services produced within a nation or state within a set time period. In 2020, Missouri’s GDP was $277.3 billion (in 2012 chained dollars), a decrease of 3.6%from 2019. In comparison, the national GDP decreased 3.5%during the same period. The decline in GDP in 2020 is due to the economic impact of the global COVID-19 pandemic and impacted the entire U.S.
Real GDP declined in all 50 states and the District of Columbia and ranged from -8.0% in Hawaii to -0.1%in Utah. The decline in Missouri ranked fifth compared to each of the contiguous states.
Most industry sectors declined in 2020 compared to 2019. Arts, Entertainment, and Recreation (-27.0%); Accommodation and Food Services (-20.9%); and Transportation and Warehousing (-14.0%) had the most significant declines.
During 2020, Missouri’s GDP declined most dramatically in the second quarter of the calendar year. Since then, GDP in Missouri and the U.S. has been recovering, reaching at or above pre-pandemic levels for the first quarter of 2021.
Industry Diversification
A diversified economy has many industries and can better manage fluctuations in the business cycle. A balanced economy is capable of absorbing an economic shock through other industries present in the area compensating for the loss by helping to maintain economic stability for the state.
Less diversified economies specialize in only a few industries. If a state economy has a disproportionate number of workers in one specific industry, the effects of hard times would negatively impact the state.
In 2017, Missouri’s economy ranked as the fourth most diversified among the 50 states on the diversification index at 2.8%. Pennsylvania was the most diversified at 2.5% (the lower the score, the more diversified the state’s economy is more diversified; the higher the score, the state’s economy is more specialized). Missouri was more diversified than any other neighboring state. The most specialized neighboring state was Iowa with a score of 4.5%.
Missouri Economic Research Information Center’s (MERIC) Economic Indicator Brief: Economic Diversity 2019 uses a modified Herfindahl Index to calculate the diversification scores and considers the number of industries in the state, the gross domestic product of each industry in the state, and the state’s total gross domestic product. The full methodology is included in the report.
Regional Economies
A portion of Missouri’s Annual Economic Report is dedicated to exploring the regional economies of the state. The economies of each region are very different, and the analysis provides data and information on the industries and workforce important to the area.
St. Louis and Kansas City have more than one workforce development area within their metropolitan statistical areas (MSA). The data for these areas is combined for analysis and reporting purposes.
Central Region
The Central Region is comprised of 19 counties in the center of the state. The region’s civilian labor force numbers over 320,000, or 10.6% of Missouri’s total labor force. The regional unemployment rate was 5.2% in 2020, and the preliminary rate for May 2021 is 3.7%.
Industries in the Central Region with the highest levels of employment in 2020 were Health Care and Social Assistance, Retail Trade, Educational Services, and Manufacturing. The Finance and Insurance industry added the most jobs with a gain of over 2,000 jobs since 2016.
Industries projected to experience the highest percentages of growth through 2028 in the Central Region are Professional and Technical Services, Health Care and Social Assistance, Accommodation and Food Service, Management of Companies and Enterprises, and Finance and Insurance. Occupational projections for the highest number of total openings, as well as the highest percentage of growth, are occupations that would typically support these industries.
Location Quotient (LQ) is an analysis of industry concentrations within a geographic region compared to the nation with 1.0 as the national average. Industries with an LQ greater than 1.0 indicate a higher concentration, thus requiring more than the average number of skilled workers to support the industry. Industries with high LQs in the Central Region include Administration of Human Resource Programs, Gasoline Stations, National Security and International Affairs, and Administration of Economic Programs.
Kansas City Region
The Kansas City Region is comprised of five counties in the west central portion of the state. The region’s civilian labor force numbers over 620,000, or 20.3% of Missouri’s total labor force. The regional unemployment rate was 6.6% in 2020, and the preliminary rate for May 2021 is 6.1%.
Industries in the Kansas City Region with the highest levels of employment in 2020 were Health Care and Social Assistance Retail Trade, Professional and Technical Services, and Accommodation and Food Services. Health Care and Social Assistance and Professional and Technical Services added the most jobs with each gaining more than 3,700 jobs from 2016 to 2020.
Industries projected to experience the highest percentages of growth through 2028 in the Kansas City Region are Professional and Technical Services, Construction, Wholesale Trade, and Real Estate and Rental and Leasing. Occupational projections for the highest number of total openings, as well as the highest percentage of growth, are occupations that would typically support these industries.
Industries with high LQs in the Kansas City Region include Transportation Equipment Manufacturing, Data Processing and Hosting, and Paper Manufacturing.
Northeast Region
The Northeast Region is comprised of 16 counties in the northeastern portion of the state. The region’s civilian labor force numbers over 128,000, or 4.2% of Missouri’s total labor force. The regional unemployment rate was 5.4% in 2020, and the preliminary rate for May 2021 is 4.1%.
Industries in the Northeast Region with the highest levels of employment in 2020 were Health Care and Social Assistance, Retail Trade, and Accommodation and Food Services.
Industries projected to experience the highest percentages of growth through 2028 in the Northeast Region are Wholesale Trade, Retail Trade, Administrative and Waste Services, and Transportation and Warehousing. Occupational projections for the highest number of total openings, as well as the highest percentage of growth, are occupations that would typically support these industries.
Industries with high LQs in the Northeast Region include those related to transportation such as Gasoline Stations, Truck Transportation, and Transportation Equipment Manufacturing. Agriculture-related industries of Animal Production and Aquaculture and Crop Production, and other industries such as Nonmetallic Product Manufacturing, General Merchandise Stores, and Nursing and Residential Care, also have notable LQs above the average.
Northwest Region
The Northwest Region is comprised of 18 counties in the northwestern portion of the state. The region’s civilian labor force numbers over 125,000, or 4.1% of Missouri’s total labor force. The regional unemployment rate was 4.7% in 2020, and the preliminary rate for May 2021 is 3.9%.
Industries in the Northwest Region with the highest levels of employment in 2020 were Health Care and Social Assistance, Retail Trade, and Public Administration.
Industries projected to experience the highest percentages of growth through 2028 in the Northwest Region are Health Care and Social Assistance, Transportation and Warehousing, Construction, and Wholesale Trade. Occupational projections for the highest number of total openings, as well as the highest percentage of growth, are occupations that would typically support these industries.
Industries with high LQs in the Northwest Region include Food Manufacturing, Fabricated Metal Product Manufacturing, Gasoline Stations, and Chemical Manufacturing.
Ozark Region
The Ozark Region is comprised of seven counties within the southwest portion of the state. The region’s civilian labor force numbers over 274,000, or 9.0% of Missouri’s total labor force. The regional unemployment rate was 6.2% in 2020, and the preliminary rate for May 2021 is 4.1%.
Industries in the Ozark Region with the highest levels of employment in 2020 were Health Care and Social Assistance, Retail Trade, Accommodation and Food Services, Education Services, and Manufacturing. Industries with the greatest employment increase from 2016 to 2020 were Health Care and Social Assistance, Manufacturing, Professional and Technical Services, and Construction.
Industries projected to experience the highest percentages of growth through 2028 in the Ozark Region are Management of Companies and Enterprises, Administrative and Waste Services, Construction, Educational Services, and Real Estate and Rental and Leasing. Occupational projections for the highest number of total openings, as well as the highest percentage of growth, are occupations that would typically support these industries.
Industries with high LQs in the Ozark Region include those related to tourism such as Scenic and Sightseeing Transportation, Accommodation, Performing Arts and Spectator Sports, Gasoline Stations, and a variety of stores. The industries of Truck Transportation and Telecommunications also have LQs above the average.
South Central Region
The South Central Region is comprised of 12 counties in the center of the southern portion of Missouri. The region’s civilian labor force numbers over 82,000, or 2.7% of Missouri’s total labor force. The regional unemployment rate was 6.7% in 2020, and the preliminary rate for May 2021 is 4.7%.
Industries in the South Central Region with the highest levels of employment in 2020 were Health Care and Social Assistance, Manufacturing, Retail Trade, Educational Services, and Accommodation and Food Services. Even though these industries are the top employers for the region, some have experienced slight decreases in employment from 2016 to 2020.
Industries projected to experience the highest percentages of growth through 2028 in the South Central Region are Health Care and Social Assistance, Professional and Technical Services, and Transportation and Warehousing. Occupational projections for the highest number of total openings, as well as the highest percentage of growth, are occupations that would typically support these industries.
Industries with high LQs in the South Central Region include those related to wood products such as Wood Product Manufacturing and Forestry and Logging. Gasoline Stations, Machinery Manufacturing, and Nursing and Residential Care Facilities also have LQs above the average.
Southeast Region
The Southeast Region is comprised of 13 counties in the southeastern portion of the state. The region’s civilian labor force numbers over 165,000, or 5.4% of Missouri’s total labor force. The regional unemployment rate was 6.0% in 2020, and the preliminary rate for May 2021 is 4.3%.
Industries in the Southeast Region with the highest levels of employment in 2020 were Health Care and Social Assistance, Manufacturing, Retail Trade, and Accommodation and Food Services. Even though these industries are the top employers for the region, some have experienced slight decreases in employment from 2016 to 2020.
Industries projected to experience the highest percentages of growth through 2028 in the Southeast Region are Health Care and Social Assistance; Mining, Professional and Technical Services, Transportation and Warehousing, and Accommodation and Food Services. Occupational projections for the highest number of total openings, as well as the highest percentage of growth, are occupations that would typically support these industries.
Industries with high LQs in the Southeast Region include Mining (except Oil and Gas), Gasoline Stations, Crop Production, Wood Product Manufacturing, Truck Transportation, and Nonmetallic Mineral Product Manufacturing.
Southwest Region
The Southwest Region is comprised of seven counties in the southwestern corner of the state. The region’s civilian labor force numbers over 135,000, or 4.4% of Missouri’s total labor force. The regional unemployment rate was 5.7% in 2020, and the preliminary rate for May 2021 is 3.9%.
Industries in the Southwest Region with the highest levels of employment in 2020 were Manufacturing, Health Care and Social Assistance, Retail Trade, and Educational Services. Industries with the largest increases in employment from 2016 to 2020 were Manufacturing, Health Care and Social Assistance, and Wholesale Trade.
Industries projected to experience the highest percentages of growth through 2028 in the Southwest Region are Wholesale Trade, Transportation and Warehousing, and Construction. Occupational projections for the highest number of total openings, as well as the highest percentage of growth, are occupations that would typically support these industries.
Industries with high LQs in the Southwest Region include those related to manufacturing such as Food Manufacturing; Electrical Equipment, Appliance, and Component Manufacturing; Fabricated Metal Manufacturing; and Wood Product Manufacturing. Other industries with high LQs include Animal Production and Aquaculture, Truck Transportation, and Gasoline Stations.
St. Louis Region
The St. Louis Region is comprised of five counties in the eastern part of the state. The region’s civilian labor force numbers over 1,070,000, or 35.1% of Missouri’s total labor force. The regional unemployment rate was 6.3% in 2020, and the preliminary rate for May 2021 is 4.6%.
Industries in the St. Louis Region with the highest levels of employment in 2020 were Health Care and Social Assistance, Retail Trade, Manufacturing, and Accommodation and Food Services. Industries with the largest increases in employment from 2016 to 2020 were Finance and Insurance, Health Care and Social Assistance, and Transportation and Warehousing.
Industries projected to have the highest percentages of growth through 2028 in the St. Louis Region are Health Care and Social Assistance, Real Estate and Rental and Leasing, Wholesale Trade, Professional, and Technical Services, and Educational Services. Occupational projections for the highest number of total openings, as well as the highest percentage of growth, are occupations that would typically support these industries.
Industries with high LQs in the St. Louis Region include Data Processing, Hosting, and Related Services; Management of Companies and Enterprises; Chemical Manufacturing; and Museums, Historical Sites, and Similar Institutions.
West Central Region
The West Central Region is comprised of 13 counties in the west central part of Missouri. The region’s civilian labor force is over 126,000, or 4.2% of Missouri’s total labor force. The region’s unemployment rate was 5.6% in 2020, and the preliminary rate for May 2021 is 4.3%.
Industries in the West Central Region with the highest levels of employment in 2020 were Health Care and Social Assistance, Retail Trade, Accommodation and Food Services, and Construction. Industries with the largest increases in employment from 2016 to 2020 were Construction, Health Care and Social Assistance, and Wholesale Trade.
Industries projected to experience the highest percentages of growth through 2028 in the West Central Region are Administrative and Waste Services, Construction, Transportation and Warehousing, and Wholesale Trade. Occupational projections for the highest number of total openings, as well as the highest percentage of growth, are occupations that would typically support these industries.
Industries with high LQs in the West Central Region include Gasoline Stations, National Security and International Affairs, Support Activities for Agriculture and Forestry, Animal Production and Aquaculture, and Food Manufacturing.
Current Industry Demand
In 2020, Missouri total covered employment was 2,675,000 jobs. Covered employment represents jobs covered by unemployment insurance, or about 95% of all jobs. This was a decrease of 137,600 jobs or 4.9%, compared to 2019. This decline is due to the impacts of the COVID-19 global pandemic. Compared to 2011, Missouri employment increased by 92,600 jobs or 3.6%. Recovery from the pandemic began in the second half of 2020 and is continuing through 2021.
Comparing 2020 to 2011, the largest growing industries in both employment growth and percent change are Health Care and Social Assistance (54,928 or 13.5%); Professional and Technical Services (37,093 or 29.4%); Construction (23,028 or 21.7%); Manufacturing (20,220 or 8.2%), and Transportation and Warehousing (16,404 or 16.2%). The most significant declines in employment over the 10-year period were Other Services (-16,625 or -19.1%); Information (-12,308 or -20.1%); Educational Services (-10,515 or -4.8%); Arts, Entertainment, and Recreation (-10,436, or -20.1%); and Retail Trade (-10,271 or -3.4%).
Industries that experienced employment growth above the state average between both 2020 compared to 2016 and 2020 compared to 2011, are Professional and Technical Services; Construction; Transportation and Warehousing; Agriculture, Forestry, Fishing, and Hunting; Health Care and Social Assistance; Manufacturing; Finance and Insurance; and Real Estate and Rental and Leasing..

Current Occupational Demand
Current occupational demand can be attained through job ads placed by employers. From July 2018–June 2019, over 500,000 online job ads were placed for jobs located in Missouri according to Labor Insight/Burning Glass.
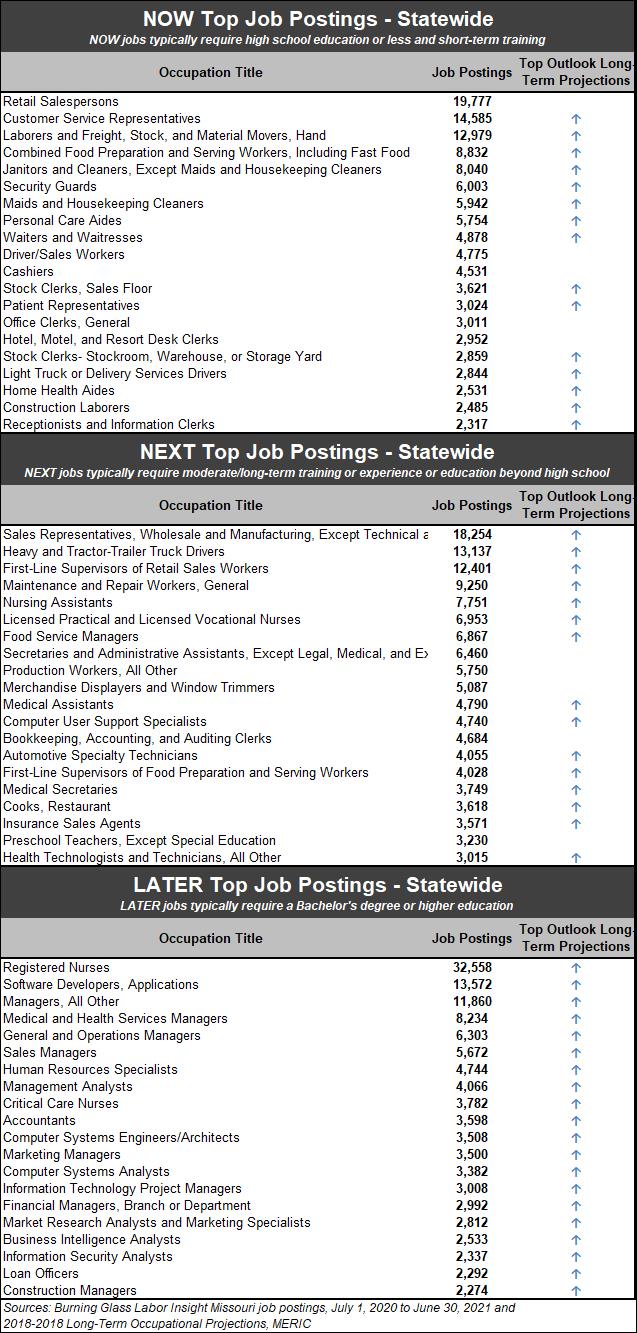
Job ads were placed for positions at every skill and education level. Missouri uses a system of NOW, NEXT and LATER to categorize jobs according to the typical education and experience required for success on the job. NOW jobs typically require a high school education or less and short-term training. NEXT jobs typically require moderate- to long-term training or experience or education beyond high school. LATER jobs typically require a bachelor’s degree or higher education.
NOWoccupations with the highest number of job postings include Retail Salespersons; Customer Service Representatives; Laborers and Freight, Stock, and Material Movers; Food Preparation and Serving Workers; and Janitors and Cleaners. Occupations with the most job postings in the NEXT category are Sales Representatives, Wholesale and Manufacturing; Heavy and Tractor-Trailer Truck Drivers; Supervisors of Retail Sales Workers; Maintenance and Repair Workers; and Nursing Assistants. LATER occupations with the highest number of job postings are Registered Nurses; Software Developers, Applications; Managers; Medical and Health Services Managers; and General and Operations Managers.
Many of the occupations with the most job postings also appear on the list of jobs with the highest number of projected openings through 2028. The occupations with high numbers of job postings and top job outlook are identified with the arrow.
Missouri Workforce 2020 Survey
In July through September of 2020, nearly 700 Missouri companies were surveyed to gauge the state’s workforce from the employers’ point of view. This marked the second consecutive year of this survey. Companies were randomly selected from a categorized list of businesses queried from the Reference USA employer database. Employers surveyed represented the mix of industries found in Missouri and were equally located in metro and non-metro areas. The questions helped with understanding Missouri employers’ hiring trends, skill needs, experience and education requirements, and the impact of COVID-19 on those businesses.
Most employers anticipate maintaining employment levels over the next 12 months. A greater percentage of employers plan to expand employment vs. decrease employment next year, despite being surveyed during the COVID-19 pandemic.
The largest barrier to expanding employment continues to be a shortage of workers with knowledge and skills. The greatest shortages are found in Skilled Trades and Patient Care. In nearly all skills areas, shortages were higher in non-metro areas vs. metro areas. Employers responding to the survey were less likely to consider justice-involved individuals than last year’s survey respondents.
Industry Projections
Long-term industry projections help determine the industries that are expected to add positions within their organizations over time. The latest round of projections are through the ten-year period ending in 2028.
The projections reveal several industries with both high employment numbers and above average growth rates compared to the state average. The top five industries by numeric employment change are Health Care and Social Assistance, Accommodation and Food Services, Professional and Technical Services, Construction, and Transportation and Warehousing.

Occupational Projections
Job openings occur due to three reasons – exits, transfers, and growth. Exits occur as people leave the workforce for reasons such as retirement. Transfers occur when workers leave one occupation for a different occupation. Occupational growth occurs as businesses grow and need more workers to serve their customers.
Emerging occupations can be identified through growth openings. The chart below identifies occupations that have the highest number of growth openings and higher than the state average growth rates. The total number of openings indicate the projected number of vacancies businesses need to fill annually.
Growth openings are projected at all education and training levels and are listed by the highest number of growth openings. The highest number of growth openings in NOW occupations are Personal Care Aides, Food Preparation and Serving Workers, Janitors and Cleaners, Laborers and Freight and Stock Movers, and Home Health Aides. The largest growth in NEXT occupations is Cooks, Nursing Assistants, Medical Secretaries, Heavy and Tractor-Trailer Truck Drivers, and Medical Assistants. LATER occupations with the highest growth are Registered Nurses, Software Developers, General and Operations Managers, Market Research Analysts and Marketing Specialists, and Computer Systems Analysts. These occupations are consistent with those identified as emerging industries.

Real-Time Labor Market Data
Job ads placed by employers offer another source of information on the knowledge, skills, and certifications requested by Missouri’s employers. Labor Insight/Burning Glass is a data tool that spiders to over 35,000 different websites with job ads. The information found in the ads are placed in a database and can be queried to gain intelligence on employer needs.
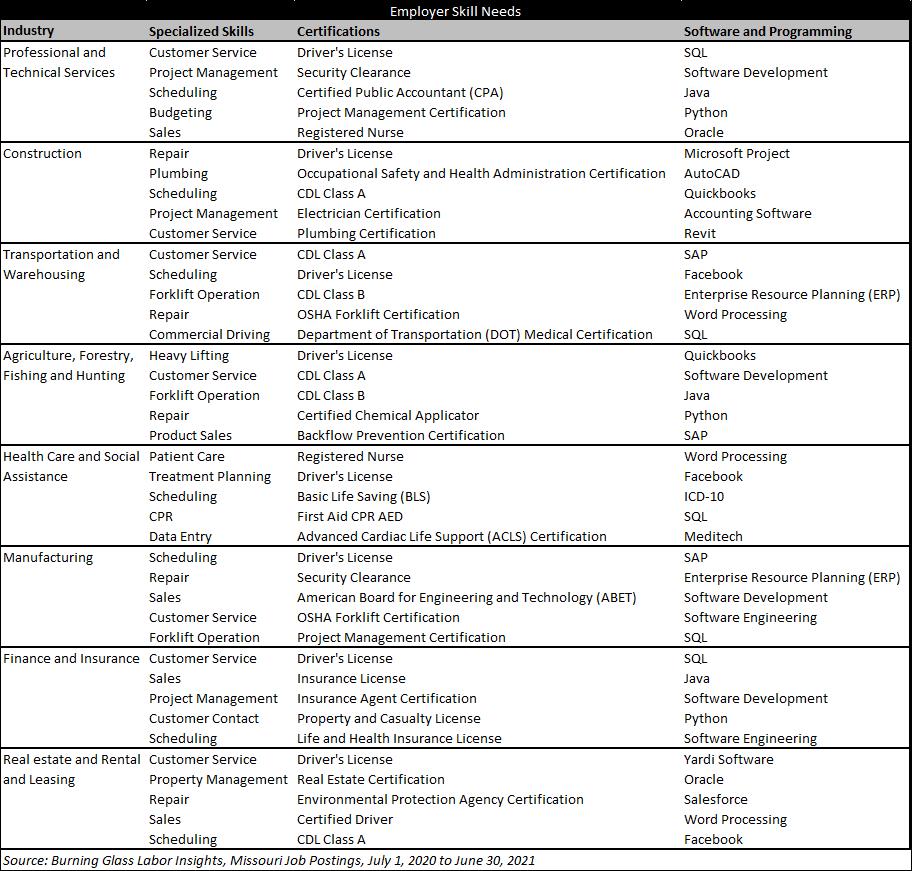
Eight industries growing faster than the state average over the last 5 and 10 years were identified in the Economic Analysis section of the Missouri Combined State Plan. These industries are listed below with the specialized skills, certifications, and software and programming requested most by employers in job ads from July 1, 2020 to June 30, 2021.
In the software and programming category, Microsoft Office and its products, such as Word, Excel, PowerPoint, and Access, ranked at the top of the list across all industries. Industry-specific programs identified in the job ads are listed in the table.