Located in:
- II. Strategic Elements
The Unified or Combined State Plan must include a Strategic Planning Elements section that analyzes the State’s current economic environment and identifies the State’s overall vision for its workforce development system. The required elements in this section allow the State to develop data-driven goals for preparing an educated and skilled workforce and to identify successful strategies for aligning workforce development programs to support economic growth. Unless otherwise noted, all Strategic Planning Elements apply to Combined State Plan partner programs included in the plan as well as to core programs. Where requirements identify the term “populations”, these must include individuals with barriers to employment as defined at WIOA Section 3. This includes displaced homemakers; low-income individuals; Indians, Alaska Natives, and Native Hawaiians; individuals with disabilities, including youth who are individuals with disabilities; older individuals; ex-offenders; homeless individuals, or homeless children and youths; youth who are in or have aged out of the foster care system; individuals who are English language learners, individuals who have low levels of literacy, and individuals facing substantial cultural barriers; farmworkers (as defined at section 167(i) of WIOA and Training and Employment Guidance Letter No. 35-14); individuals within 2 years of exhausting lifetime eligibility under the Temporary Assistance for Needy Families program; single parents (including single pregnant women); and long-term unemployed individuals. Additional populations include veterans, unemployed workers, and youth, and others that the State may identify.
- a. Economic, Workforce, and Workforce Development Activities Analysis
The Unified or Combined State Plan must include an analysis of the economic conditions, economic development strategies, and labor market in which the State’s workforce system and programs will operate.
- a. Economic, Workforce, and Workforce Development Activities Analysis
II. a. 1. B. Workforce Analysis
The Unified or Combined State Plan must include an analysis of the current workforce in the State and within various state regions. Provide key analytical conclusions in aggregate as well as disaggregated among populations to identify potential disparities in employment and educational attainment and understand labor force conditions for items (i)-(iii) below. Populations analyzed must include individuals with barriers to employment described in the first paragraph of Section II. Analysis must include—
i. Employment and Unemployment
Provide an analysis of current employment and unemployment data, including labor force participation rates, and trends in the State.
ii. Labor Market Trends
Provide an analysis of key labor market trends, including across existing industries and occupations.
iii. Education and Skill Levels of the Workforce
Provide an analysis of the educational and skill levels of the workforce.
Current Narrative:
(B) Workforce Analysis
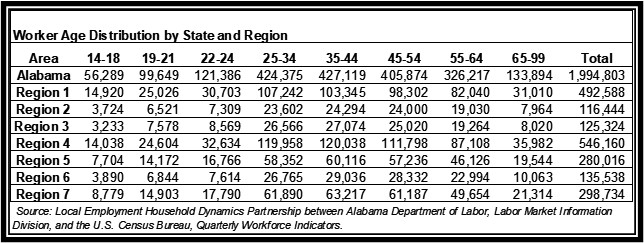
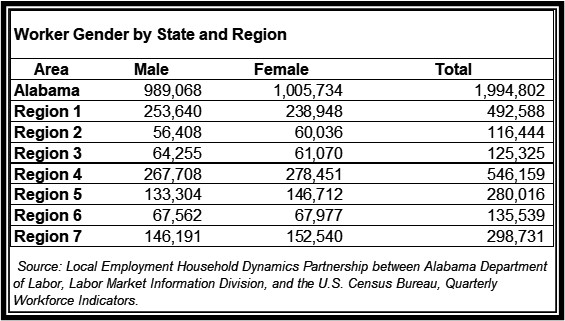
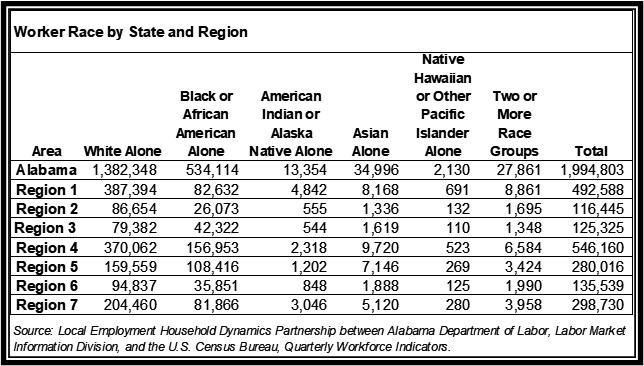
In 2023, Alabama had a total of 1,994,803 workers. Among these positions, the top two age distribution categories were ages 25 to 34 and ages 35 to 44 which each accounted for 21 percent of Alabama’s workers. Age groups that followed in descending order were ages 45 to 54 (20%) and ages 55 to 64 (16.35%), while all other age groups accounted for less than 7% of workers in Alabama. The job distribution based on gender revealed that 49.58% (989,068) were held by male workers, while 50.42% (1,005,734) were filled by female workers.
Ethnically, most workers in Alabama in 2023 were of White ethnicity alone, comprising 69.30% (1,382,348) of the workforce. African American workers accounted for 26.78% (534,114), while Asian workers represented 1.75% (34,996). Workers from American Indian or Alaska Native, Native Hawaiian or other Pacific Islanders, and those identifying with two or more races each constituted less than 2% of workers in Alabama in 2023.
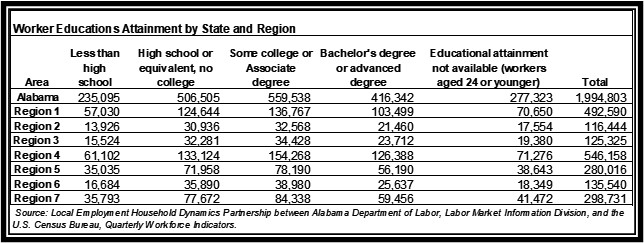
Regarding educational attainment, the largest proportion of workers, 28.05% (559,538), in Alabama had attained some college or an associate degree. 25.39% (506,505) of the workers had obtained a high school degree or equivalent with no college. In descending order, the remainder of the educational levels of Alabama workers were made of bachelor’s degree or advanced degree (20.87%; 416,342), age 29 or younger workers whose educational attainment data was unavailable (13.90%; 277,323) and less than high school (11.79%; 235,095).
Region 1 featured 492,588 workers with many of those positions held by workers aged 25 to 34, workers who were white alone ethnically, and workers who were male. The largest group of educational attainment in region 1 accounting for 27.76% was workers with some college or associate degree.
In Region 2 of Alabama, the predominant demographic features among the 116,444 jobs in 2023 were workers in the age ranges of 25 to 54, those identifying as white alone ethnically, individuals with some college or associate degrees, and a larger representation of female workers as compared to male workers.
Region 3 totaled 125,324 jobs and featured largely workers 25 to 44, workers identifying as white alone ethnically, and workers who were male. The largest portion of educational attainment in this region was some college or associate degree.
Region 4 held the most jobs out of all regions with 546,160, predominantly occupied by individuals aged 25 to 44, mostly white individuals, and a larger portion of females than males. The most prevalent educational attainment among the workforce in region 4 was individuals with some college or associate degree.
Region 5 accounted for 280,016 jobs mainly held by workers aged 35 to 44, individuals of white ethnicity, those possessing some college education or an associate degree, and those who identified as female.
In Region 6, the majority demographic features among the 135,538 jobs included individuals aged 35 to 44, those identifying as white alone ethnically, individuals with some college or associate degrees, and a slightly larger representation of female workers.
Region 7 totaled 298,734 jobs that were held by a majority of workers aged 35 to 44, workers who were of white alone ethnicity, workers who had obtained some college or associate degree, and workers who were female.
Workforce Analysis Data
Poverty Rates by Education
Population Below Poverty with Less than High School Education (Ages 18-64)
 The above counties show the dispersion of select poverty status by education.
| Top 10 Highest Rates | Top 10 Lowest Rates | ||
|---|---|---|---|
| County | 18 to 64 Years Cohort | County | 18 to 64 Years Cohort |
| Hale | 51.80% | Dale | 22.00% |
| Greene | 51.10% | St. Clair | 21.50% |
| Lowndes | 44.00% | Baldwin | 20.90% |
| Washington | 43.00% | Franklin | 20.90% |
| Macon | 41.30% | Shelby | 20.90% |
| Clarke | 41.10% | Lee | 20.60% |
| Fayette | 40.00% | Butler | 20.30% |
| Pickens | 38.00% | Chambers | 19.90% |
| Barbour | 37.50% | Cleburne | 18.90% |
| Choctaw | 37.00% | Coosa | 10.60% |
Population Below Poverty with a High School Education or GED

| To 10 Highest Rates | Top 10 Lowest Rates | ||
|---|---|---|---|
| County | 25 Years and Older | 25 Years and Older | |
| Greene | 32.60% | Cullman | 12.70% |
| Sumter | 28.30% | Lawrence | 12.70% |
| Monroe | 27.70% | St. Clair | 12.40% |
| Dallas | 26.30% | Lauderdale | 12.00% |
| Macon | 25.10% | Clay | 10.90% |
| Perry | 24.70% | Shelby | 10.40% |
| Marengo | 23.50% | Baldwin | 10.30% |
| Wilcox | 23.30% | Limestone | 10.30% |
| Hale | 23.20% | Coosa | 9.50% |
| Clarke | 21.80% | Elmore | 9.00% |
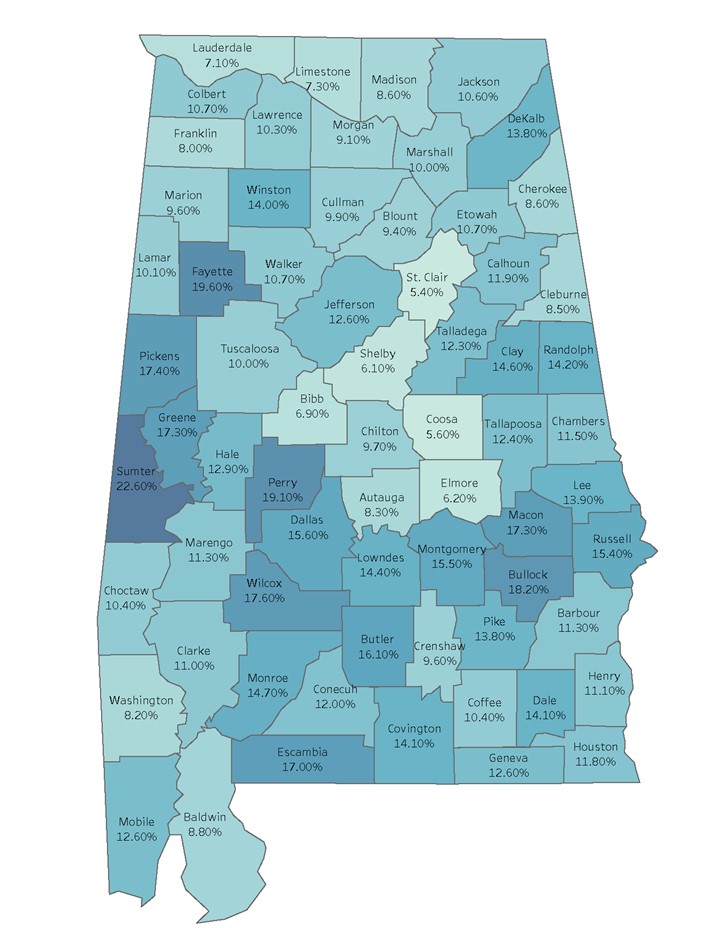
Population Below Poverty with Some College
| Top 10 Highest Rates | Top 10 Lowest Rates | ||
|---|---|---|---|
| County | 25 Years and Older | County | 25 Years and Older |
| Sumter | 22.60% | Autauga | 8.30% |
| Fayette | 19.60% | Washington | 8.20% |
| Perry | 19.10% | Franklin | 8.00% |
| Bullock | 18.20% | Limestone | 7.30% |
| Wilcox | 17.60% | Lauderdale | 7.10% |
| Pickens | 17.40% | Bibb | 6.90% |
| Greene | 17.30% | Elmore | 6.20% |
| Macon | 17.30% | Shelby | 6.10% |
| Escambia | 17.00% | Coosa | 5.60% |
| Butler | 16.10% | St. Clair | 5.40% |
Population Below Poverty with bachelors degree or above

| Top 10 Highest Rates | Top 10 Lowest Rates | ||
|---|---|---|---|
| County | 25 Years and older | County | 25 Years and older |
| Geneva | 11.30% | Jackson | 3.10% |
| Bullock | 11.20% | Hale | 2.90% |
| Monroe | 11.20% | Shelby | 2.80% |
| Greene | 9.40% | Cherokee | 2.70% |
| Bibb | 9.10% | Elmore | 2.70% |
| Marengo | 8.30% | Washington | 2.50% |
| Covington | 7.00% | Wilcox | 2.30% |
| DeKalb | 7.00% | Limestone | 2.10% |
| Franklin | 6.60% | Henry | 1.90% |
| Russell | 6.60% | Cleburne | 1.20% |
ACS Data is presented showing the dispersion of poverty in counties across Alabama counties. This map data has been sorted to reflect data points for ages 25 years and over who have been determined to meet the poverty status. This age group was selected as it represents the largest portion of potential participants in the civilian labor force. Each figure represents the population at different levels of educational attainment that are living below poverty. In Region 1, 3 out of the top 10 lowest rates, meaning lowest percentage of population living in poverty with a high school education or equivalent. In figure IIA1b.1, Region 3 had the top two highest counties with the population having less than a high school education and living below poverty and had 4 counties out of the Top 10 Highest Rates. Conversely, Region 5 had 3 counties out of the Top 10 Lowest Rates, meaning the lowest rate of population with less than a high school education and living below poverty. In each figure, Region 3 has at least 3 counties within the Top 10 Highest Rates. The counties with the highest percentage of population below poverty for each attainment level were Hale (51.8%), Greene (32.6%), Sumter (22.6%), and Geneva (11.8%) respectively. It is important to note that Hale had the highest percentage of population below poverty for those with less than a high school education but was the 2nd lowest for those with a bachelor’s degree or higher at 2.9%.
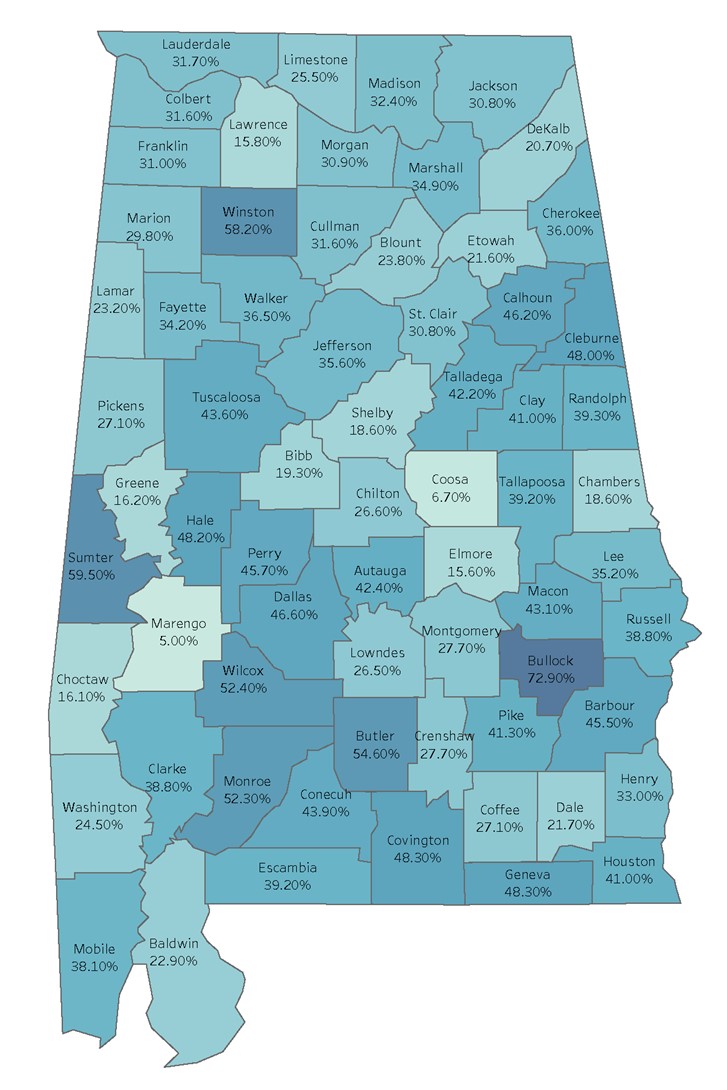
Poverty Status by Employment Status
Population below poverty and Unemployed
| Top 10 Highest Rates | Top 10 Lowest Rates | ||
|---|---|---|---|
| County | 25 Years and Older | County | 25 Years and Older |
| Bullock | 72.90% | DeKalb | 20.70% |
| Sumter | 59.50% | Bibb | 19.30% |
| Winston | 58.20% | Chambers | 18.60% |
| Butler | 54.60% | Shelby | 18.60% |
| Wilcox | 52.40% | Greene | 16.20% |
| Monroe | 52.30% | Choctaw | 16.10% |
| Covington | 48.30% | Lawrence | 15.80% |
| Geneva | 48.30% | Elmore | 15.60% |
| Hale | 48.20% | Coosa | 6.70% |
| Cleburne | 48.00% | Marengo | 5.00% |
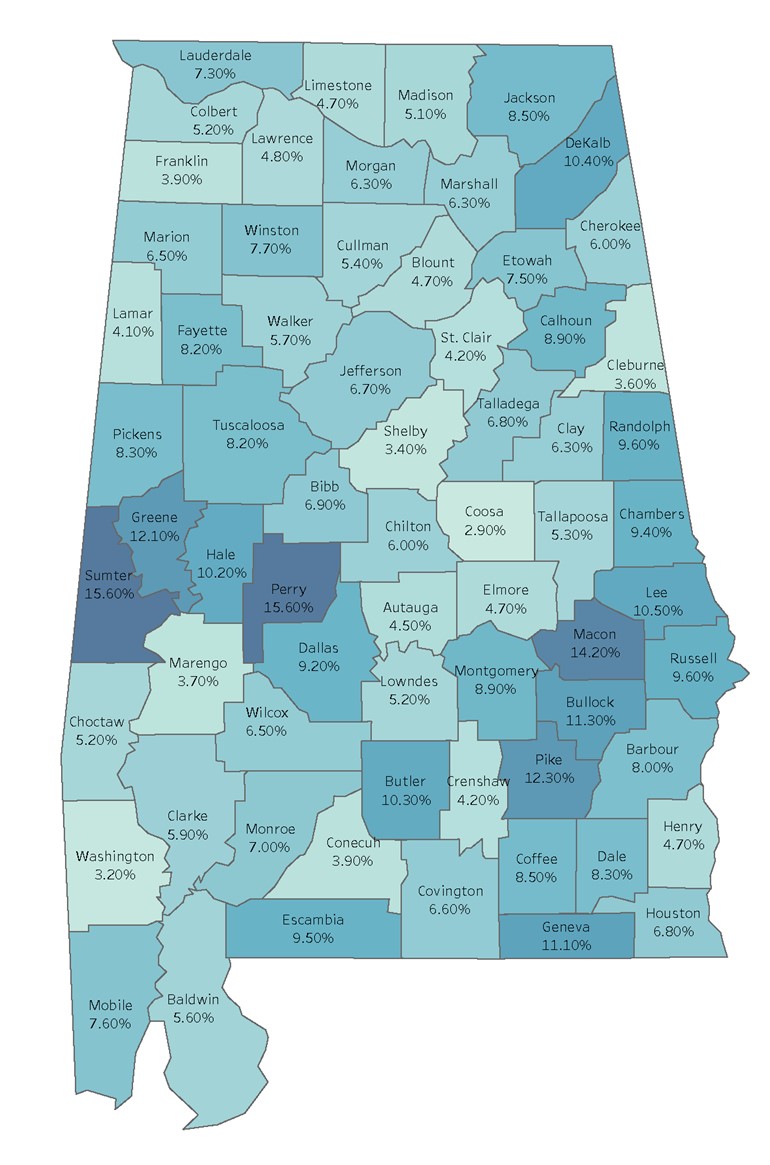
Population Below Poverty and Employed
| Top 10 Highest Rates | Top 10 Lowest Rates | ||
|---|---|---|---|
| County | 25 Years and Older | County | 25 Years and Older |
| Perry | 15.60% | Crenshaw | 4.20% |
| Sumter | 15.60% | St. Clair | 4.20% |
| Macon | 14.20% | Lamar | 4.10% |
| Pike | 12.30% | Conecuh | 3.90% |
| Greene | 12.10% | Franklin | 3.90% |
| Bullock | 11.30% | Marengo | 3.70% |
| Geneva | 11.10% | Cleburne | 3.60% |
| Lee | 10.50% | Shelby | 3.40% |
| DeKalb | 10.40% | Washington | 3.20% |
| Butler | 10.30% | Coosa | 2.90% |
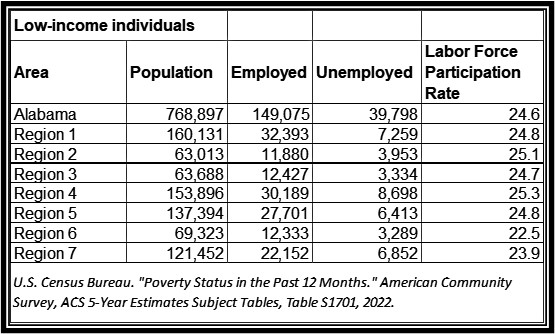
Figures IIA1b.5 and IIA1b.5 are taken from the ACS and mapped to visualize the difference in individuals 25 years and over that have had a poverty status in the past 12 months and have an employment status of Unemployed or Employed. In figure IIA1b.5, Regions 3, 6, and 7, or the south and west part of Alabama, had 7 out of the 10 highest rates of those living in poverty that were unemployed. Region 6 had 3 counties: Butler (54.6%), Covington (48.3%) and Geneva (48.3%) with high rates. Region 3 had 2 counties with the highest rates which were Hale (48.2%) and Sumter (59.5%), however region 3 also had 3 counties (Marengo, Greene, and Bibb) with the lowest rate of population in poverty with an unemployment status. Additionally, region 7 had two counties with the highest rates being the rural counties of Monroe and Wilcox and one county that had the lowest rate of poverty being Choctaw at only 16.1%. Data was analyzed on a county basis to determine different disparities within each region.
Poverty Status by Work Experience
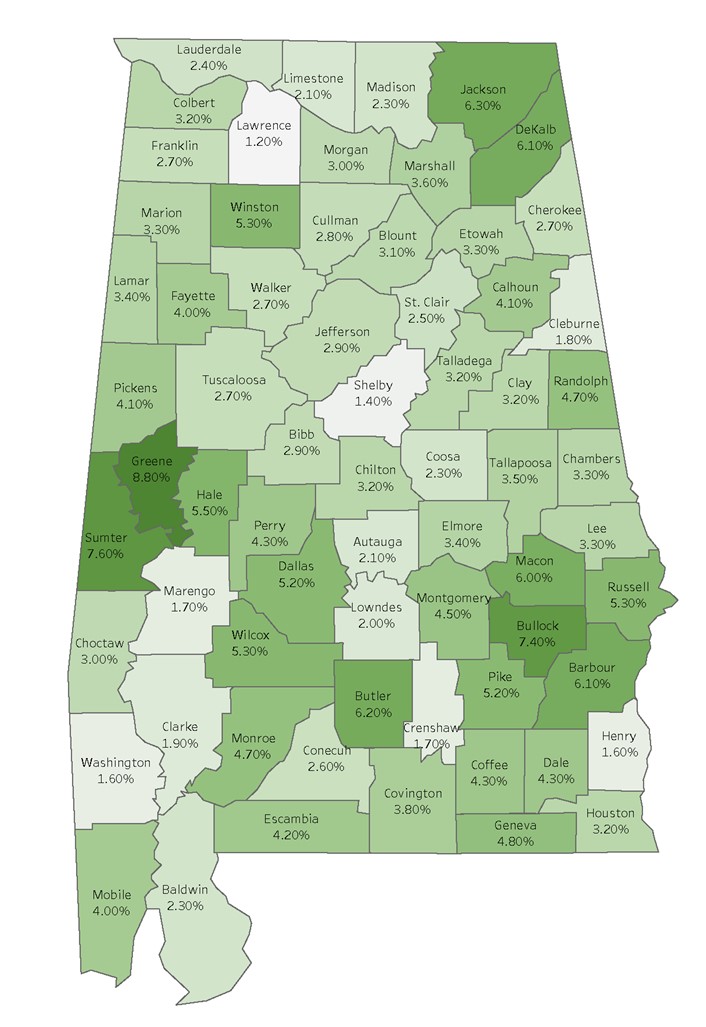
Population Below Poverty that Worked Full Time
| Top 10 Highest Rates | Top 10 Lowest Rates | ||
|---|---|---|---|
| County | 25 Years and Older | County | 25 Years and Older |
| Greene | 8.80% | Limestone | 2.10% |
| Sumter | 7.60% | Lowndes | 2.00% |
| Bullock | 7.40% | Clarke | 1.90% |
| Jackson | 6.30% | Cleburne | 1.80% |
| Butler | 6.20% | Crenshaw | 1.70% |
| Barbour | 6.10% | Marengo | 1.70% |
| DeKalb | 6.10% | Henry | 1.60% |
| Macon | 6.00% | Washington | 1.60% |
| Hale | 5.50% | Shelby | 1.40% |
| Russell | 5.30% | Lawrence | 1.20% |
Source: U.S. Census Bureau. "Poverty Status in the Past 12 Months." American Community Survey, ACS 5-Year Estimates Subject Tables, Table S1701, 2022
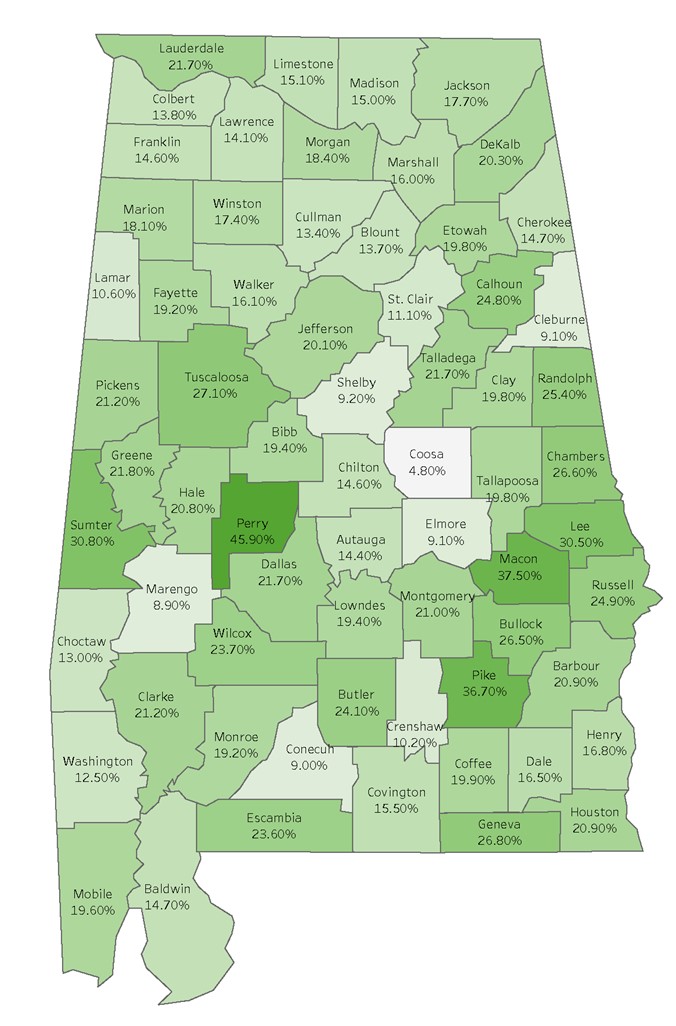
Population Below Poverty that worked Part Time
| Top 10 Highest Rates | Top 10 Lowest Rates | ||
|---|---|---|---|
| County | 25 Years and Older | County | 25 Years and Older |
| Perry | 45.90% | Crenshaw | 4.20% |
| Macon | 37.50% | St. Clair | 4.20% |
| Pike | 36.70% | Lamar | 4.10% |
| Sumter | 30.80% | Conecuh | 3.90% |
| Lee | 30.50% | Franklin | 3.90% |
| Tuscaloosa | 27.10% | Marengo | 3.70% |
| Geneva | 26.80% | Cleburne | 3.60% |
| Chambers | 26.60% | Shelby | 3.40% |
| Bullock | 26.50% | Washington | 3.20% |
| Randolph | 25.40% | Coosa | 2.90% |
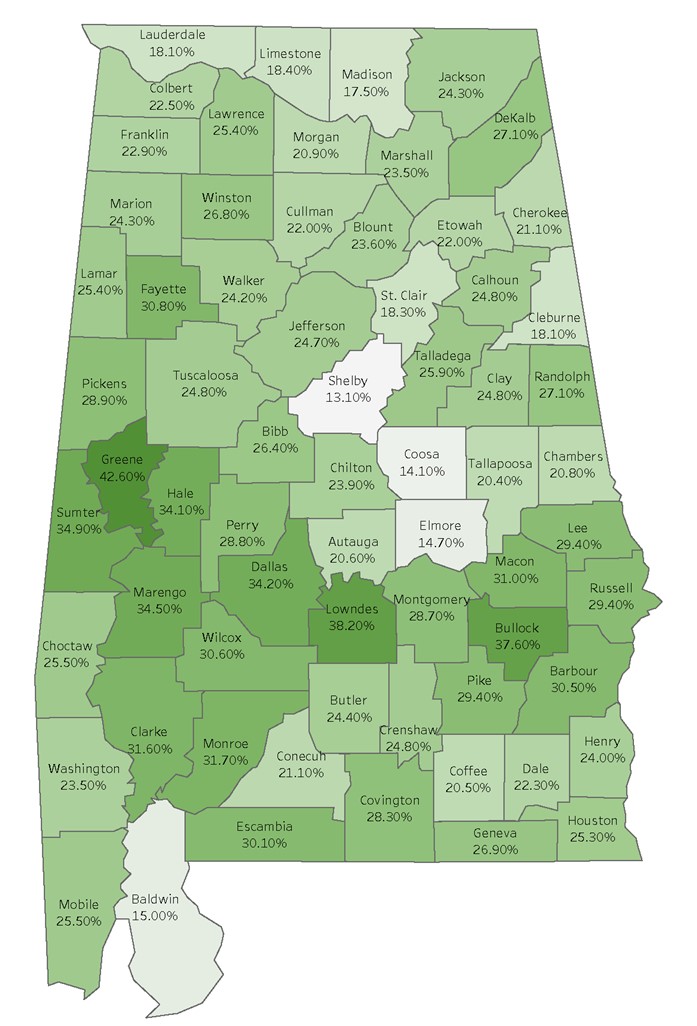
Population Below Poverty That Did Not Work
| Top 10 Highest Rates | Top 10 Lowest Rates | ||
|---|---|---|---|
| County | 25 Years and Older | County | 25 Years and Older |
| Greene | 42.60% | Tallapoosa | 20.40% |
| Lowndes | 38.20% | Limestone | 18.40% |
| Bullock | 37.60% | St. Clair | 18.30% |
| Sumter | 34.90% | Cleburne | 18.10% |
| Marengo | 34.50% | Lauderdale | 18.10% |
| Dallas | 34.20% | Madison | 17.50% |
| Hale | 34.10% | Baldwin | 15.00% |
| Monroe | 31.70% | Elmore | 14.70% |
| Clarke | 31.60% | Coosa | 14.10% |
| Macon | 31.00% | Shelby | 13.10% |
Poverty Status by Work Experience from the ACS shows the difference in rates of the population living in poverty for the last 12 months by Individuals that worked full-time, part-time, or did not work at all. For those who worked full-time and were below poverty, the highest percentage of poverty was 8.8% in Greene County which resides in region 3. For those who worked part-time and below poverty, Perry County had the highest rate at 45.9%. For perry county, those who worked full-time had a percentage of 4.3% living below poverty. Which indicates that there might be a disparity between which type of educational attainment and types of jobs are available in that specific county. For those who did not work, the highest county is in Greene County with a percentage of 42.6% living below poverty. For Greene County, those who worked part-time had a percentage of 21.8% below poverty and was not the highest county. However, it was the highest county for those who worked full-time. This might be an indication of whether enough jobs are available for the skills of the workforce in that county. Individuals with full-time work experience have less of a percentage of poverty in each county than those who did not work at all. Bullock, Greene, Macon, and Sumter were the most occurring county names in the Top 10 Highest Rate sections of each figure which reside in regions 3 and 5.
In conclusion, the counties that are most at risk of having a high percentage of individuals 25 years and over living below poverty are those that have individuals with less than a high school education, are unemployed, and did not work in the past 12 months. Analysis was done on a county-by-county basis to understand the disparities between each region. For example, many regions that had the highest percentage of poverty also had the lowest percentage of poverty but in different counties. Most of the counties with the highest percentage were rural counties. Whereas the counties with the lowest rate were either a mostly urban county or were connected to an urban county.
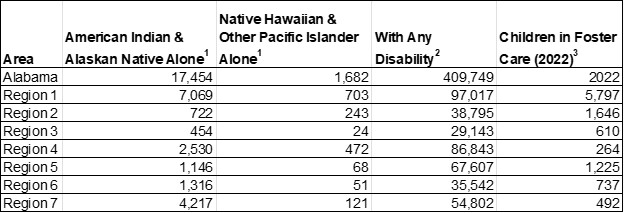
Census Bureau. "Employment Status." American Community Survey, ACS 5-Year Estimates Subject Tables, Table S2301, 2022; 2U.S. Census Bureau. "Employment Status." American Community Survey, ACS 5-Year Estimates Subject Tables, Table S2301, 2022; 3Source: 2022 Alabama Kid’s Count Data Book.
(i) Workforce Employment and Unemployment/Underemployment
A Center for Business and Economic Research survey of the state’s workforce found that the underemployed were more likely to be employed in healthcare support; food preparation and serving related; building and grounds cleaning and maintenance; sales and related; office and administrative support; and transportation and material moving occupations in retail trade, transportation and warehousing, health care and social assistance, educational services, and accommodation and food services industries. The underemployed working part-time would prefer full-time employment and tend to commute shorter distances. According to this study, the main reasons for being underemployed are low wages at available jobs, a lack of job opportunities in their area, living too far from jobs, other family or personal obligations, other undisclosed reasons, childcare responsibilities, and owning a house in their area. CBER notes that ongoing economic development efforts can help in this regard to get underemployed workers into jobs that fully utilize their skills. Non-workers have a very different set of reasons they cite for their status including retirement, disability or other health concerns, social security limitations, and other undisclosed reasons. Such workers may become part of the labor force if these problems can be addressed. 60.2% of underemployed workers were not satisfied with their jobs and most dissatisfied with their earnings. For training, the underemployed were reported as more willing to train than other groups but concerned about who pays for the training. “Workers typically do not wish to pay for the training and so their willingness is highest when the cost is fully borne by the government and lowest when the trainee must pay the full costs. This suggests that workers expect the government to bear at least part of the training cost. This expectation may result from worker awareness of government workforce programs that provide such assistance. Underemployed workers are more willing to train for a new or better job irrespective of who bears the cost burden.”
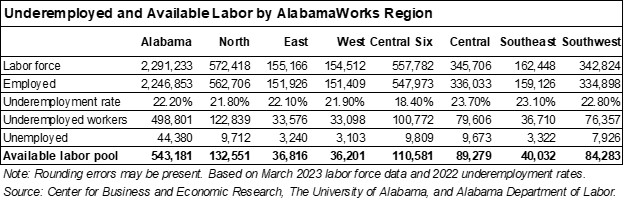
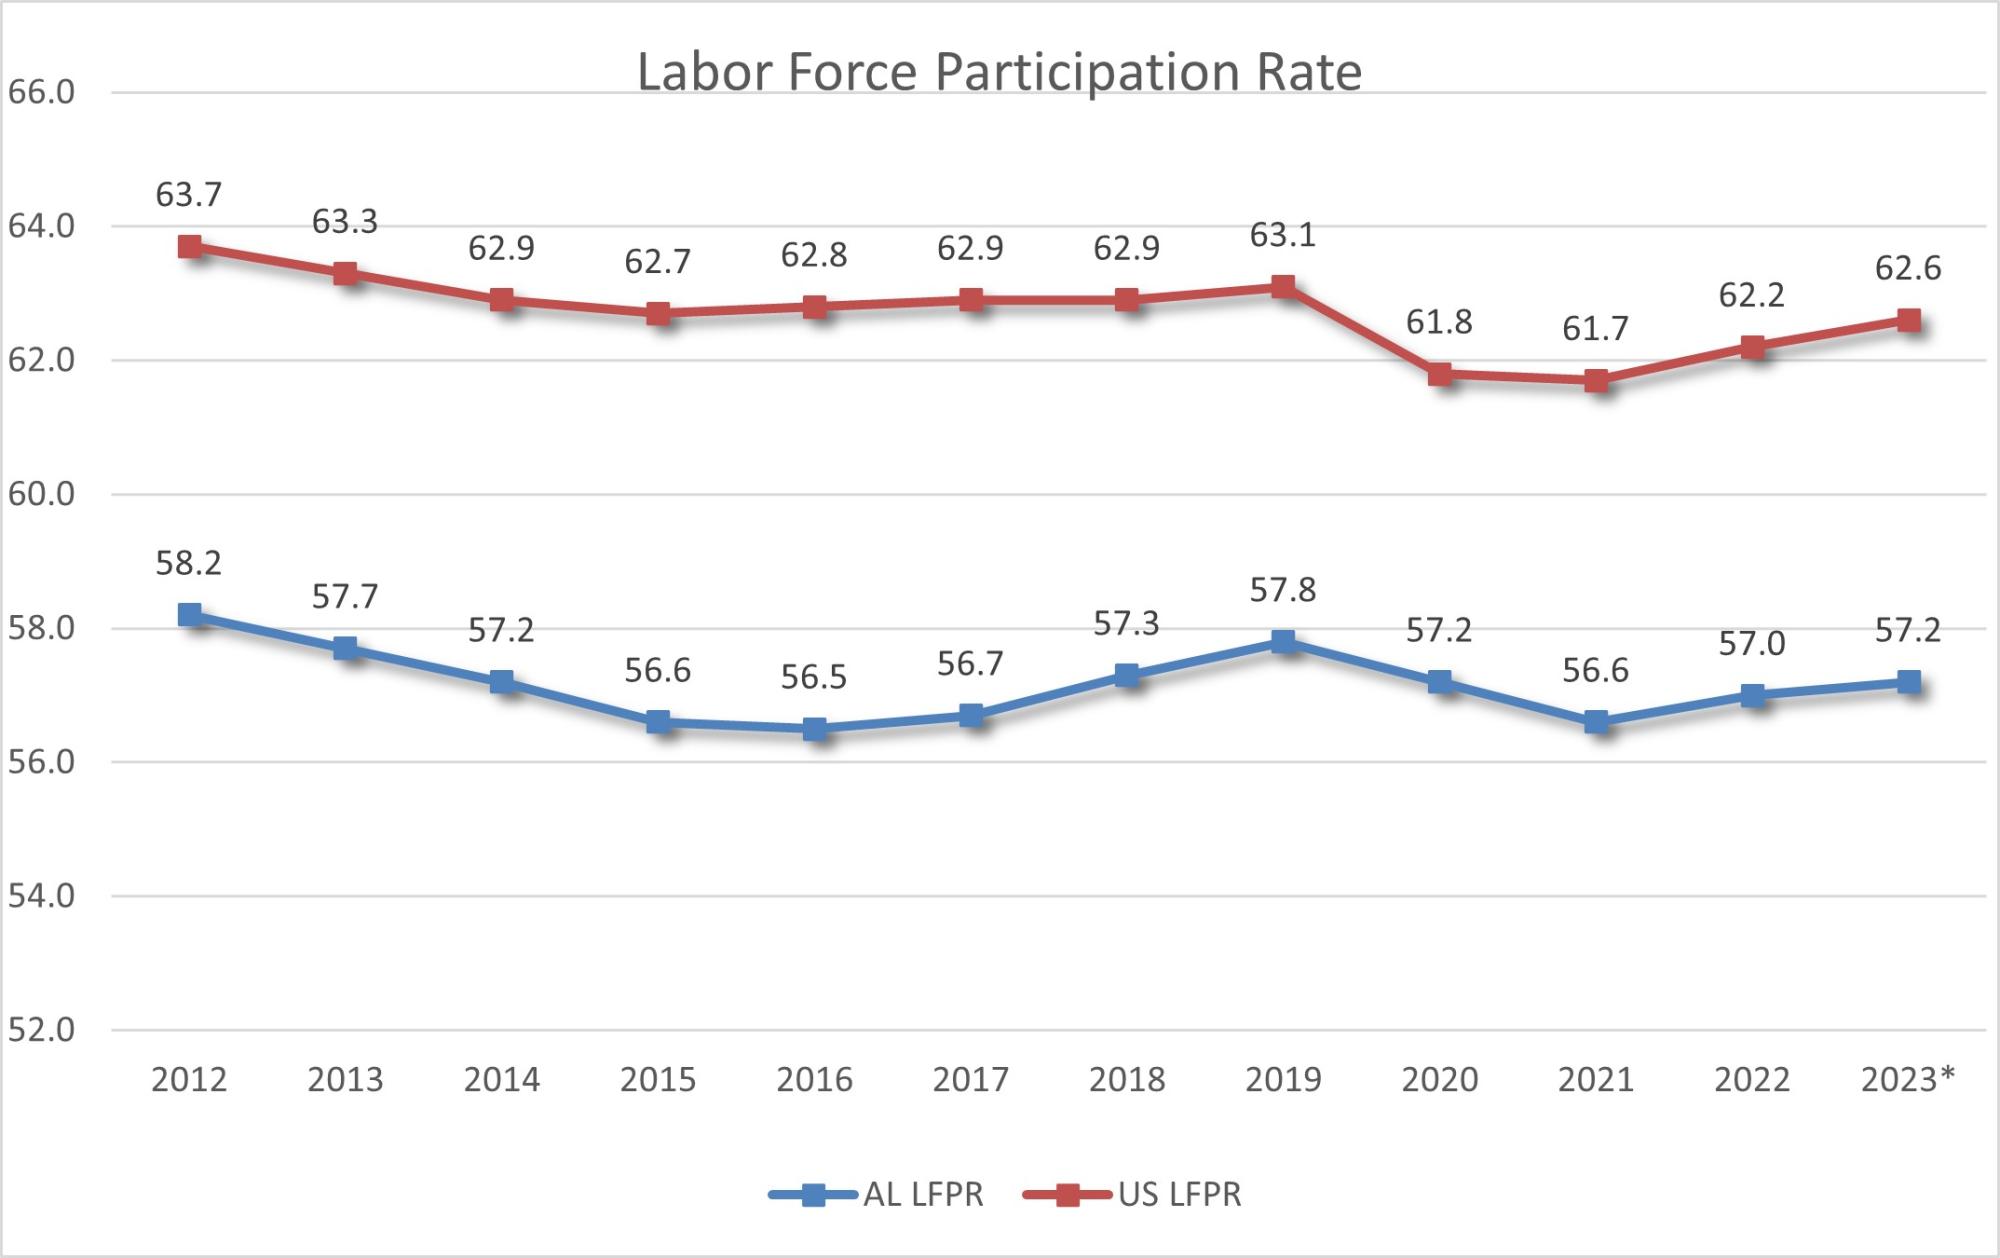
Alabama’s labor force participation rate rose 0.2 percentage point from 2022 to 2023. However, it has dropped since pre-pandemic (2019) by 0.6 percentage points. The decomposition of the components of the labor force participation rate shows the estimate of the employed increase by 2.5% from 2019 annual average to the estimated 2023 annual average, but the estimated unemployed dropped by 25.29% for the same time frame. Similarly, a review of the first payments from Alabama’s Unemployment Insurance system shows a drop of 26.38% from 2019 to 2023. The civilian labor force is at an all-time high for Alabama, despite the record breaking decreases in the unemployed estimates.
Prime-age workers are for those ages 25 through 54 and this portion of the workforce is the bulk of Alabama’s labor force. The labor force participation rate for prime age workers1 increased by 0.4 percentage points between 2019(78.1) and 2023(78.5). Female prime age workers1 increased 0.7 percentage points from 72.0% in 2019 to 72.7% in 2023. Male prime-age workers1 increased 0.1 percentage point from 84.5% in 2019 to 84.6% in 2023.
(ii) Labor Market Trends
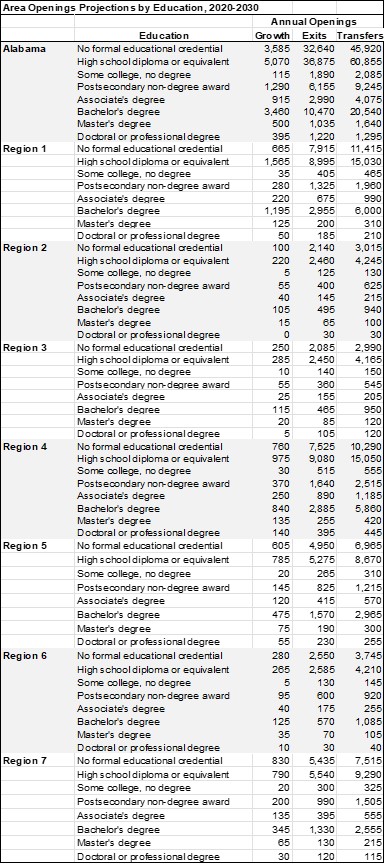
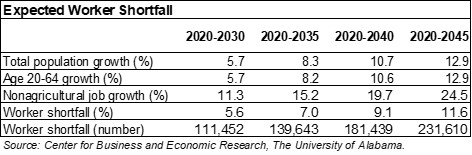
Alabama’s job growth is projected to be faster than labor force growth. From a 2020 base, worker shortfalls of about 111,500 are expected in 2030. The projected worker shortfalls are expected to rise to 139,600 and 181,400 in 2035 and 2040, respectively. By 2045, worker shortfalls of about 231,600 are expected (Table A.18). The state must therefore prioritize developing worker skills and addressing the projected shortfalls through 2045. Indeed, the state is currently experiencing worker shortfalls, which have been made worse by the recent pandemic.
(iii) Education and Skill Levels of the Workforce